1255
Test-retest reliability of velocity pulsatility in perforating arteries in the basal ganglia at 3T MRI1Radiology, UMC Utrecht, Utrecht, Netherlands, 2Neurology, UMC Utrecht, Utrecht, Netherlands
Synopsis
We studied the test-retest reliability of assessing perforating arteries of the BG with 2D-PC velocity measurements at 3T-MRI, with and without repositioning of the patient. We showed reproducible assessment of Ndetected, Vmean and vPI in the perforating arteries, independent of slice planning. The relative imprecision was smallest for Vmean (12%) and highest for vPI (32%). The interrater-reliability assessment showed high consistency between two raters (mean variability <5% for all parameters). We found very similar Limits of Agreement with and without repositioning, which indicated that uncertainty in measuring these parameters was dominated by scanner and physiological noise, rather than by planning.
Introduction
Standard image-based markers do not reflect cerebral small vessel disease (SVD) itself, but rather macroscopic brain damage as a consequence of vessel abnormalities. We developed 7T-MRI methods to directly assess pulsatility and blood-flow velocity in the perforating arteries as hemodynamic parameters, that are potentially useful for evaluating vascular dysfunction in SVD1,2,3. Previous studies have shown that these parameters are higher in the basal ganglia (BG) in patients with lacunar infarction than in healthy controls4. The ability to assess these hemodynamic parameters of the perforating arteries on standard clinical 3T MRI as well, would allow for widespread use in clinical studies regarding SVD. This would accelerate the evaluation of the value of these measurements in research and clinical care. Recent work showed the feasibility of measuring pulsatility in the perforating arteries at the level of the BG using 3T-MRI5. However, test-retest measurements have not been performed on 3T MRI, but are necessary for statistical power calculations in future studies.This study assessed the reliability of 3T-MRI blood-flow velocity measurements in perforating arteries in the BG by performing test-retest scans. Scans were repeated with and without repositioning of the patient to also be able to assess the relative contribution of the planning uncertainty to the measurement errors.
Methods
We included 35 subjects in this study, in order to allow for estimating the standard deviation of the test-retest variability within 20% of its true values with 90% confidence6. Subjects were only included if they did not have cerebrovascular disease. The blood-flow velocity of the small perforating arteries of the BG was measured using a previously published velocity encoded 2-dimensional phase contrast (2D-PC) acquisition performed at 3T-MRI with a 32-channel head coil5.The first 2D-PC MRI acquisition (Table 1) was acquired after initial subject positioning. Then, subjects were briefly taken out of the scanner and repositioned after a 5 minute break. After repositioning, a second 2D-PC scan was acquired to assess test-retest reliability with repositioning. A third 2D-PC scan was acquired without repositioning and replanning (Figure 1) for assessing test-retest reliability without repositioning. The 2D-PC images were processed and analyzed as described previously1,5,7, to assess the number of detected perforating arteries (Ndetected), mean blood-flow velocity (Vmean), and velocity pulsatility index (vPI=(Vmax-Vmin)/Vmean). vPI is obtained from the mean normalized velocity curve over all Ndetected. ROIs were manually drawn by two trained independent researchers (RT and SP) to delineate the BG area. Inter-rater agreement was determined based on the first scans of 10 subjects. Similarity of the ROIs was determined by calculating the Dice Coefficient (DC)8.
Results
The average DC between the 10 ROIs drawn by RT and SP was 0.90 (range: 0.87-0.93) and the calculated Ndetected, Vmean, and vPI using the ROIs of both observers are given in Table 2. The mean and standard deviations of Ndetected, Vmean, vPI and heart rate for all subjects are given in Table 3.Test-Retest reliability with repositioning:
Vmean was similar between first and second 2D-PC scan (6.5±1.0 cm/s and 6.6±1.4 cm/s respectively). vPI decreased from 0.45±0.14 to 0.40±0.17 between the first and second 2D-PC scan although this was not significant (P=0.18). Ndetected was the same in both the first scan 8±3, and after repositioning 8±3. Limits of agreement (LoA) after repositioning, expressed as percentage of the mean values were 23±18%, 13±9% and 32±15% for Ndetected, Vmean and vPI, respectively.
Test-Retest reliability without repositioning:
Comparing the two acquired 2D-PC images without repositioning, results were very similar between the second scan: Ndetected=8±3, Vmean=6.6±1.4 cm/s and vPI=0.40±0.17 and the third scan: Ndetected=9±4, Vmean=6.5±0.9 cm/s and vPI=0.41±0.16 (Figure 3). LoA without repositioning, expressed as percentage of the mean values were 24±19%, for 12±10% and 28±17% for Ndetected, Vmean and vPI.
Discussion
The analysis tool enabled automatic and reproducible assessment of Ndetected, Vmean and vPI in the perforating arteries of the BG, independent of slice planning. Slice planning was done by only one experienced operator (JZ) for all included subjects and did not lead to a significant bias in detection of number of perforating arteries. The found values in the first scan are in line with other 3T studies5 for Ndetected (8±3 in our study, versus 5±3), Vmean (6.5±1.0 cm/s versus 6.0±1.3 cm/s) and vPI (0.45±0.14 versus 0.49±0.19). Our results are in the same range compared to literature using the LoA for velocity pulsatility for the lenticulostriatal arteries and middle cerebral artery (37% and 40% respectively)9 and the BG (38%)1 using 7T-MRI. Our LoA not comparable with the LoAs of Doppler Ultrasound measurements of the middle cerebral artery pulsatility, which have been reported to be >60% and described as far from satisfactory10.Conclusion
This study shows that cerebral perforating artery velocity and pulsatility measurements can be performed at 3T-MRI with reasonable reliability. This confirms that functional vascular parameters in small perforating vessels that are relevant for clinical research, e.g. in SVD, can be measured on 3T. The obtained results can be used to perform power calculations for designing such clinical studies at 3T.Acknowledgements
We thank all the study participants for their participation.The research leading to these results has received funding from the European Research Council under the European Union's Seventh Framework Programme (FP/2007-2013) / ERC Grant Agreement n. 841865.References
1. Bouvy WH, Geurts LJ, Kuijf HJ, et al. Assessment of blood flow velocity and pulsatility in cerebral perforating arteries with 7-T quantitative flow MRI. NMR Biomed. 2015;29(9):1295-1304.2. Geurts L, Biessels GJ, Luijten P, et al. Better and faster velocity pulsatility assessment in cerebral white matter perforating arteries with 7T quantitative flow MRI through improved slice profile, acquisition scheme, and postprocessing. Magn Reson Med. 2018;79(3):1473-1482.
3. Arts T, Siero JCW, Biessels GJ, et al. Automated Assessment of Cerebral Arterial Perforator Function on 7T MRI. J Magn Reson Imaging. 2021;53(1):234-241.
4. Geurts LJ, Zwanenburg JJM, Klijn CJM, et al. Higher Pulsatility in Cerebral Perforating Arteries in Patients with Small Vessel Disease Related Stroke, a 7T MRI Study. Stroke. 2019;50(1):62-68.
5. Arts T, Meijs TA, Grotenhuis H, et al. Velocity and Pulsatility Measures in the Perforating Arteries of the Basal Ganglia at 3T MRI in Reference to 7T. Front Neurosci. 2021;15:1-10.
6. Greenwood JA, Sandomire MM. Sample Size Required for Estimating the Standard Deviation as a Per Cent of its True Value. J Am Stat Assoc. 1950;45(250):257-260.
7. Geurts LJ, Bhogal AA, Siero JCW, et al. Vascular reactivity in small cerebral perforating arteries with 7 T phase contrast MRI – A proof of concept study. Neuroimage. 2018;172:470-477.
8. Sørensen T. A Method of Establishing Groups of Equal Amplitude in Plant Sociology Based on Similarity of Species Content and Its Application to Analyses of the Vegetation on Danish Commons. Biol Skr – Det K Danske Vidensk Selsk I kommission hos E Munksgaard. Published online 1948.
9. Schnerr RS, Jansen JFA, Uludag K, et al. Pulsatility of lenticulostriate arteries assessed by 7 Tesla flow MRI-Measurement, reproducibility, and applicability to aging effect. Front Physiol. 2017;8:1-10.
10. Pasquini L, Marchi L, Gaini C, et al. Intra- and Interobserver Reproducibility of Third Trimester Middle Cerebral Artery Pulsatility Index Measurement: A Prospective Cross-Sectional Study. Fetal Diagn Ther. 2020;47(3):214-219.
Figures
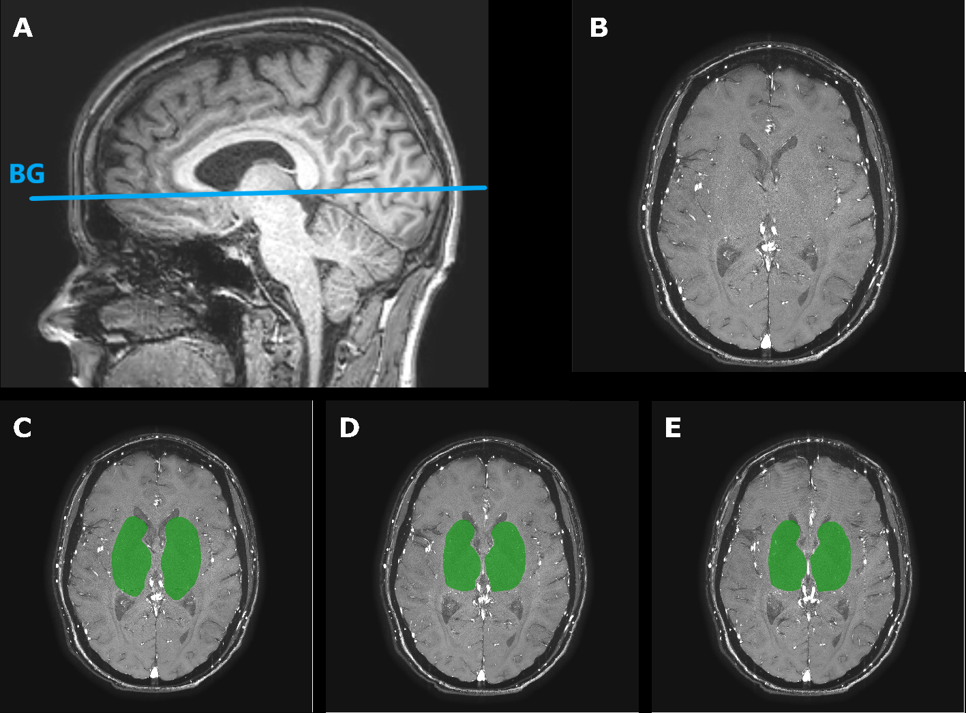
Figure 1: A) The 2D-PC MRI slice planning through the basal ganglia (BG) on a 3D T1-weighted image. B) Magnitude image of a representative 2D-PC BG slice of a subject. C) The manually drawn ROI shown in green for the first 2D-PC scan. D) The second 2D-PC after repositioning including the ROI, to test reliability with repositioning. E) The third 2D-PC immediately scanned after the second 2D-PC without repositioning including the manually drawn ROI, to test reliability without repositioning.
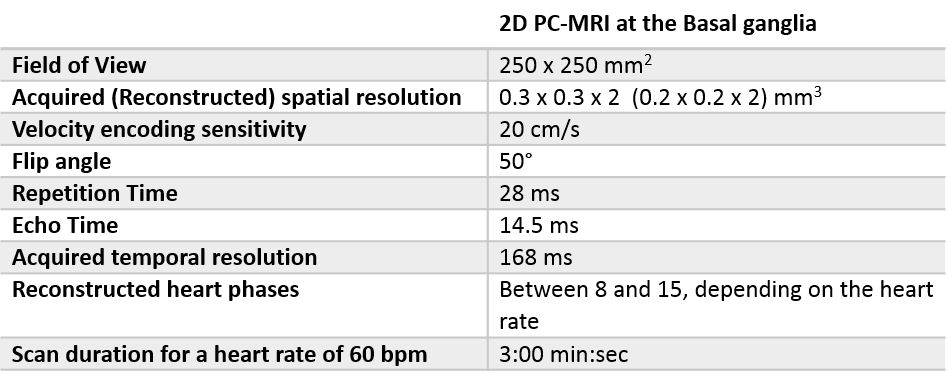
Table 1: Scan parameters
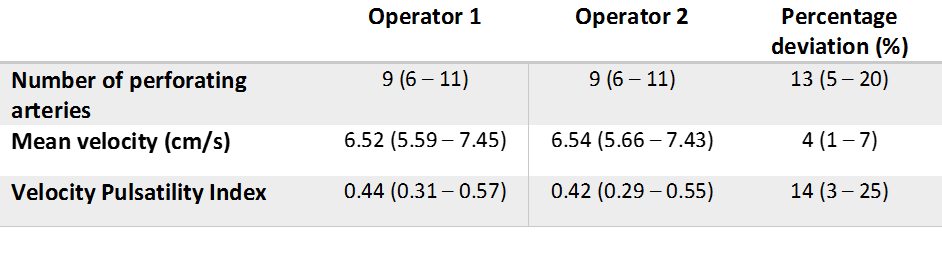
Table 2: Interrater reliability (n=10). Values given in mean with 95% confidence intervals. Percentage deviation: (abs(Operator 1 – Operator 2) /Operator 2)*100%
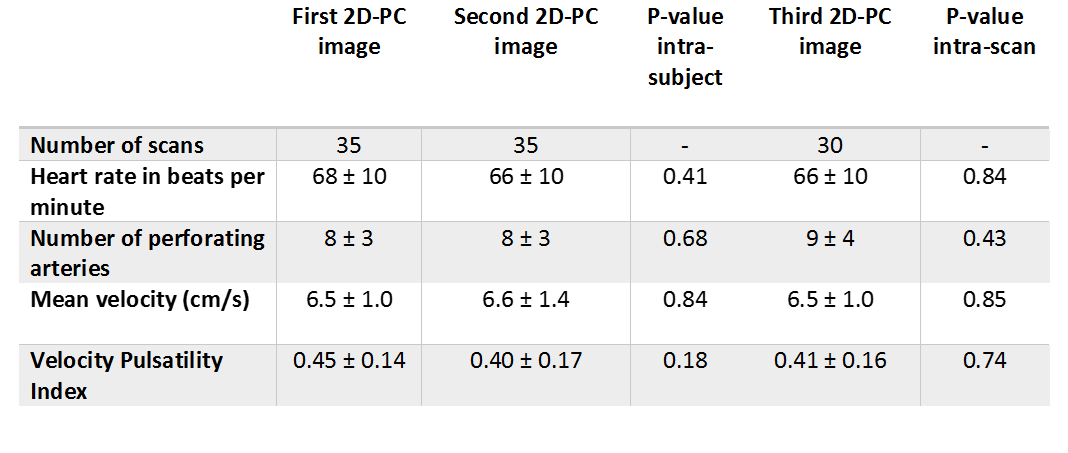
Table 3: Outcome parameters of the three 2D-PC scans. The second 2D-PC image was made after 5 minute break repositioning and replanning.The third 2D-PC image was made without repositioning and replanning.