1254
Different Brain Areas Require Different Analysis Models—fMRI Observations in Parkinson’s Disease.1NMR, Max Planck Institute for Human Cognitive and Brain Sciences, Leipzig, Germany, 2Roche Pharma Research and Early Development, Roche Innovation Center Basel, Basel, Switzerland, 3Department of Neurology, Charles University in Prague | CUNI, Prague, Czech Republic, 4| CULS · Faculty of Environmental Science, Czech University of Life Sciences Prague, Prague, Czech Republic, 5Department of Neurology and Center of Clinical Neuroscience, Charles University in Prague, Prague, Czech Republic, 6Department of Environmental Engineering, Faculty of Technology Tomas Bata University in Zlín, Zlin, Czech Republic, 7Neurology, General University Hospital in Prague, Prague, Czech Republic, 8Clinic for Cognitive Neurology, University Hospital Leipzig, Leipzig, Germany
Synopsis
Foreseeing how specific brain areas respond in time to a stimulus can be a prerequisite for a successfully conceived fMRI experiment. We demonstrate that in medicated Parkinson’s disease patients, putamen's activation peaks around the onset of tapping but does not persist throughout the tapping block, whereas sustained activation is observed in the motor cortex. Consequently, in the widely used tapping paradigm “On vs. Off L-DOPA”, the drug effect remains undetected if statistical analysis apply a block design instead of an event-related one. Ignoring this information can lead to fallacious conclusions which suggests using different models to investigate different brain regions.
Introduction.
In Parkinson’s disease (PD), a conventional approach to investigate motor alterations is to compare the time series of tapping and rest blocks, which last around 10 to 20 sec.1,2 When subtracting functional magnetic resonance imaging (fMRI) signal during tapping and rest blocks, one assumes that the motor loop’s different brain areas3 show the same response characteristics throughout the entire interval of interest. However, it has already been demonstrated in healthy subjects that activation after finger tapping has a shorter duration in the basal ganglia (BG) than in the sensorimotor cortex.4 Therefore, we first, tested similarity between healthy subjects and medicated PD patients regarding activation duration in motor and subcortical areas; second, analyzed the impact from two different analysis models, block and event-related (ER) design, on capturing the activation of subcortical regions in a PD tapping versus rest study.Methods
Thirty-two right-handed PD patients performed 25 alternating sequences consisting of blocks of 10sec unilateral finger tapping and 10sec rest. Each patient underwent two scanning sessions in a 1.5T MAGNETOM Symphony scanner (Siemens, Erlangen, Germany) using a birdcage head coil and a gradient-echo EPI sequence (TR=1000 ms, TE=54 ms, flip angle 90°). Ten coronal slices (in-plane resolution 3×3 mm2, slicethickness 3 mm, gap 1 mm) were acquired covering the basal ganglia and the primary motor cortex (M1). The first session was performed after a one-night withdrawal of L-DOPA intake, and the second session one hour after administration of 250 mg L-DOPA/25 mg carbidopa (Isicom 250, Desitin Arzneimittel, Hamburg, Germany). fMRI data analysis was performed using SPM12 with Matlab R2017b. Pre-processing was performed with realignment for motion correction, normalization to the MNI standard space, and a Gaussian spatial filter of 10mm FWHM. Three first-level analyses were performed: (i) “FIR model”, using a design matrix generated with a finite impulse response (FIR) model for an entire 20sec cycle of TAP and REST.5 The FIR model was implemented with 20 basis functions (i.e., 1 basis function for each functional volume of the cycle). Parameter estimation was performed for each individual data set resulting in 20 parameter maps. (ii) “Sustained model”, with contrast built by 10sec blocks of tapping minus 10sec rest. (iii) “Transient model”, with contrast built as “initiation events” of tapping minus rest, setting SPM’s batch session condition duration to 0 sec. After parameter estimation, second-level analyses were performed: For the FIR model (i), beta images were processed using a two-by-two-by-twenty factorial design implementing the HAND [left/right] factor as main effect including an interaction between both factors L-DOPA [on/off] and TIME [20 basis functions]. For the sustained (ii) and the transient (iii) models, second-level analyses were performed using a two-by-two factorial design (L-DOPA [on/off]; HAND [left/right]) as main effect of both factors. Significant results were obtained with p<0.05 at the voxel-level.Results
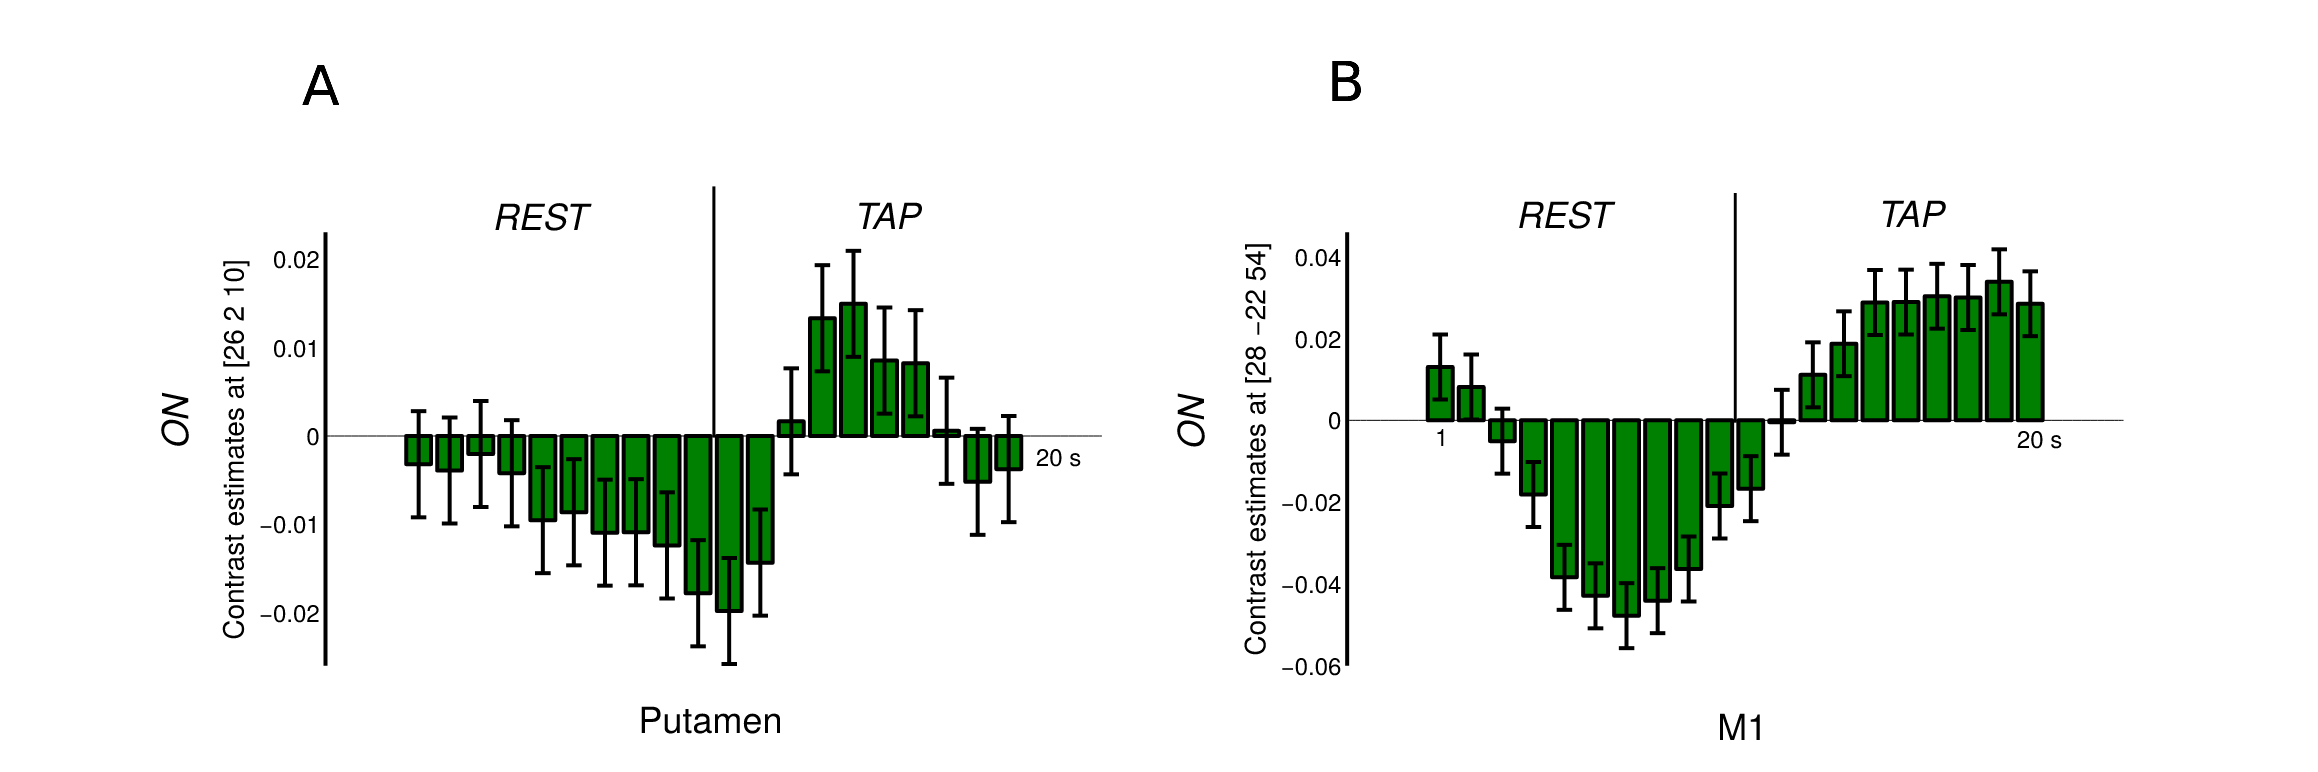
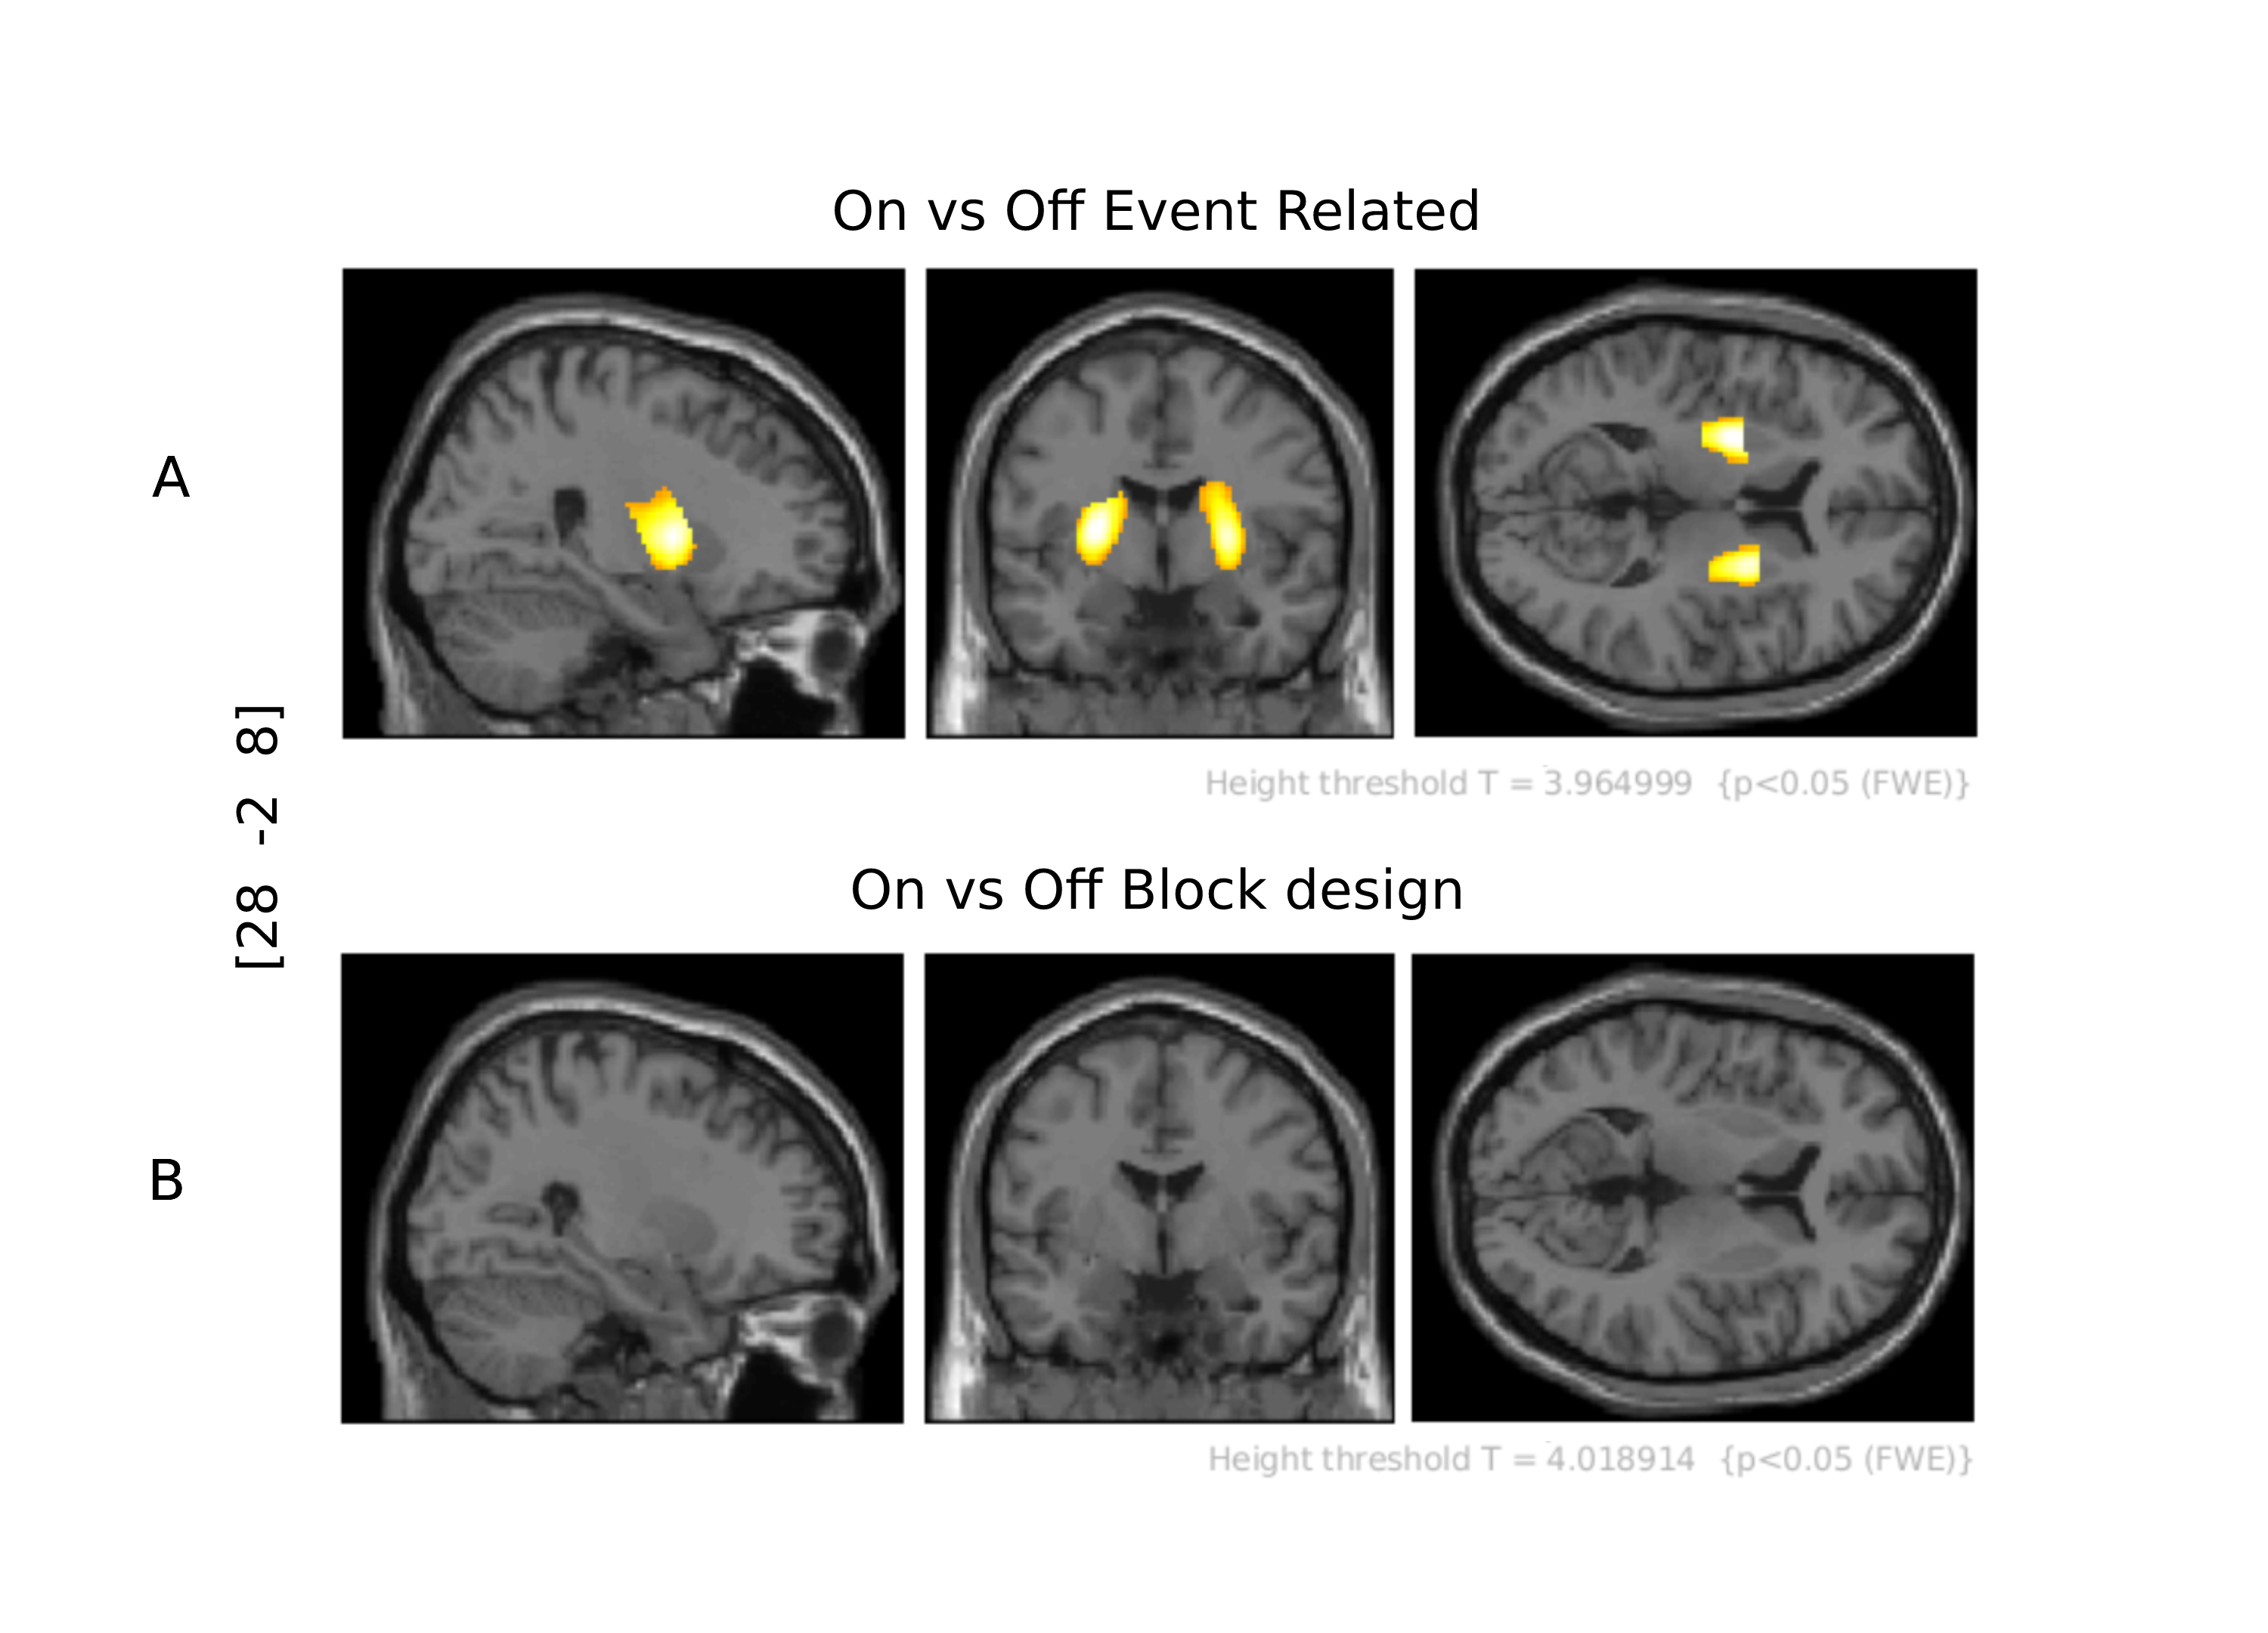
The FIR model analysis revealed that in medicated PD patients, putamen activation shows an ER , transient response, peaking after a delay of approximately 5 sec, with a sharp decay during the remaining tapping block (Fig 1A). For the same patients, the contralateral M1 presented a sustained activation (plateau) throughout the tapping block (Fig 1B). On versus Off L-DOPA group level analysis from a first-level tapping versus rest ER design revealed the left and right putamen (transient model; Fig. 2A). However, no BG voxel reached statistical relevance upon changing the duration to a 10sec block design (sustained model, Fig. 2B).Discussion
L-DOPA’s effectiveness in restoring BG’s dopamine supply6 is the plausible reason why medicated PD patients’ activation patterns in putamen and M1 are similar to those reported in healthy subjects.7,8 This literature also demonstrates that, in healthy subjects, BG and M1 activation depends on each areas’ distinct functional role and its consequent hemodynamic response (HR). While the BG are more involved in short-term movement initiation,7 M1 is involved in long-lasting execution.8 Therefore, the emergence of putamen activation employing the transient model captures the relatively sharp peak of the (delayed) hemodynamic response. By contrast, the integrated signal change is diminished with the sustained model because the inherent assumption of persistent activity averages the sharp peak and subsequent undershoot.Conclusion
Activation patterns in putamen and M1 in medicated PD patients are similar to those in healthy subjects, regarding transient and sustained behavior, respectively. We also conclude that, considering distinct hemodynamic response functions, the transient model with an ER design is the peferred choice for capturing the L-DOPA effect on basal ganglia activity over the standard block design. As different functions of the movement process (e.g. initiation, execution) recruit distinct brain areas (BG and M1) with distinct temporal characteristics, the different duration of these roles directly impact the hemodynamic response and must be taken into account in the analysis model.Acknowledgements
No acknowledgement found.References
1. Holiga Š, Möller HE, Sieger T, et al. Accounting for movement increases sensitivity in detecting brain activity in Parkinson’s disease. PLoS ONE. 2012;7(5):e36271.
2. Holiga Š, K. Mueller, Möller HE, et al. Motor matters: Tackling heterogeneity of Parkinson’s disease in functional MRI studies. PLoS ONE. 2013;8(2):e56133.
3. Alexander GE, DeLong MR, Strick PL. Parallel organization of functionally segregated circuits linking basal ganglia and cortex. Ann Rev Neurosci. 1986;9(1):357-381.
4. Moritz CH, Meyerand ME, Cordes D, Haughton VM. Functional MR imaging activation after finger tapping has a shorter duration in the basal ganglia than in the sensorimotor cortex. AJNR Am J Neuroradiol. 2000;21(7):1228-1234.
5. Mueller K, Urgošík D, Ballarini T, et al. Differential effects of deep brain stimulation and levodopa on brain activity in Parkinson’s disease. Brain Commun. 2020;2(1):fcaa005.
6. Sharma S, Singh S, Sharma V, Singh VP, Deshmukh R. Neurobiology of l-DOPA induced dyskinesia and the novel therapeutic strategies. Biomed Pharmacother. 2015;70:283-293.
7. Hauber W. (1998). Involvement of basal ganglia transmitter systems in movement initiation. Prog Neurobiol. 1998;56(5):507-540.
8. Samuel M, Williams SCR, Leigh PN, et al. Exploring the temporal nature of hemodynamic responses of cortical motor areas using functional MRI. Neurology. 1998;51(6):1567-1575.-1575.
Figures