1253
Quantifying metabolites in large brain areas by 3D Echo Planar Spectroscopic Imaging spectral averaging for a study of cigarette smoking1NeuroSpectroScopics LLC, Sherman Oaks, CA, United States, 2University of California, Los Angeles, Los Angeles, CA, United States, 3Advanced Imaging Research Center, University of Texas Southwestern Medical Center, Dallas, TX, United States, 4Hura Imaging Inc, Calabasas, CA, United States, 5Department of Psychiatry and Biobehavioral Sciences, University of California, Los Angeles, Los Angeles, CA, United States, 6Radiology, University of Miami, Miami, FL, United States
Synopsis
Spectral averaging of thousands of magnetic resonance spectroscopic imaging voxel spectra over large brain volumes provides a means of assessing low-level and/or hard-to-quantify metabolite differences over large brain volumes between groups of individuals.
Introduction
MR Spectroscopic Imaging (MRSI) is usually used to assay metabolites in specific sub-centimeter brain regions. Using an alternative analytic approach, we averaged thousands of sub-centimeter voxel spectra over large brain regions to produce high-spectral resolution high-signal-to-noise ratio (SNR) spectra representative of the brain regions, and then performed spectral analysis to obtain average metabolite levels over each region. We hypothesized that averaging thousands of spectra would facilitate quantification of low-level and difficult-to-evaluate metabolites, such as N-acetylaspartate-glutamate (NAAG), lactate (Lac), alanine (Ala) and gamma aminobutyric acid (GABA). This method was then used to evaluate brain metabolite levels for an ongoing study of adults who smoke cigarettes.Subjects and Methods
Male and female participants, aged 18-45 years, underwent brain imaging that included 3D T1-weighted MRI (MPRAGE) and 3D 1H echo planar spectroscopic imaging (EPSI) using a 3 T Siemens Prisma-fit MRI system. EPSI was performed using an inversion recovery (IR) prepared short echo time 3D pulse sequence1, provided by Siemens (Works-in-Progress 814). The subjects were people who smoked cigarettes and age-matched healthy nonsmoker controls. For those who smoked, imaging took place before and after they smoked the first cigarette of the day after overnight abstinence. Control participants underwent imaging with equivalent timing. Sixty-two (62) EPSI studies were performed in 38 subjects (8 women and 18 men who smoked, 5 women and 5 men who did not smoke).MPRAGE and EPSI were reconstructed and processed using MIDAS2. This software produces 3D arrays of phased and spectrally aligned water suppressed (WS) and water reference (WR) voxel spectra (.SID files) generated by voxels having dimensions of 4.4 x 4.4 x 5.6 mm = 0.11 cm3. MIDAS also produces a spectral quality estimate and the gray matter (GM), white matter (WM) and cerebrospinal fluid (CSF) content for each EPSI voxel. GM, WM and CSF are derived from co-analysis of the MPRAGE.
Custom python software was written to read MIDAS output, select voxel spectra for averaging and perform the spectral averaging. Whole brain (WB) averaged spectra were obtained by averaging individual voxel spectra using the following criteria: 1) within-brain (GM+WM+CSF > 0.5), 2) spectral quality = 4 (maximum) 3) CSF < 0.3 (to avoid inclusion of ventricles). It was found that these criteria admitted many spectra that had poor water suppression and excess lipid signal. Two additional criteria were used for rejecting voxel spectra: 4) absolute signal in the 0.5–1.8 ppm region > the N-Acetylaspartate (NAA) signal (2.0 ppm) and 5) absolute signal in the 3.8–4.0 ppm region greater than the NAA signal. WM averaged spectra and GM averaged spectra were obtained by averaging voxel spectra as described above except that voxels having WM < 0.8 (for WM) or GM < 0.6 (for GM) were rejected.
WB, GM, and WM averaged spectra were generated for each EPSI study and analyzed to obtain metabolite levels using a modified version of SVFit. To simplify presentation for this abstract, only creatine-referenced metabolite levels are presented. Quality control rejection of average spectra that had SNR < 6 or B0 inhomogeneity > 0.06 ppm were applied, leaving 60 EPSI studies in the WB analysis, 56 EPSI studies in the GM analysis and 55 EPSI studies in the WM analysis.
Results
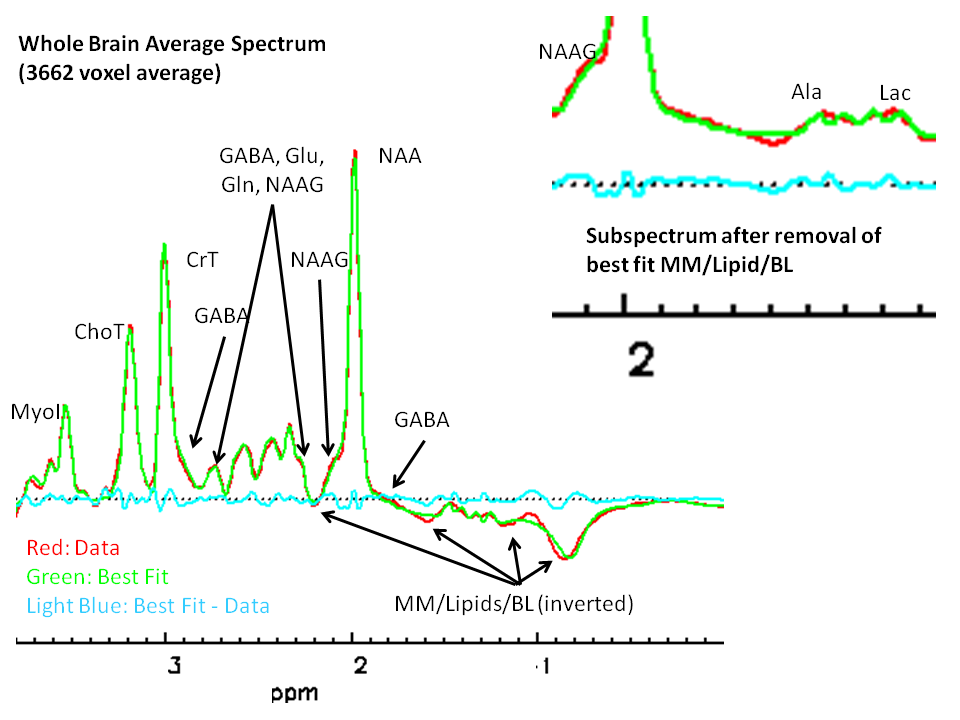
Figure 1 shows a WB average spectrum from a single subject that was obtained by averaging 3662 voxel spectra (364 cm3). Qualitatively this is a high SNR spectrum with excellent spectral resolution (e.g., baseline separation between total creatine (CrT) and total choline (ChoT) signals) despite having been formed from a large brain volume. A notable feature is the small signal on the downfield NAA signal shoulder attributable to NAAG. The figure also illustrates inverted baseline (BL), macromolecule (MM) and lipid (L) signals resulting from the IR preparation. The Figure 1 inset shows an expansion of the upfield region after subtraction of best fit MM/L/BL signals illustrating small but identifiable (not inverted) signals assigned to lactate (Lac) and alanine (Ala).Estimates of percent standard deviation of the best fit metabolite level (often referred to as the Cramer-Rao Lower Bounds estimate of goodness-of-fit) for the metabolites from 55 EPSI studies are shown in Figure 2. The figure illustrates generally high quality fits (mean across study Pct SD < 25 %) are produced for low level, difficult to quantify metabolites such as Ala, GABA, glutamine (Gln), Lac and NAAG.
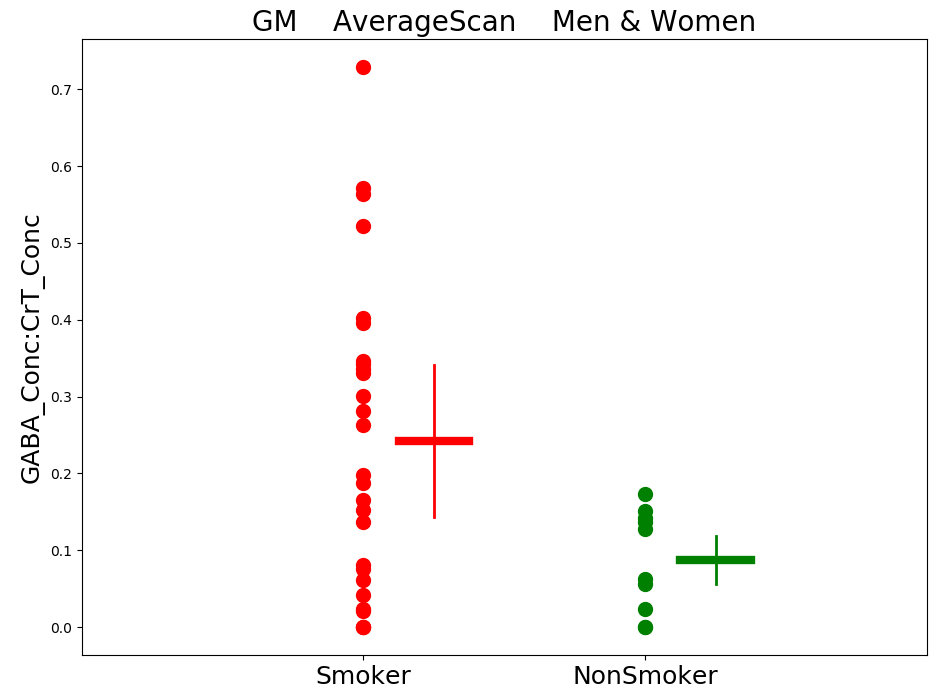
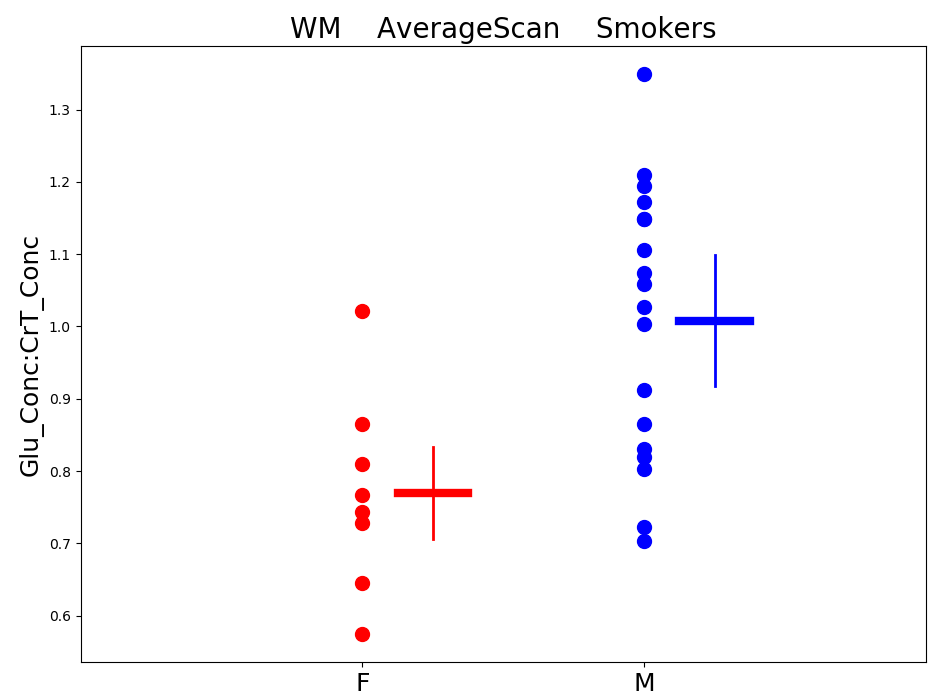
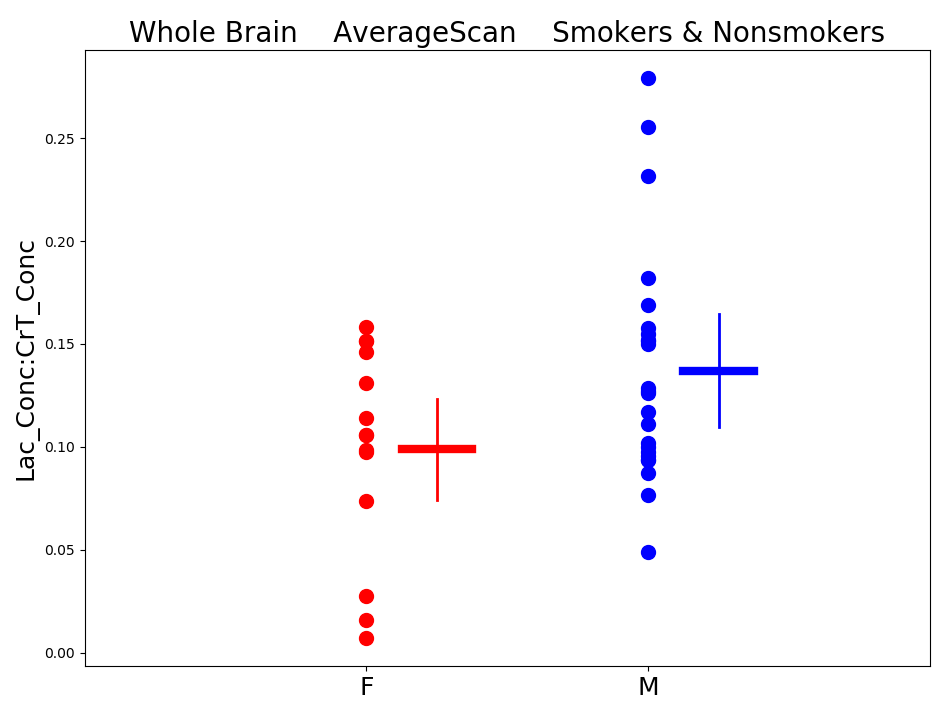
Figures 3-5 present preliminary results. They suggest that: 1) People who smoke have higher GM GABA compared to non-smokers, 2) Women who smoke have lower WM glutamate (Glu) compared to men who smoke and 3) Whole-brain Lac is marginally higher in men than in women (smoker and nonsmoker groups combined).
Conclusions
The proposed analysis method provides results similar to those obtained with pulse sequences designed to detect and quantify whole-brain NAA3, and to EPSI analyses of volumes-of-interest4 but extends applicability to other metabolites. Averaging EPSI voxel spectra over large brain volumes provides a means of assessing low-level hard-to-quantify metabolite differences over large brain volumes between groups of individuals.Acknowledgements
NIH/NIDA (1R03DA052719)References
1. A. Ebel and A. A. Maudsley. Improved spectral quality for 3D spectroscopic imaging using a high spatial resolution acquisition strategy. Magn. Reson. Imag. 21: 113-120 (2003).
2. Maudsley AA, Darkazanli A, Alger JR, et al. Comprehensive processing, display and analysis for in vivo MR spectroscopic imaging. NMR Biomed.19:492-503 (2006).
3. Gonen O, Grossman RI. The accuracy of whole brain N-acetylaspartate quantification. Magn Reson Imaging. 18:1255-8 (2000).
4. Goryawala M, Saraf-Lavi E, Nagornaya N, et al. The Association between Whole-Brain MR Spectroscopy and IDH Mutation Status in Gliomas. J Neuroimaging. 30:58-64 (2020).
Figures