1250
Noise reduction in fractional anisotropy maps using deep learning based denoising1Department of Information Science and Engineering, Dayananda Sagar College of Engineering, Bengaluru, India, 2Department of Medical Electronics, Dayananda Sagar College of Engineering, Bengaluru, India, 3Columbia University in the City of New York, Newyork, NY, NY, United States, 4Department of Electronics and Communications, BMS Institute of Technology and Management, Bangalore, India
Synopsis
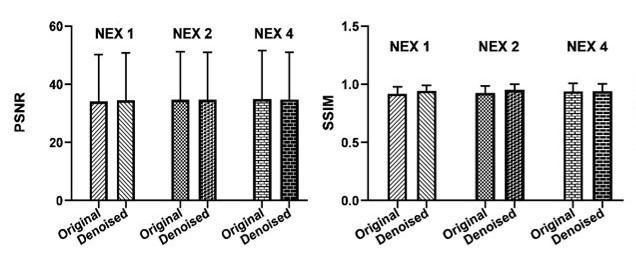
Denoising is an alternative for enhancing signal-to-noise ratio in high b-value diffusion imaging instead of prolonged acquisition time. We experimented a deep learning based denoising method on prospective high b-value DWI and visualized the impact of denoising using fractional anisotropy(FA) maps. Experiment was repeated for three different signal averages:1,2 4-NEX and two different slice thickness 1mm and 5mm with gold standard reference of 10-NEX images. The current work obtained average peak signal-to-noise ratio >34dB and SSIM >0.94 after denoising for FA maps. The PSNR and SSIM values in FA maps were modestly increased after denoising.
Introduction
Diffusion tensor imaging (DTI) allows quantifying diffusion characteristics by scalar and vector contrasts. Fractional anisotropy (FA) is one such scalar measure and it describes the degree of diffusion anisotropy and mean diffusivity (MD). FA maps play an important role in white matter disease diagnosis 1. At high b-values (b-value ≥ 2000s/mm2), DWI is more sensitive to white matter changes and provides better contrast with increased tissue diffusivity 1,2. The current work uses high b-value prospective DWI to generate high SNR FA maps after the application of a deep learning-based denoising (DnCNN) technique.Methods
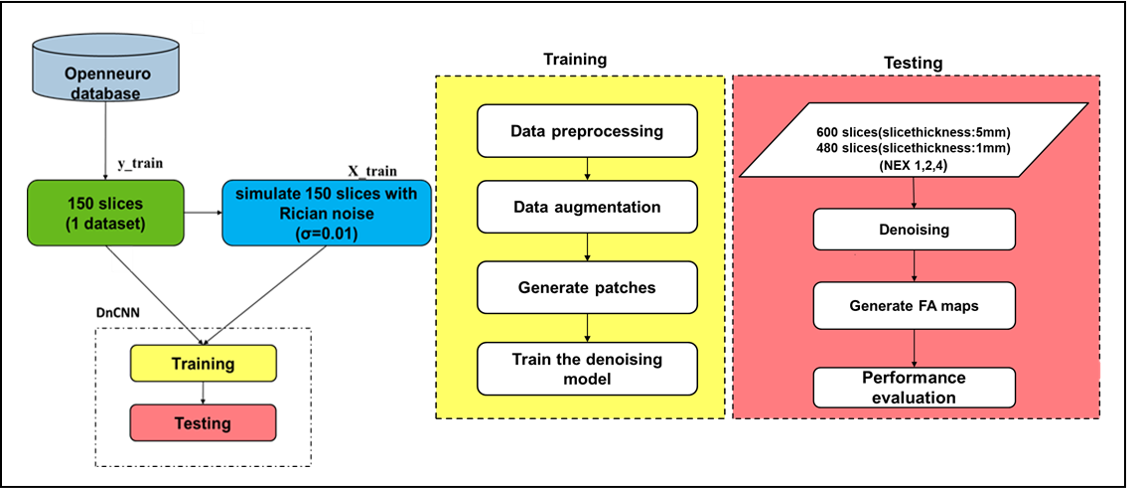
We used high b-value retrospective DW images from the Open neuro public database which includes 34 subjects with b=2000s/mm2, 70 directions, 75 slices, 128×104 matrix size with 2mm isotropic resolution acquired on Siemens Magnetom Skyra 3T scanner 3. We randomly selected one healthy control from the database and cropped 219,000 patches of 40x40 size from 150 slices for training. We created noisy patches by adding Rician noise with a known noise level of σ=0.01. We used the same architecture as in ref 4,5. The initial learning rate of 1×10⁻³ was set for the first 10 epochs and reduced to 1×10⁻⁴ for the rest of the training. An early stopping condition with a patience parameter of 5 epochs and min_delta variable was set to 1×10⁻³ for optimal training. Training performance was verified by loss plots given in ref 4.5.We acquired high b-value prospective DWI from 5 healthy volunteers on Siemens Magnetom Prisma 3T scanner using a 64-channel head coil for testing.20 axial slices of the brain with matrix size: 128×128, FOV 256×256mm2,6 directions, b-value=3000s/mm2, and TR/TE: 7800/82ms were acquired using EPI sequence with flip angle of 90°. We denoised 480 slices of 1mm slice thickness and 600 slices of 5mm slice thickness using DnCNN and used unsharp masking for details preservation5. We used MRIcron tool to generate b-table and further generated FA maps using DSI-studio for each dataset before and after denoising 6,7. We used the default threshold to generate the brain mask for both 1mm and 5mm high b-value DWI. Also, intensity correction was done for 1mm slice thickness images. Difference images were calculated in case of high SNR FA maps obtained using 5mm DWI in order to verify the noise reduction. We computed PSNR and SSIM of FA maps as quantitative measures.
Results and discussion
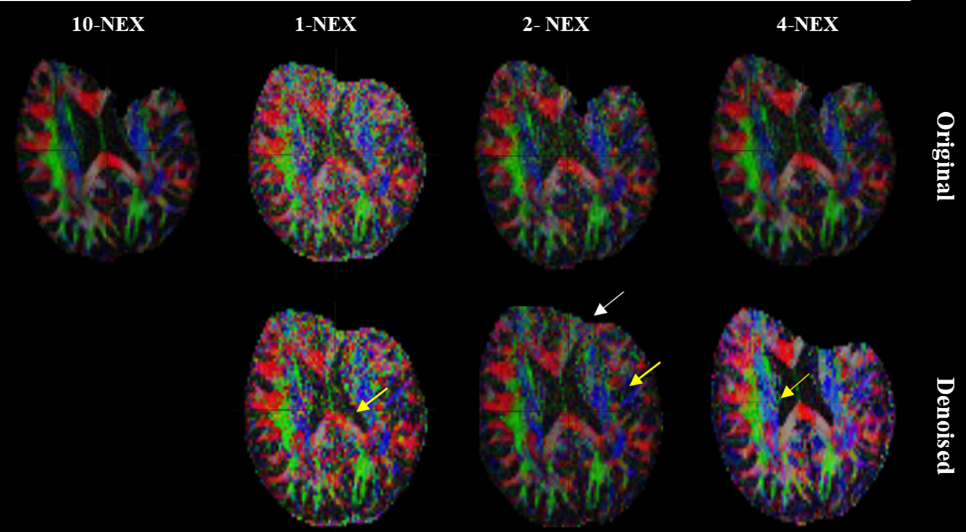
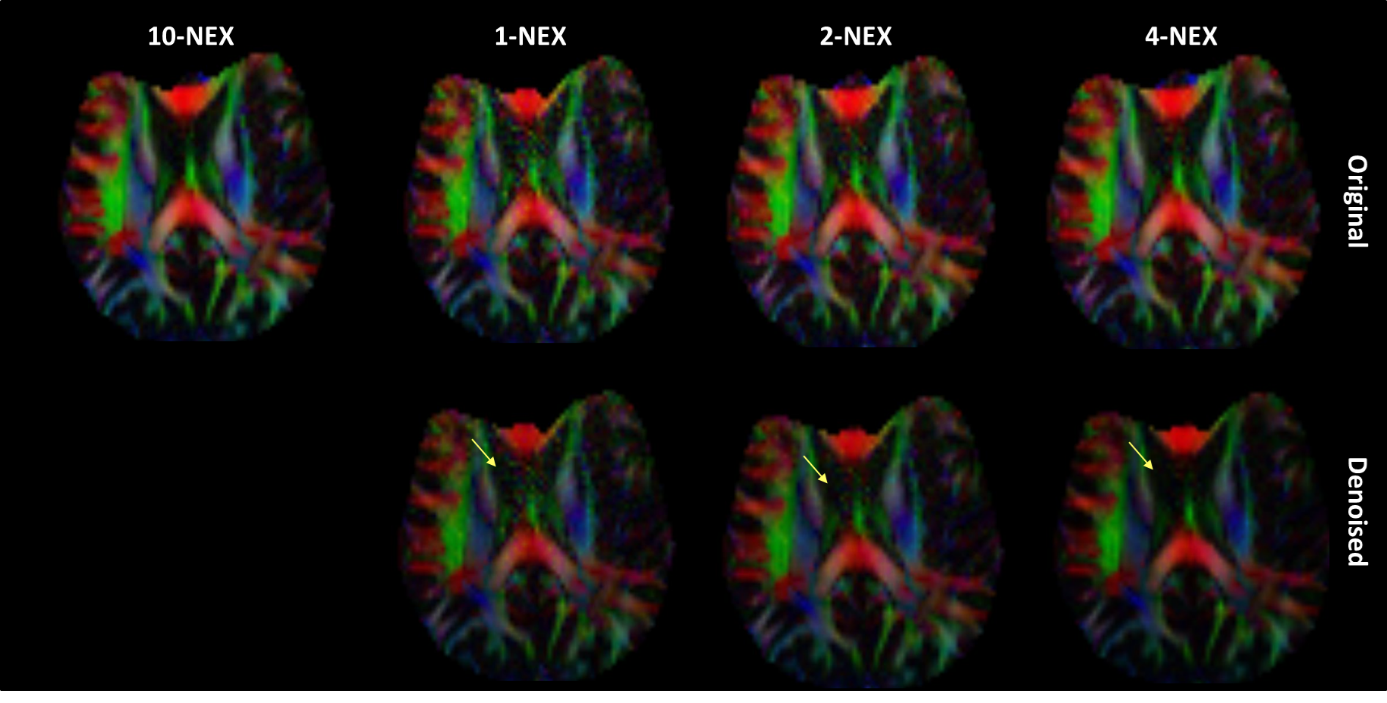
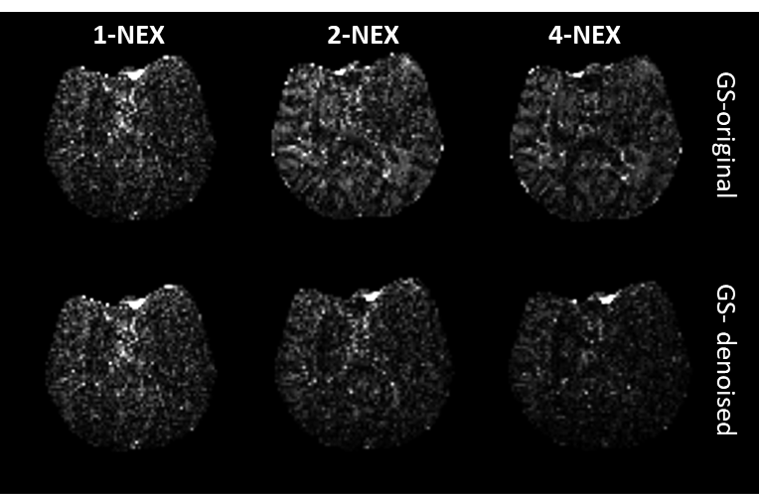
Figure 1 shows flow diagrams of training and testing. Training efficacy was verified as per ref 5. The effect of denoising for 1mm high b-value prospective DWI in FA maps are shown in figure 2. The superior and middle frontal gyrus are distorted due to field inhomogeneity and lower slice thickness in figure 1. Intensity correction methods were used to retain these details after denoising and can be observed in the second row. Figure 3 shows the performance of DnCNN denoising on high b-value DWI with 5mm slice thickness and visualized through FA maps. The application of DnCNN to higher SNR scenarios (with 2 and 4-NEX or increased slice thickness) showed a loss of anatomic details. This smoothening can be attributed to the low-pass filtering effect of the DnCNN model acting on image details rather than noise voxels.Also, difference images of 5mm FA maps shown in figure 4 indicate the modest reduction of noise after denoising. Figure 5 shows the PSNR and SSIM values of FA maps before and after denoising. There is a modest increase in PSNR and SSIM values.Conclusion
The current work demonstrates the denoising effect of high b-value DWI and subsequently on the FA maps. We obtained increased PSNR and SSIM values with FA maps generated from low SNR and lower slice thickness DWI. However, modest changes were observed with high NEX and increased slice thickness after denoising. This limitation can be lessened by developing edge-aware models by including a total-variation loss regularizer. Further, the study requires radiological evaluation to demonstrate clinical use and efficacy.Acknowledgements
I would like to thank Dr.Sairam Geethanath, Associate Research Scientist at Columbia University in the City of New York, for providing insightful suggestions and sparing his valuable time during this work.
References
1.Farrell JA, Landman BA, Jones CK,et.al. Effects of SNR on the accuracy and reproducibility of DTI-derived fractional anisotropy, mean diffusivity, and principal eigenvector measurements at 1.5 T. Journal of magnetic resonance imaging: JMRI. 2007 Sep;26(3):756.
2.Jones, Derek K., and Peter J. Basser. "Squashing peanuts and smashing pumpkins”: how noise distorts diffusion‐weighted MR data." Magnetic Resonance in Medicine, 52, no. 5 (2004): 979-993.
3.Gorgolewski ,OpenNeuro—a free online platform for sharing and analysis of neuroimaging data. Organization for human brain mapping.2017 ;1677 (2).
4.Zhang K, Zuo W, Chen Y, Meng D, Zhang L. Beyond a Gaussian denoiser: residual learning of deep CNN for image denoising. IEEE Trans Image Process 2017; 26:3142–3155.
5.Seema S Bhat,Pavan Poojar, Hanumantharaju M.C., Sairam Geethanath, Deep learning based denoising for high b-value high resolution diffusion weighted imaging, ISMRM 2021.
6.MRIcron,https://www.nitrc.org/projects/mricron
7.DSI studio,http://dsi-studio.labsolver.org/
Figures