1244
Evaluation of quantitative T1 and PD mapping at 7T from an MP2RAGE Sequence optimised to obtain UNI and FLAWS contrast images in a single scan1Biomedical Engineering Department, School of Biomedical Engineering and Imaging Sciences, King's College London, London, United Kingdom, 2London Collaborative Ultra high field System (LoCUS), London, United Kingdom, 3Department of Forensic and Neurodevelopmental Sciences, Institute of Psychiatry, Psychology and Neuroscience, King’s College London, London, United Kingdom, 4Centre for the Developing Brain, School of Biomedical Engineering and Imaging Sciences, King’s College London, London, United Kingdom, 5MR Research Collaborations, Siemens Healthcare Limited, Frimley, United Kingdom, 6Department of Neuroimaging, Institute of Psychiatry, Psychology and Neuroscience, King’s College London, London, United Kingdom, 7Radiology Department, Great Ormond Street Hospital for Children, London, United Kingdom, 8MRC Centre for Neurodevelopmental Disorders, King’s College London, London, United Kingdom
Synopsis
The Magnetization Prepared 2 Rapid Acquisition Gradient Echoes (MP2RAGE) sequence is commonly used for 3D structural T1-weighted imaging of the brain at 7T and can be optimised to obtain UNI and clinically relevant FLuid and White Matter Suppression (FLAWS) images within one acquisition. In this study, such a protocol was used together with newly derived analytical equations accounting for partial Fourier acquisitions, and B1+ maps, in a dedicated fitting algorithm to produce quantitative T1 and arbitrarily scaled PD-maps. These maps were evaluated in children and adults at 7T demonstrating a significant T1 reduction with age.
Introduction
At 7T MP2RAGE1 is commonly used for 3D structural T1-weighted imaging of the brain. It acquires two rapid gradient echoes (INV1 and INV2) collected after a common inversion pulse, which are combined in a ratio to produce an image (UNI) with maximum contrast between white matter (WM), grey matter (GM) and cerebrospinal fluid (CSF). The sequence can also be optimised to obtain UNI and clinically relevant FLuid and White Matter Suppression (FLAWS)2-4 images within one acquisition5. Here, in addition to UNI and FLAWS images, we used analytical equations accounting for partial Fourier acquisitions to produce longitudinal relaxation time (T1) and proton density (PD) maps, having developed an approach to mitigate fitting problems.Methods
The time between two consecutive inversion pulses (MP2RAGE repetition time, MP2RAGETR1) consists of the delay between the inversion pulse and the first GRE block (TA), the delay between two GRE blocks (TB), the delay after the second GRE block until the next inversion pulse (TC), and the two GRE blocks1. Following the approach by Marques et al1, the MP2RAGE steady-state signal for the longitudinal magnetization is derived as$$m_{z,ss}=\frac{M_0\left[\left(\left((1-EA)(cos(α_1)E1)^n+(1-E1)\frac{1-(cos(α_1)E1)^n}{1-cos(α_1)E1}\right)EB+(1-EB)\right)(cos(α_2)E1)^n+(1-E1)\frac{1-(cos(α_2)E1)^n}{1-cos(α_2)E1}\right]EC+(1-EC)M_0}{1+eff(cos(α_1)cos(α_2))^n\hspace{1mm}e^{-MP2RAGETR/T_1}}$$
where EA = exp(-TA/T1), EB = exp(-TB/T1), EC = exp(-TC/T1), and E1 = exp(-TR/T1). TR here is the time between the n small angle excitations in the GRE readouts (TR≠MP2RAGETR). The inversion efficiency eff=1 was assumed. In four subjects, data were also analysed using eff=0.96. Partial Fourier of 6/8 was used in this study in the first phase-encoding (partition) direction, acquired in the innermost k-space loop resulting in a shift in the position of k-space centre within the readout, requiring modified signal equations1:
$$\begin{align}GRE_{TI1}&=M_0\hspace{1mm}B_1^-e^{-TE/T_2^*}sin(α_1)\left[\left(\frac{-eff.m_{z,ss}}{M_0}EA+(1-EA)\right)(cos(α_1)E1)^\frac{n}{3}+(1-E1)\frac{1-(cos(α_1)E1)^\frac{n}{3}}{1-cos(α_1)E1}\right] \\
GRE_{TI2}&=M_0\hspace{1mm}B_1^-e^{-TE/T_2^*}sin(α_2)\left[\frac{\frac{m_{z,ss}}{M_0}-(1-EC)}{EC(cos(α_2)E1)^\frac{2n}{3}}-(1-E1)\frac{(cos(α_2)E1)^\frac{-2n}{3}-1}{1-cos(α_2)E1}\right]\end{align}$$
To fit T1 and M0 (PD), the equations above were combined as a cost function T1=argmin|GRETI1/k1–GRETI2/k2| where k1 and k2 represent the right-hand side of the equations excluding M0. T1 values were initially calculated using lsqnonlin and vpasolve functions of MATLAB R2018a (www.mathworks.com). To mitigate fitting problems within some WM regions (due to the suppressed WM INV1 signal and the discontinuity of the cost function as k1 approaches zero), an algorithm was developed. It can be summarized as: 1) a brute-force search for T1s between 100ms and 10000ms with steps of 1ms followed by a finer search with 0.001ms steps around T1 minimizing the cost function, 2) if step 1 returns T1=100ms because the real minimum is missed and a) abs(INV1)>0.02 where 0.02 is an empirical value, find the maximum slope of the function and make a search around this area b) abs(INV1)≤0.02, by fitting a line to the T1s calculated using the range (INV1-1):0.01:(INV1+1), determine the value of T1 for INV1 signal with ~0 amplitude, 3) If steps 1-2 fail (large residual), repeat 1-2 for T1s of 100ms to 30000ms.
To unambiguously determine the polarity of the magnetization at TI1 due to T1 recovery, phase information was used as below:
$$INV1_{corrected}=real\{\hspace{1mm}INV1_{magnitude}e^{i(\,INV1_{phase}-INV2_{phase})\,}\}$$
The receive field bias (B1-) was calculated using SPM126. A smoothed flip angle (B1+) map7-9 was used to define actual flip angles achieved.
7 healthy children and 10 adults were scanned with consent using a 7T MRI scanner (MAGNETOM Terra, Siemens Healthcare, Erlangen, Germany) either with a 1TX/32-channel RX or an 8TX/32-channel RX coil used in CP mode (both Nova Medical). Scan parameters are summarized in Table 1. In each case the T1 maps provided by the scanner were compared to T1 fitting results. Data acquired across age groups at the same MP2RAGETR (protocols summarized in Table 1b) were compared by segmenting the 3D T1 maps using SPM126 and calculating the means and standard deviations.
Results
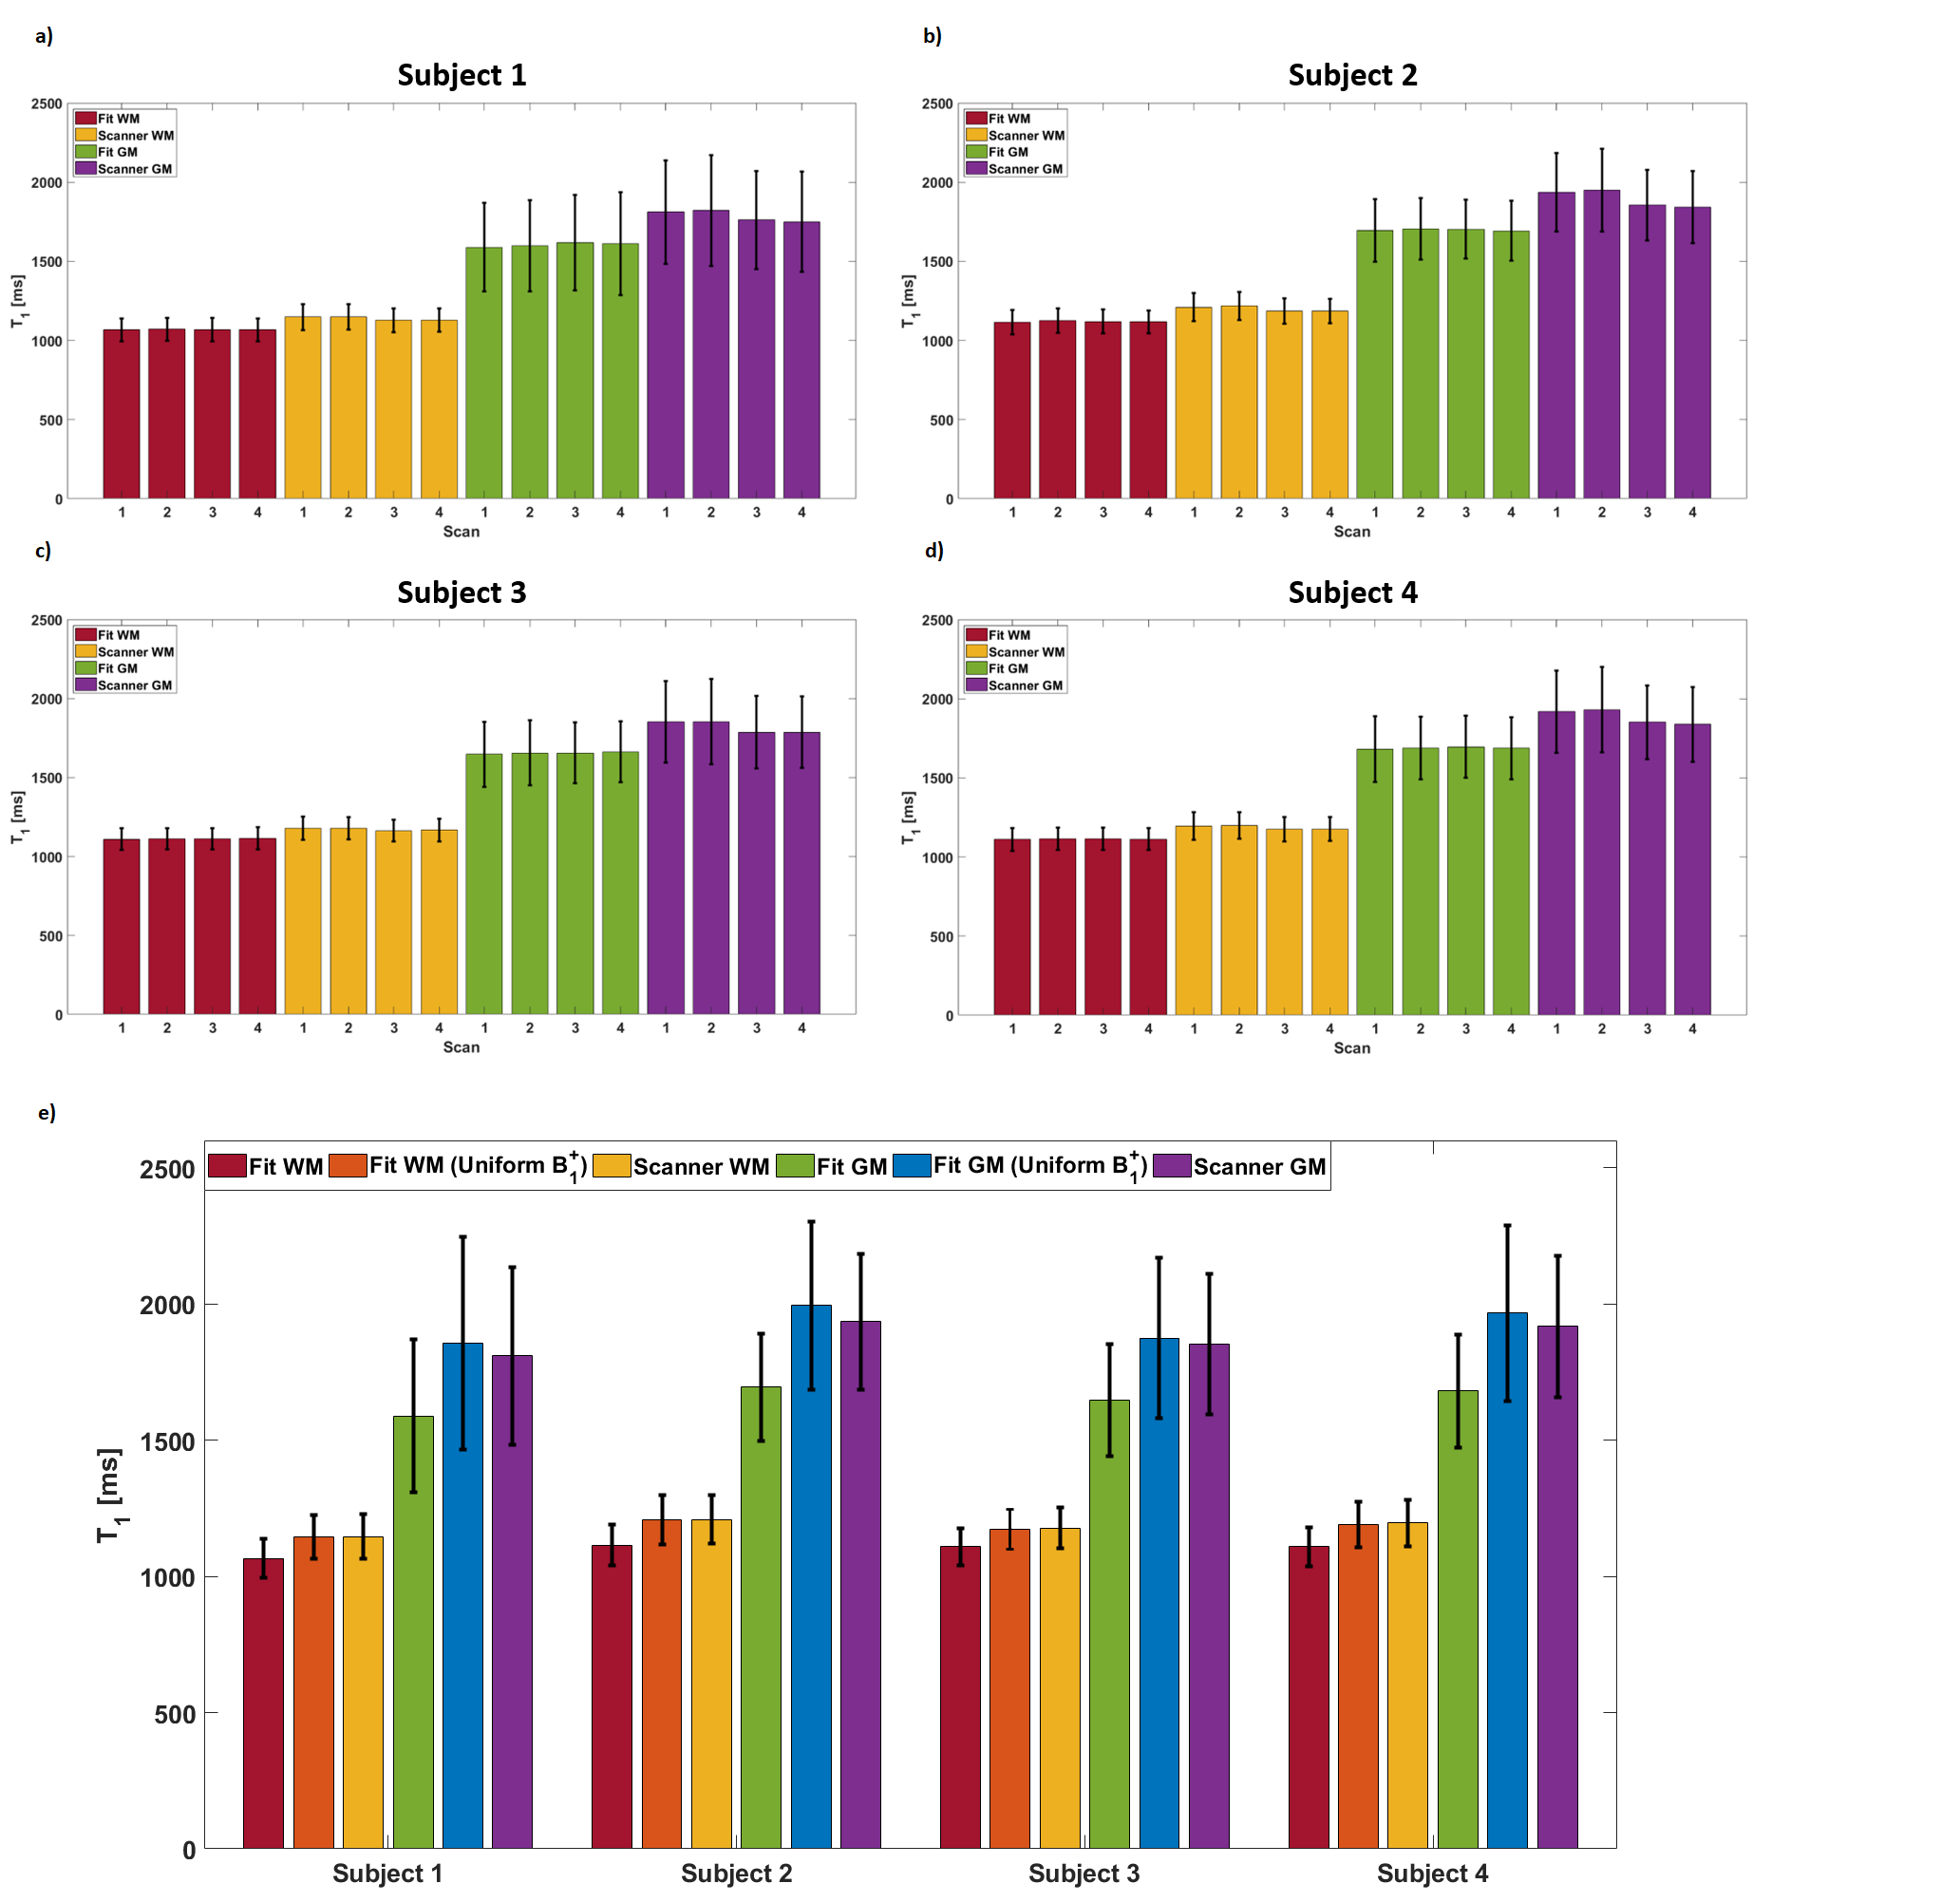
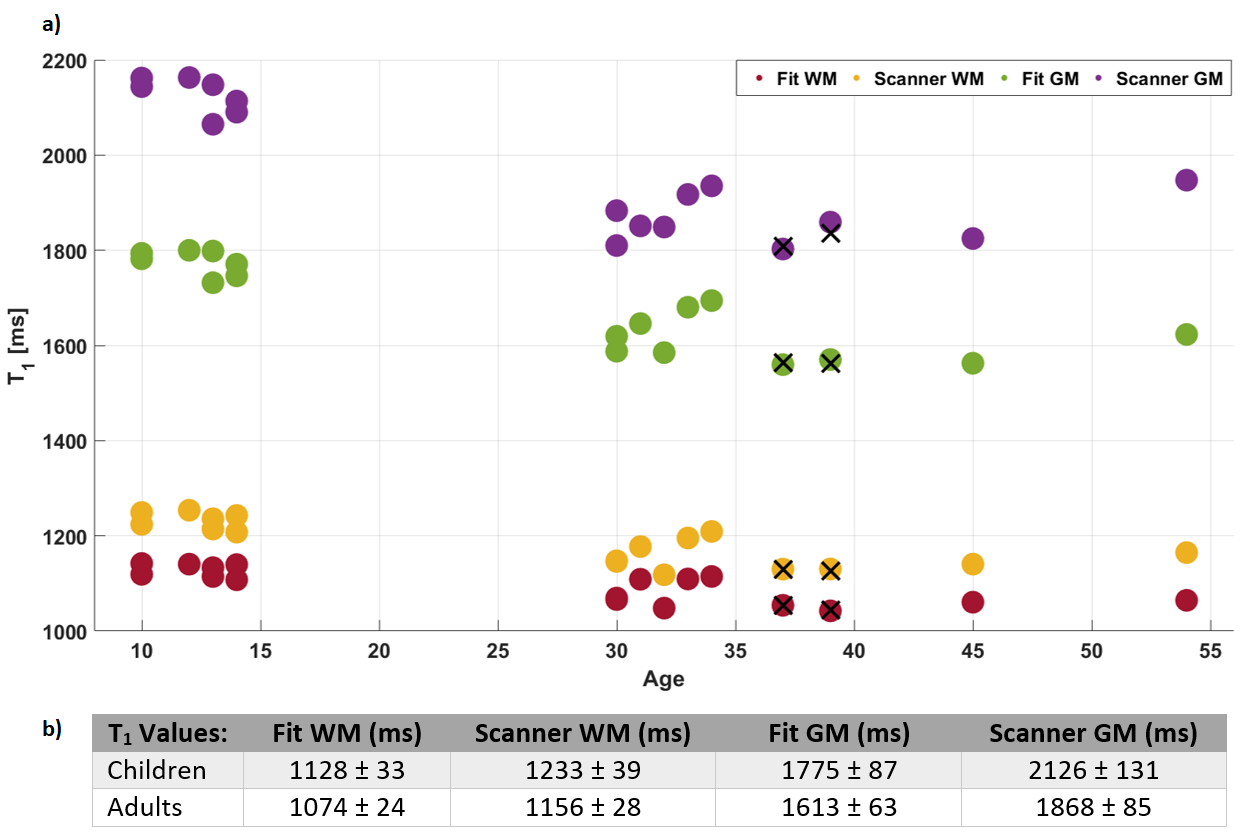
Fig.1 shows T1 maps from different fitting procedures used demonstrating low frequency spatial differences between scanner T1 maps that do not account for variable B1+. Further, distributed WM voxels have an improved fit with our optimised algorithm. Fig.2 demonstrates representative images and maps from a child from the single acquisition. T1 results acquired at different MP2RAGETRs demonstrated highly consistent T1 values within tissue class (Fig.3). Fitting results without B1+ correction (as for scanner T1 maps) at an MP2RAGETR of 4000ms are also included (Fig.3e). In Fig.4, the T1 results from all subjects are plotted. Using eff=0.96, WM and GM T1 values were ~4% and ~6% larger compared to those using eff=1, respectively (data from 4 adults). Adult T1 values were more consistent and significantly lower than children T1s (Mann-Whitney U-test, p<0.01) despite variability in the protocol and RF coil used.Discussion and Conclusion
Quantitative T1 maps and PD-weighted images were produced from a single MP2RAGE acquisition designed to obtain UNI and FLAWS images simultaneously5. An analytical solution of the MP2RAGE signal equations was used together with B1+ maps and a dedicated algorithm to derive both T1 and unscaled PD maps. Despite the small sample size, expected WM and GM T1 decreases with age were found11,12. Scanner T1 map accuracy is reduced by not corrected B1+ variability13,14. In conclusion, using an MP2RAGE sequence and a dedicated fitting algorithm, it was possible to produce T1 and PD maps alongside UNI and FLAWS-images within a clinically feasible single acquisition in both children and adults at 7T.Acknowledgements
The authors would like to acknowledge David Leitao for valuable discussions.
This work was supported by GOSHCC Sparks Grant V4419, King's Health Partners, Wellcome Trust Collaboration in Science grant [WT201526/Z/16/Z], and by core funding from the Wellcome/EPSRC Centre for Medical Engineering [WT203148/Z/16/Z].
References
1) Marques JP, Kober T, Krueger G, van der Zwaag W, Van de Moortele PF, Gruetter R. MP2RAGE, a self bias-field corrected sequence for improved segmentation and T1-mapping at high field. Neuroimage. 2010;49:1271-1281.
2) Tanner M, Gambarota G, Kober T, et al. Fluid and white matter suppression with the MP2RAGE sequence. J Magn Reson Imaging. 2012;35:1063-1070.
3) Beaumont J, Gambarota G, Saint-Jalmes H, et al. High-resolution multi-T1-weighted contrast and T1 mapping with low B1+ sensitivity using the fluid and white matter suppression (FLAWS) sequence at 7T. Magn Reson Med. 2020;00:1–15. https://doi.org/10.1002/mrm.28517
4) Chen X, Quan T, Kober T, et al. Gray-matter-specific MR imaging improves detection of epileptogenic zones in focal cortical dysplasia: A new sequence called fluid and white matter suppression (FLAWS). Neuroimage: Clinical. 2018;20:388-397.
5) Dokumaci AS, Aitken FR, Sedlacik J, et al. Simultaneous optimisation of MP2RAGE UNI and FLAWS brain images at 7T using Extended Phase Graph (EPG) Simulations. In: Proc. Intl. Soc. Mag. Reson. Med. 29 (2021) 445.
6) Friston KJ, Ashburner J, Kiebel SJ, Nichols TE, Penny WD, editors. Statistical Parametric Mapping: The Analysis of Functional Brain Images. Academic Press, 2007.
7) Chung S, Kim D, Breton E, Axel L. Rapid B1+ Mapping Using a Preconditioning RF Pulse with TurboFLASH Readout. Magn Reson Med. 2010;64:439-446.
8) Fautz HP, Vogel M, Gross P, Kerr A, Zhu Y. B1 mapping of coil arrays for parallel transmission. In: Proc. Intl. Soc. Mag. Reson. Med. 16 (2008) 1247.
9) Tabelow K, Balteau E, Ashburner J, et al. hMRI – A toolbox for quantitative MRI in neuroscience and clinical research. Neuroimage. 2019;194:191-210.
10) Griswold MA, Jakob PM, Heidemann RM, et al. Generalized Autocalibrating Partially Parallel Acquisitions (GRAPPA). Magn Reson Med. 2002;47(6):1202-1210.
11) Cho S, Jones D, Reddick DE, Ogg RJ, Steen RG. Establishing norms for age-related changes in proton T1 of human brain tissue in vivo. Magn Reson Imaging. 1997;15(10):1133-1143.
12) Gracien R, Nuernberger L, Hok P, et al. Evaluation of brain ageing: a quantitative longitudinal MRI study over 7 years. Eur Radiol. 2017;27:1568-1576.
13) Marques, JP, Gruetter, R. New Developments and Applications of the MP2RAGE Sequence - Focusing the Contrast and High Spatial Resolution R1 Mapping. PloS one, 2013;8(7):e69294.
14) Haast, RAM, Ivanov, D, Uludağ, K. The impact of B1+ correction on MP2RAGE cortical T1 and apparent cortical thickness at 7T. Hum Brain Mapp. 2018;39(6):2412–2425.
Figures
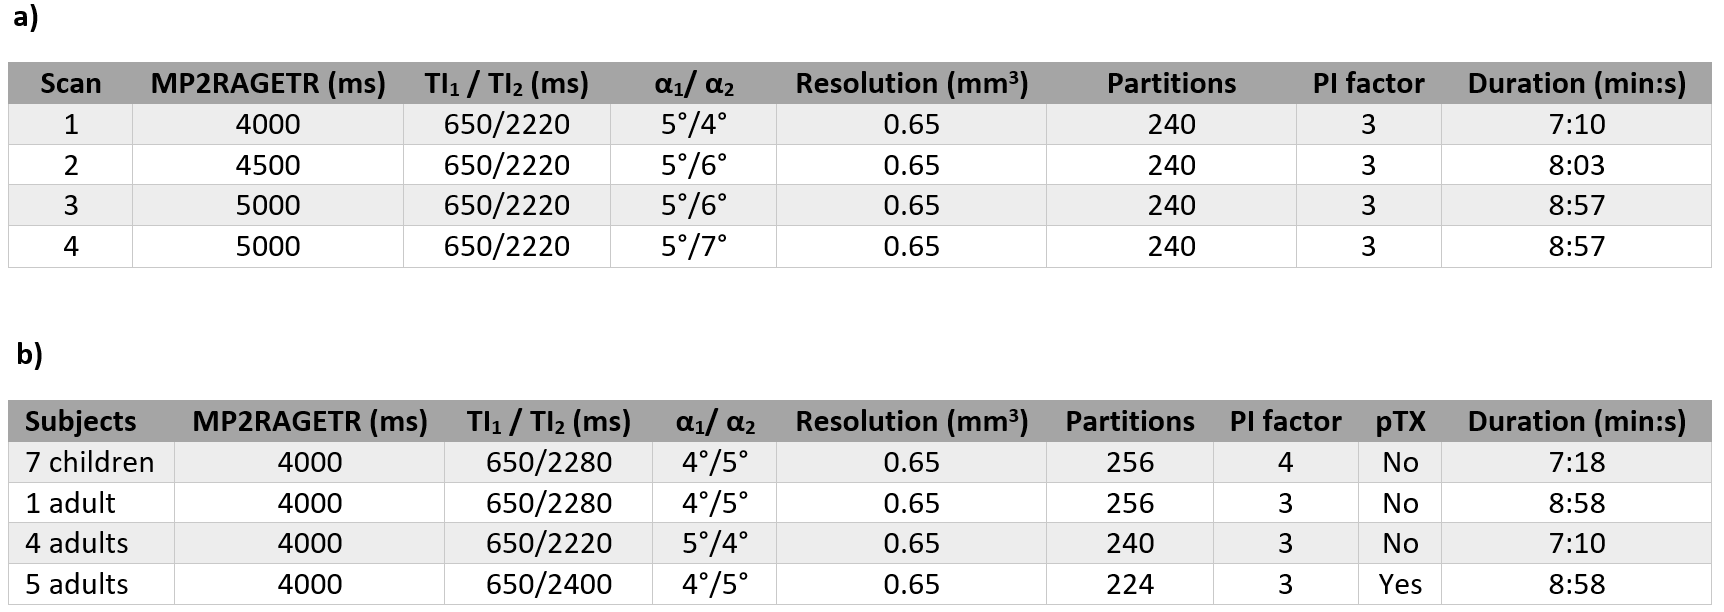
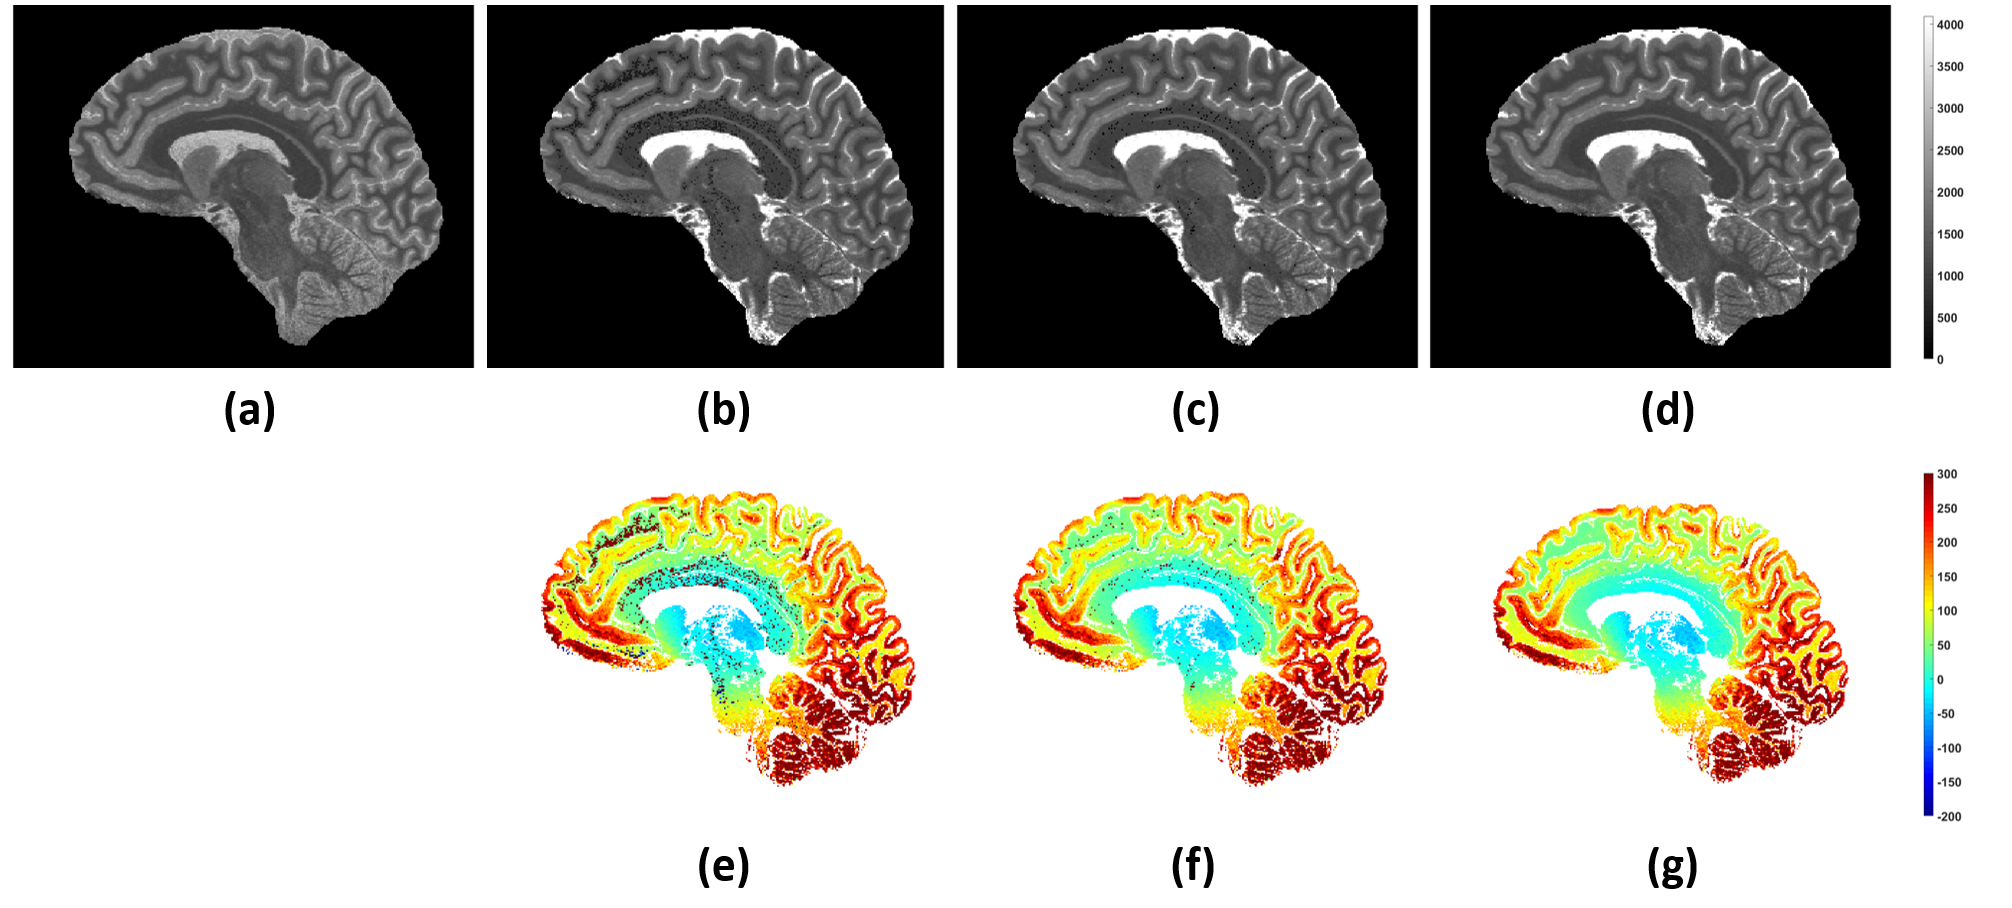
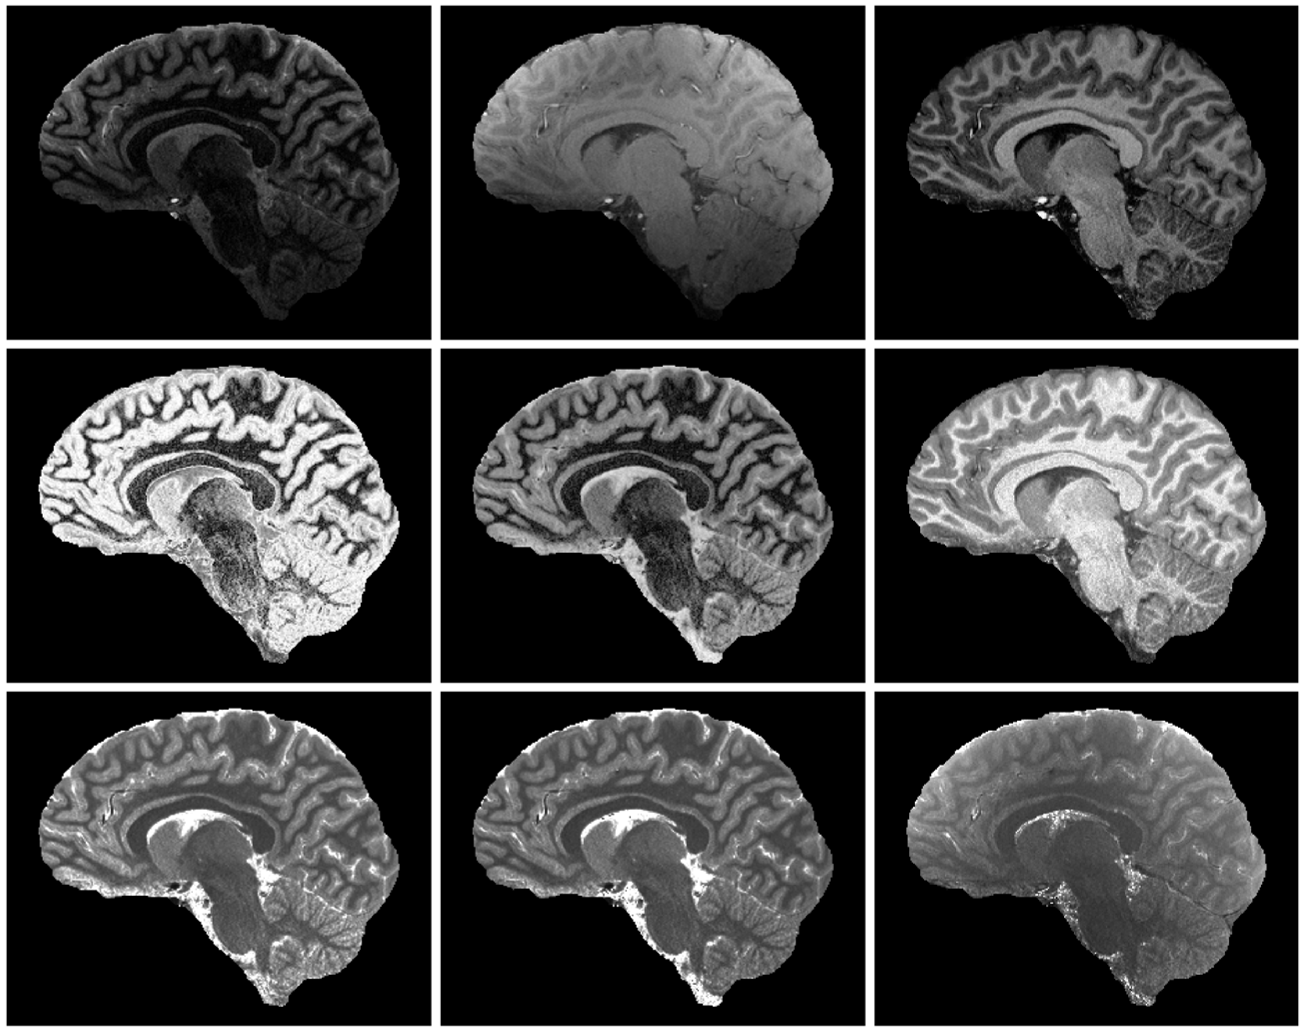
Figure 2. Representative images and parameter maps obtained from a 12-year-old healthy subject. Top row (left to right): INV1, INV2, UNI images. Middle row (left to right): FLAWSmin, FLAWShc, FLAWShco images2,3. FLAWSmin is calculated using the minIP of INV1 and INV2. FLAWShc and FLAWShco are calculated using the differences of INV1 and INV22,3. Bottom row (left to right): Scanner T1 map, T1 fit, PD fit. The scanner T1 map and the T1 fit are displayed in the same range (0 to 4095ms).