1236
Neonatal seizures induce significant changes in cerebral oxidative metabolism
Agnieszka Sierhej1, Alan Bainbridge2, Giles Kendall3, Magdalena Sokolska2, Kelly Pegoretti-Baruteau3, Janet Rennie3, Sean R Mathieson4, Nicola J Robertson5, Geraldine Boylan4, and Subhabrata Mitra5
1University College London, London, United Kingdom, 2Medical Physics and Bioengineering, University College London Hospitals, London, United Kingdom, 3Neonatal Unit, University College London Hospitals, London, United Kingdom, 4INFANT Research Centre, University College Cork, Cork, Ireland, 5Institute for Women's Health, University College London, London, United Kingdom
1University College London, London, United Kingdom, 2Medical Physics and Bioengineering, University College London Hospitals, London, United Kingdom, 3Neonatal Unit, University College London Hospitals, London, United Kingdom, 4INFANT Research Centre, University College Cork, Cork, Ireland, 5Institute for Women's Health, University College London, London, United Kingdom
Synopsis
Neonatal seizures are common following neonatal encephalopathy and have the potential for themselves to cause further brain injury. Data were collected from 55 term neonates who underwent therapeutic hypothermia following neonatal encephalopathy. 25 developed seizures. Magnetic resonance Spectroscopy showed that in the seizure group, lactate was increased and Naa and Choline were decreased. Lower tNaa in neonates with seizures likely indicates further neuronal injury and may explain seizure induced neurological deficits
Background and Purpose
Neonatal seizures are common following neonatal encephalopathy (NE). Seizures have the potential for themselves to cause further brain injury. Proton magnetic resonance spectroscopy (MRS) allows a non-invasive assessment of cerebral metabolism and has become an important tool for assessment of injury and prognostication following NE. The analysis of MRS data is often achieved by ratioing the metabolite of interest either to water or to another metabolite in the spectrum. This method of analysis can be applied to singly acquired spectra – but accurate quantification of individual metabolites usually requires additional information to be collected. Where a metabolite ratio demonstrates a difference between subject cohorts, it can be more difficult to elucidate to what extent each metabolite in the ratio is contributing to the observed difference. Recently a new method of quantifying individual metabolites was presented1 that uses a combined metabolite reference and we have applied this method to our data. The purpose of this study is to identify - a) the impact of neonatal seizures on brain metabolism following NE and, b) the differences in individual metabolites between cohorts of neonates with and without evidence of seizure activity.Materials and Methodology
This study was approved by the local Research Ethics Committee and written informed consent was obtained before each study. Data were collected from 55 term neonates (corrected gestational age of 36-44 weeks) (29 male) who underwent therapeutic hypothermia following NE and were scanned in a 3T scanner (Philips Achieva) within the first 2 weeks of life. All infants were continuously monitored during the first 4 days of life with video-EEG. Conventional MR imaging was obtained along with MRS using single voxel positioned in the thalamus-basal ganglia region (PRESS, TR = 2288ms, TE = 288ms). MRS data were analysed using Tarquin. The basis set for the analysis included threonine (Thr) to improve the fit in the region around 1.3ppm2. The sum of Lactate and threonine is then analysed rather than the fitted lactate alone. Metabolite ratios were calculated from the fitted data. The data were further analysed using a combined reference method of Larsen et al1. Briefly, the standard deviation of the metabolite signals from the entire cohort are calculated and used to produce weightings that are inversely proportional to the standard deviation of each metabolite within the cohort. For this analysis, the metabolite signal amplitude distributions were tested for normality using a Shapiro-Wilk test and only those metabolites that were normally distributed were considered for inclusion in the combined reference. For each individual spectrum analysis, the combined reference is then the weighted sum of the fitted values of the included metabolites in that spectrum. Results are presented as the individual metabolite of interest ratioed to Cref. Metabolite ratios including lactate in cohorts of neonates with neonatal ecephaliopathy are often not normally distributed. Therefore for statistical comparisons using parametric tests the logarithms of the metabolite ratios are first calculated. Comparisons between the cohorts were unadjusted for severity of encephalopathy and made using t-tests with a Bonferroni correction of the p-value to account for multiple comparisons.Results
25 (45%) neonates developed seizures. Total seizure burden in the seizure cohort ranged from 1.92 mins to 614.95 mins (mean=162.91 mins; SD=147.48 mins). The metabolites included in Cref were Aspartate, Creatine(Cr), total Choline (tCho), total Naa (tNaa), Taurine and Glutamate+glutamine(Glx). Table 1 shows the mean+SD for the metabolite ratios and individual metabolite ratioed to the combined reference. Lac+Thr/tNaa, Lac+Thr/tCho and Lac+Thr/Cr were all significantly higher and tNaa/Cr was significantly lower in the group with seizures (figure 1). Ratioed to the combined reference, (Lac+Thr) was higher and tNaa, tCho and Cr were lower in the group with seizures (figure 2).Discussion and Conclusions
Neonatal seizures induce significant changes in cerebral energy metabolism. The combined reference method allows us to better elucidate the relationship of individual metabolites to the presence of seizures. Our study supports a previous finding3 of increased Lac+Thr/Cho ratio in neonates with seizures and identify changes in individual metabolites. Changes are driven both by increased (Lac+Thr) (increased anaerobic state) and reduced tCho in neonates with seizures (deranged phospholipid metabolism). Lower tNaa in neonates with seizures likely to indicate further neuronal injury and may explain seizure induced neurological deficits.Acknowledgements
No acknowledgement found.References
1. Larsen et al. NMR Biomed. 2021 Jul;34(7):e4520
2. Mitra et al. Arch Dis Child Fetal Neonatal Ed. 2019 Jul;104(4):F424-F432.
3. Miller et al. Neurology 2002 Feb 26;58(4):542-8
Figures
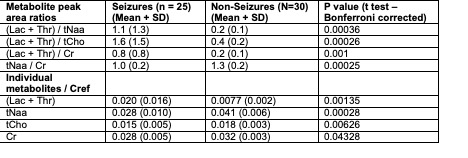
Table 1: Metabolite peak area ratios
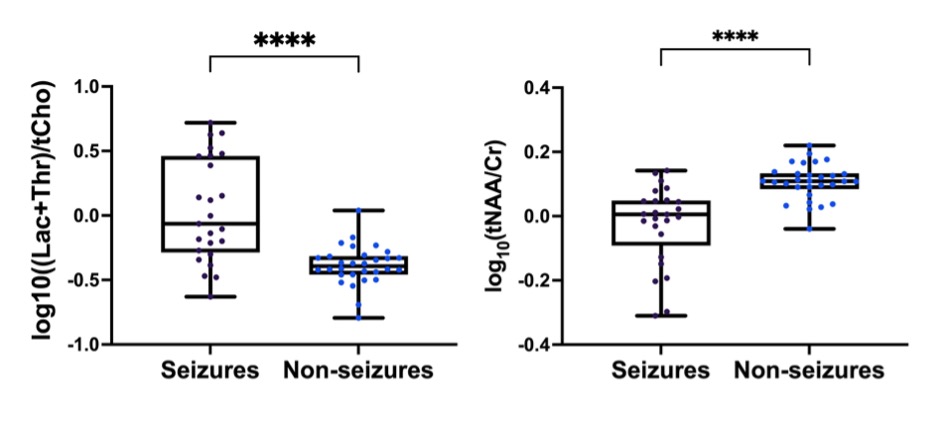
Figure1: Metabolite ratio box plots: Comparison between seizure and non-seizure groups
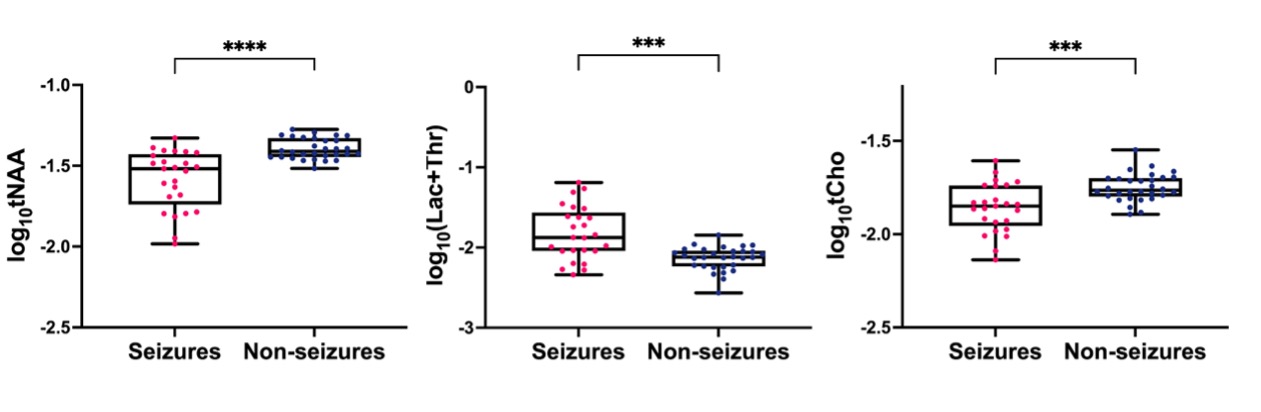
Figure 2: Metabolites ratioed to Cref - Box plots: Comparison between seizure and non-seizure groups
DOI: https://doi.org/10.58530/2022/1236