1234
Individualised assessment of regional brain volumes in neonates with Down syndrome reveals extreme deviation in white matter and cerebellum.1Centre for the Developing Brain, School of Biomedical Engineering and Imaging Sciences, King's College London, London, United Kingdom, 2MRC Centre for Neurodevelopmental Disorders, King's College London, London, United Kingdom, 3Department of Forensic and Neurodevelopmental Science, Sackler Institute for Translational Neurodevelopment, Institute of Psychiatry, Psychology and Neuroscience, King's College London, London, United Kingdom, 4Centre for Brain and Cognitive Development, Birkbeck, University of London, London, United Kingdom, 5Biomedical Engineering Department, School of Biomedical Engineering and Imaging Sciences, King's College London, London, United Kingdom
Synopsis
There are relatively few early neuroimaging studies of Down syndrome (DS), despite being the most common genetic cause of intellectual disability, with characteristics present from birth. The aim of this study was to conduct a group-level analysis of volumetric differences across multiple brain regions in neonates with DS (n = 20) using individual z-scores extracted from robust normative modelling of typically developing neonatal controls (TDC; n = 493). In addition to well-documented cerebellar hypoplasia, here we have identified that neonates with DS have markedly reduced volumes in the cingulate, frontal, insular and occipital WM segments compared to TDC.
Introduction
Trisomy 21 (T21), also known as Down syndrome (DS), is caused by the partial or complete triplication of Homo sapiens chromosome 21 (Hsa21), and is the most common genetic cause of intellectual disability with an incidence of approximately 1 in 1000 births worldwide1,2. Intellectual disability in DS is highly variable and is associated with cognitive impairments in motor, memory, speech and language functions3,4. The aim of this study was to conduct a group-level analysis of volumetric differences across multiple brain regions in neonates with DS using individual z-scores extracted from robust normative modelling of typically developing neonatal controls (TDC).Methods
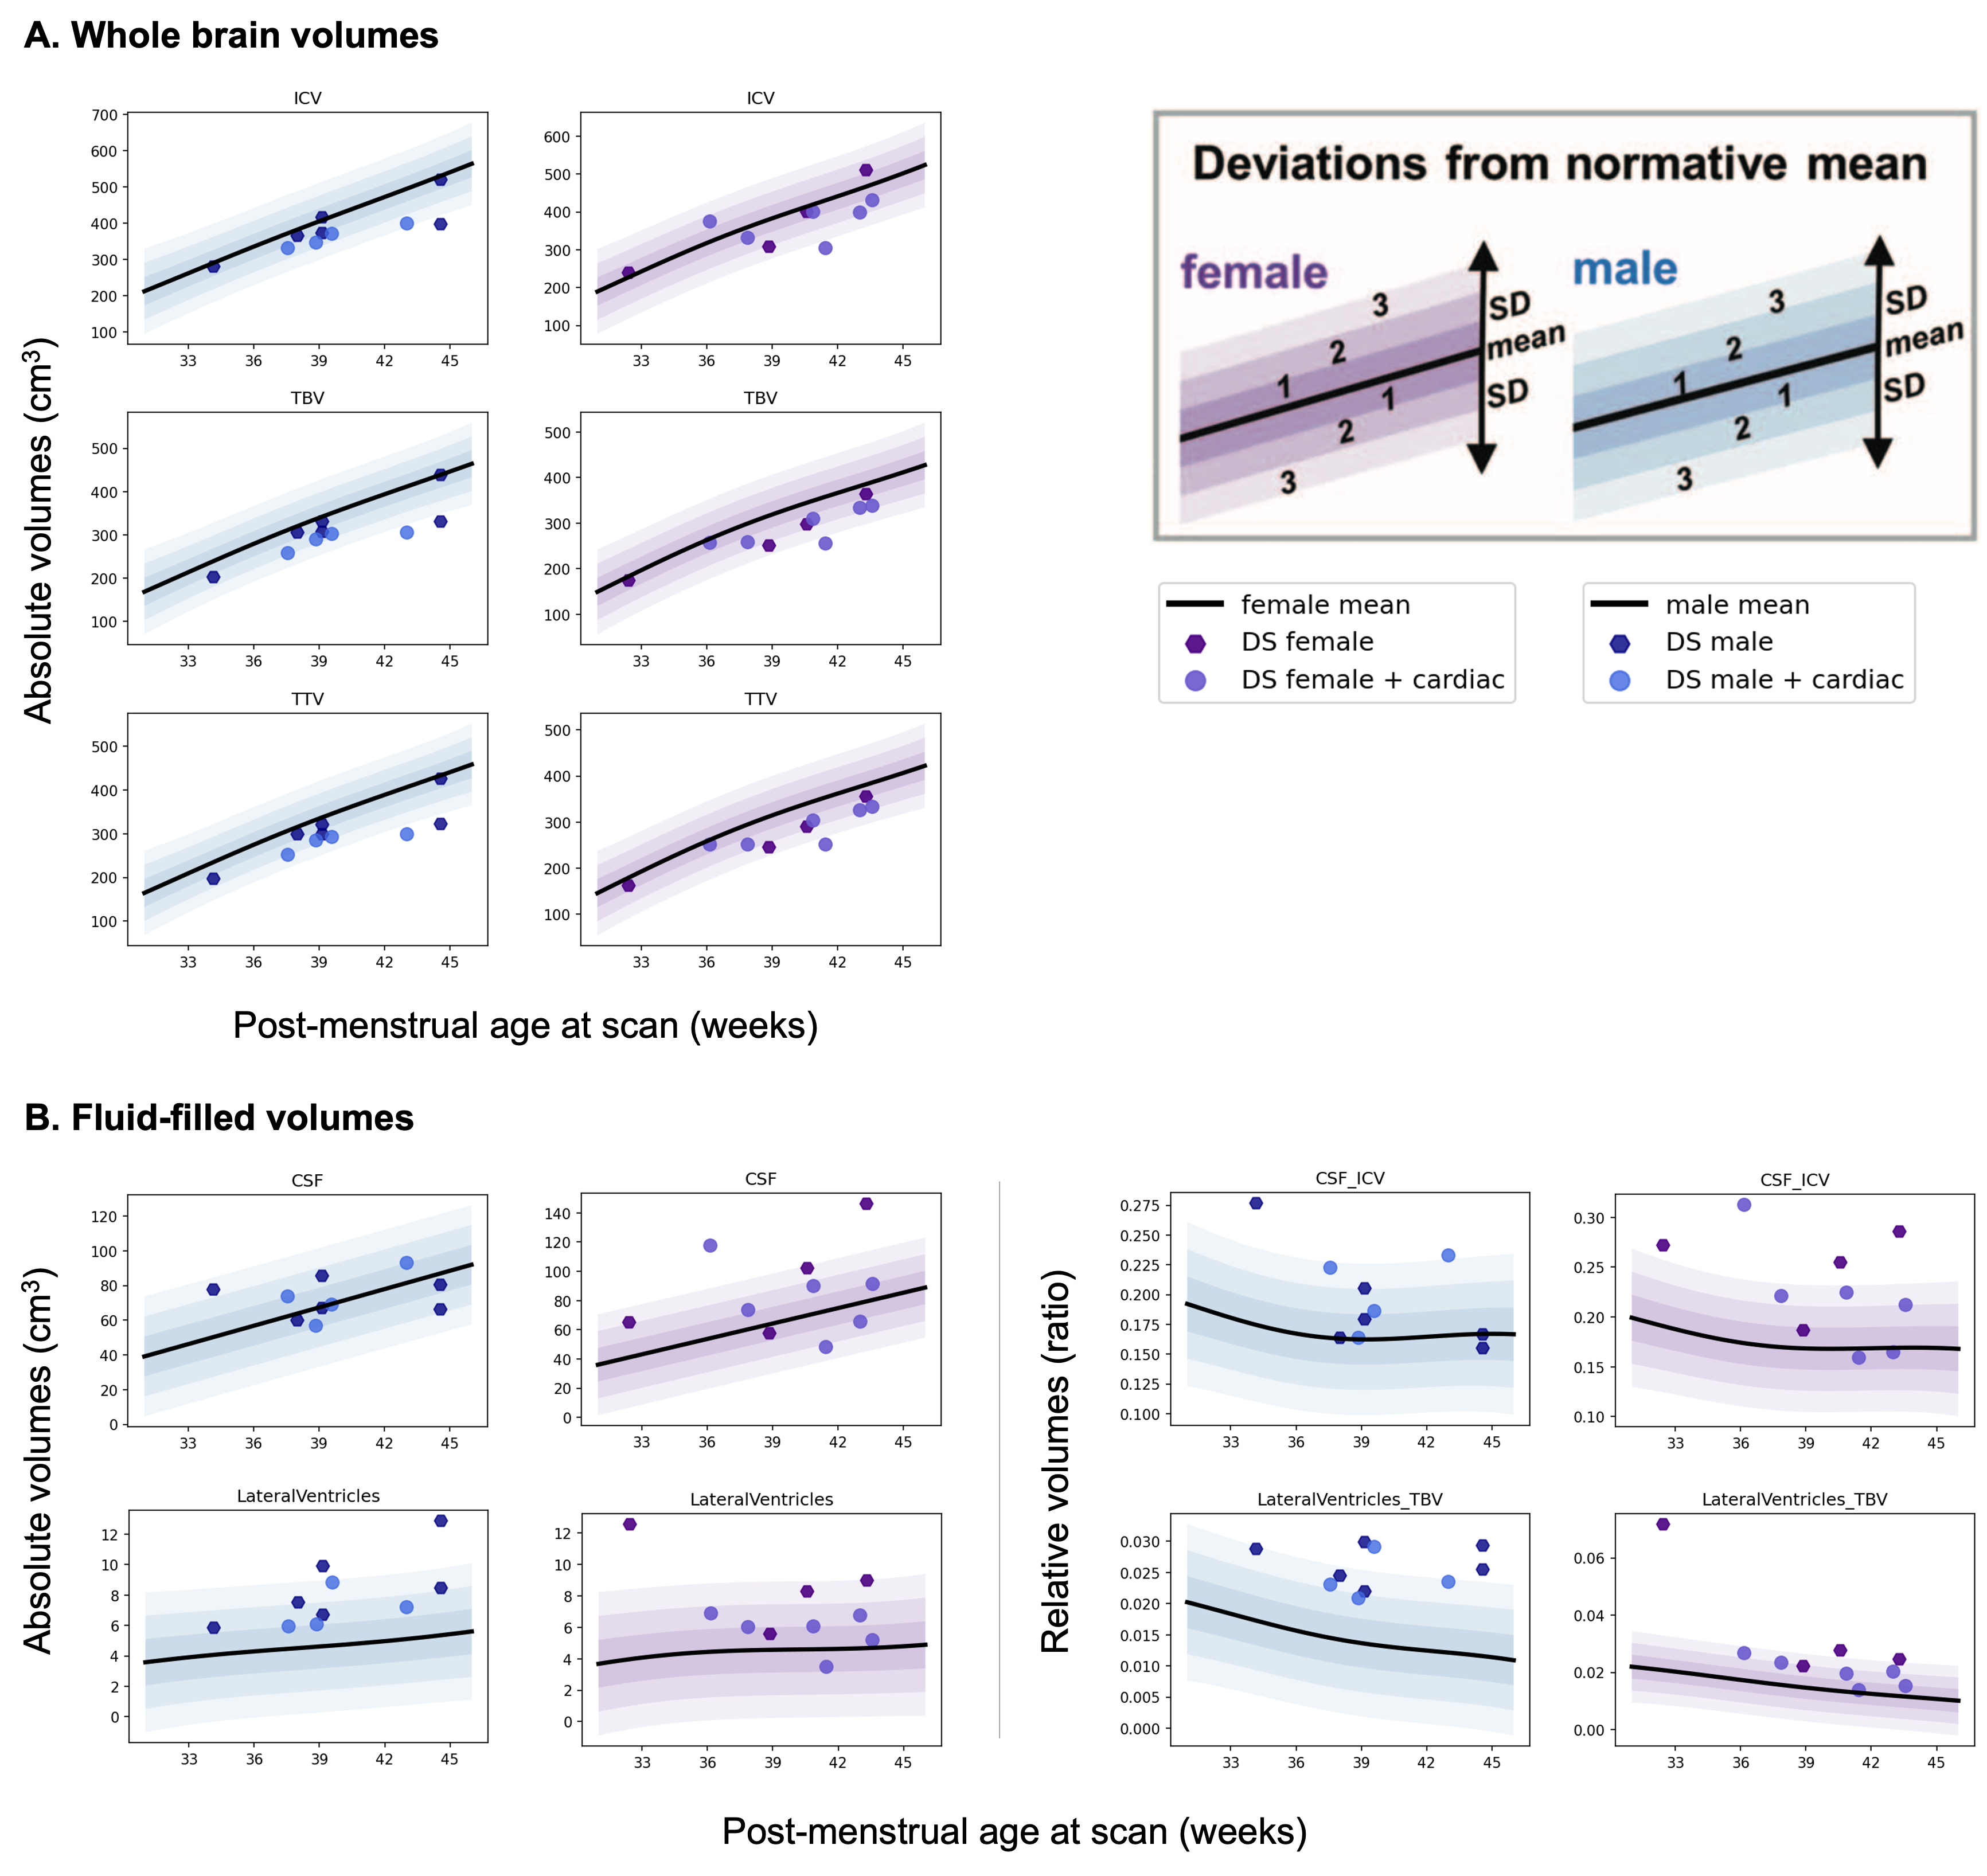
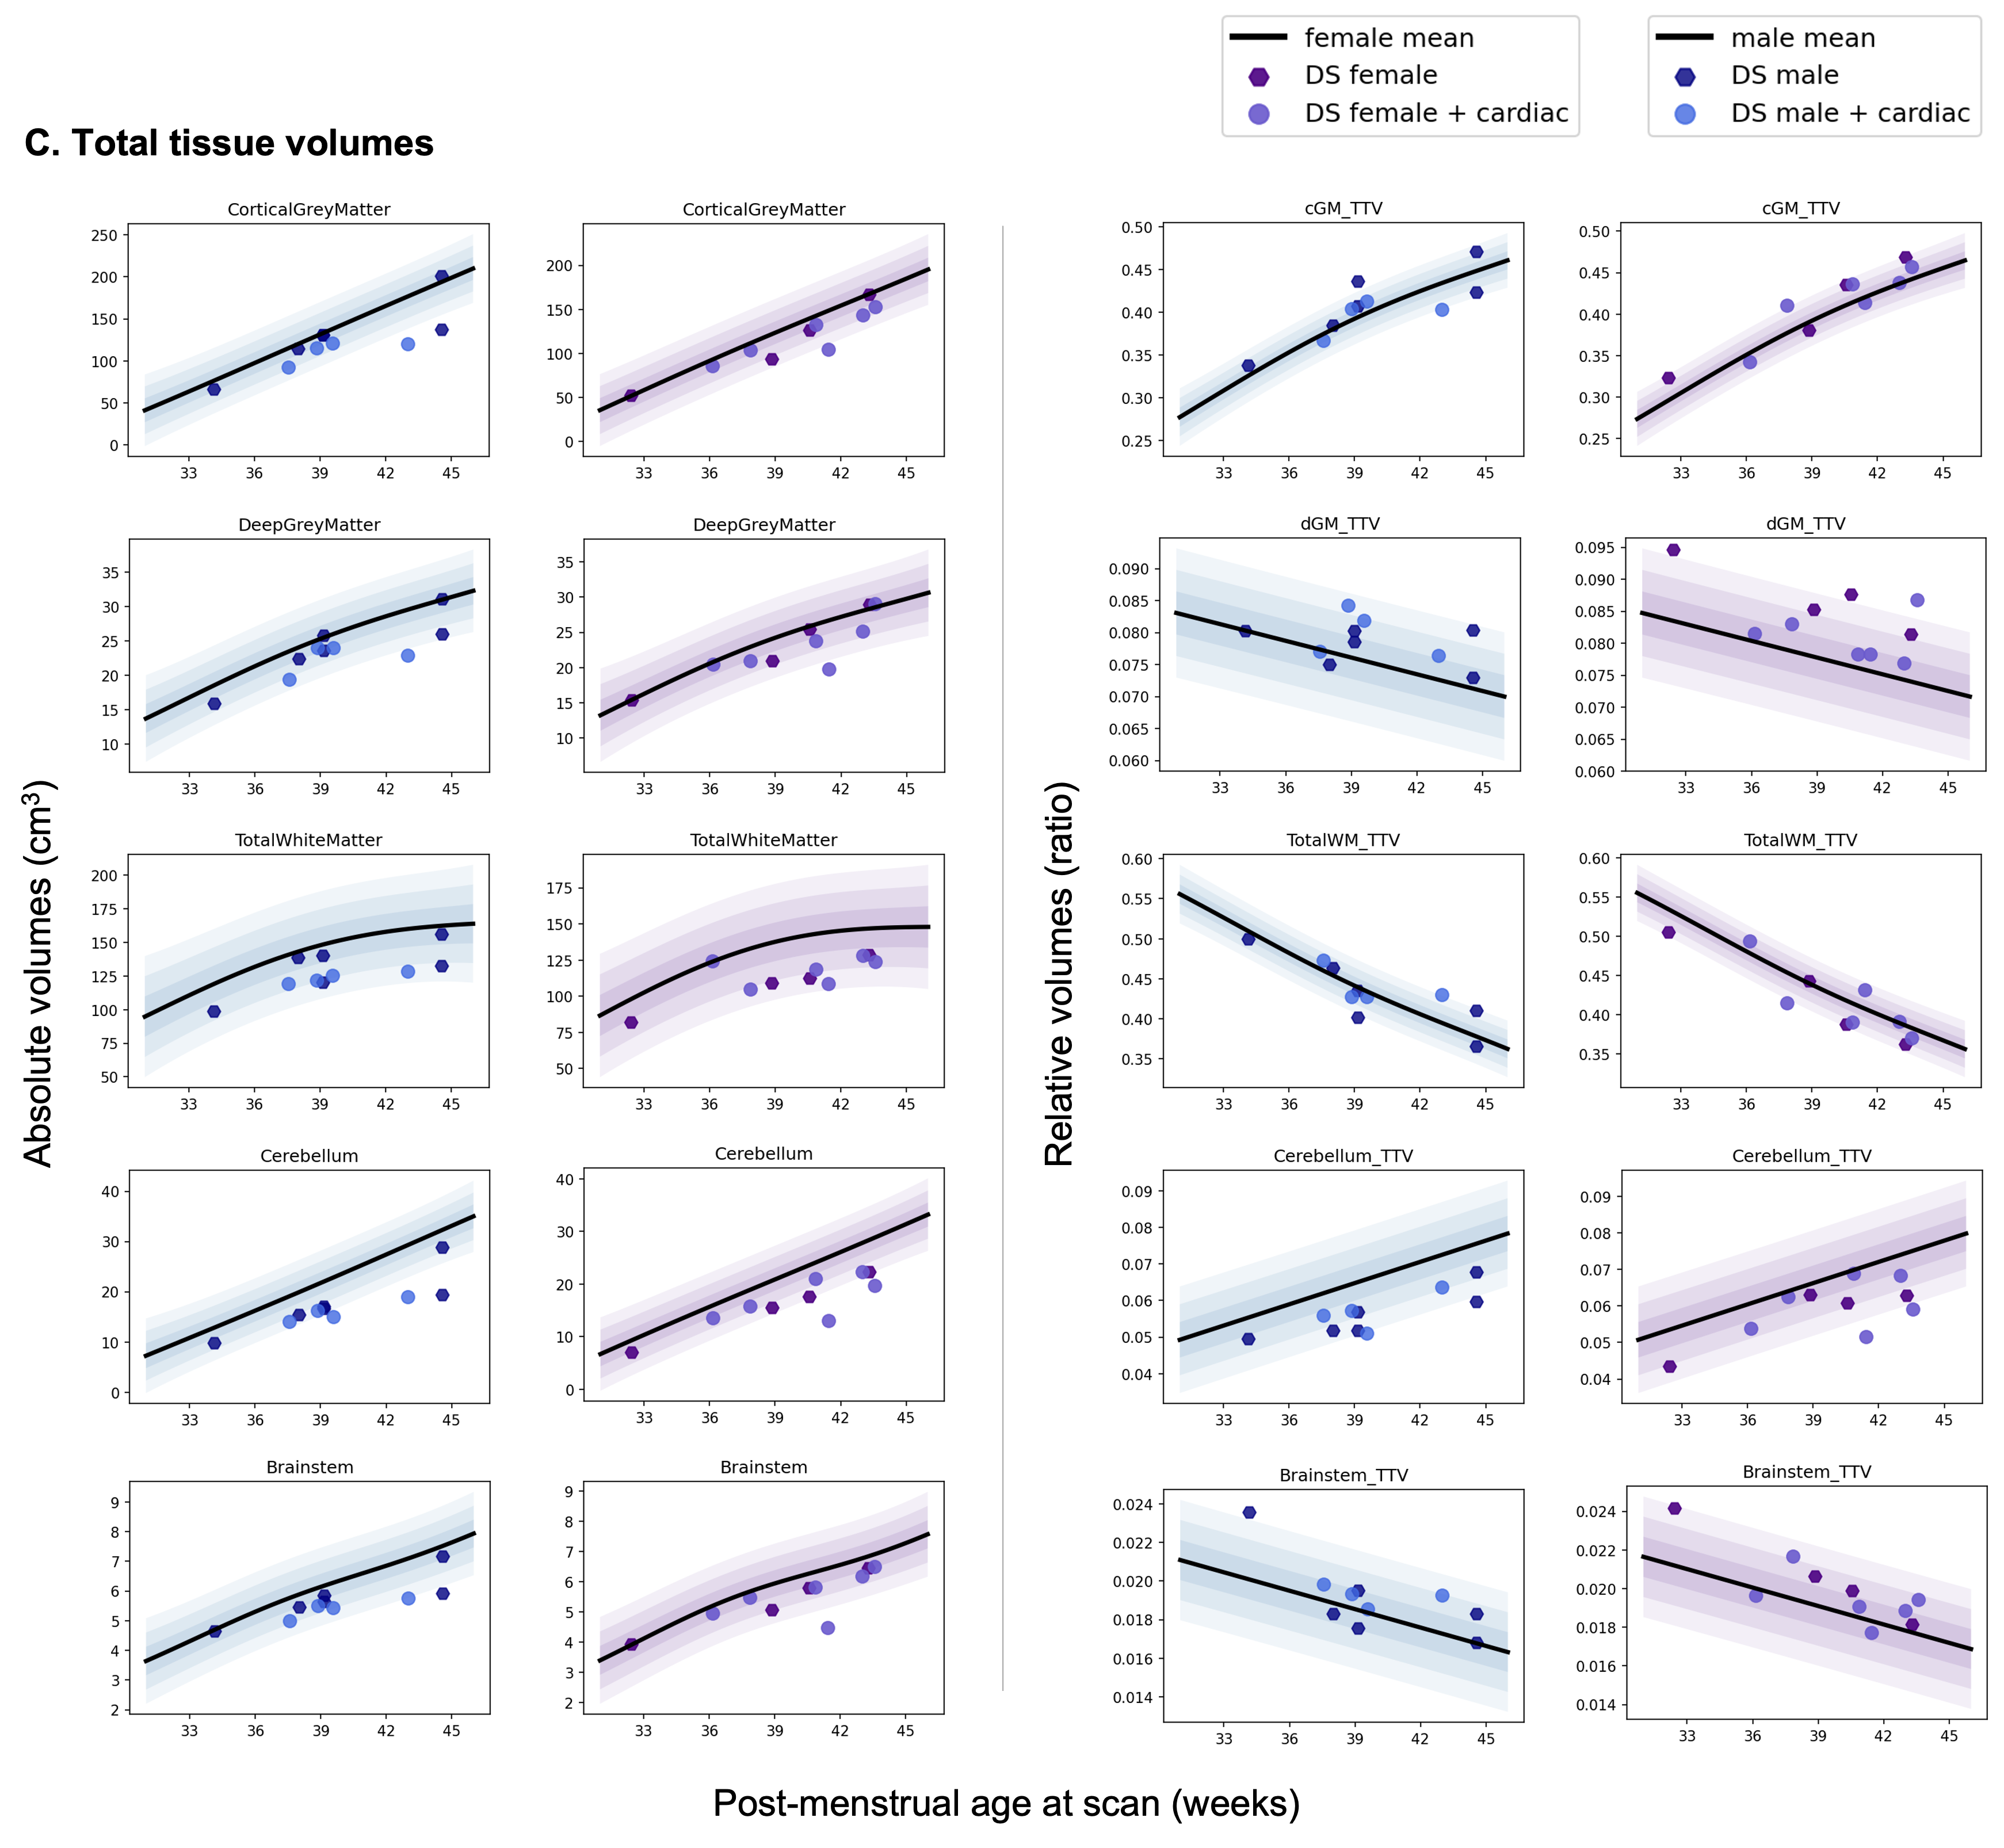
T2-weighted images from 20 neonates with DS [10 female, median (range) gestational age (GA) at birth = 37.07 (31.43-41.71) weeks; post-menstrual age (PMA) at scan median (range) = 39.36 (32.43-44.57) weeks] were acquired on a Philips Achieva 3T MRI scanner using the following parameters: TR=12000 ms, TE=156 ms, flip angle=90°, SENSE factor=2.11/2.58 (axial/sagittal). Motion-corrected and reconstructed T2-weighted images (0.5 mm isotropic resolution)5 were segmented into brain regions using a neonatal-specific algorithm6–8. We generated normative curves of typical volumetric brain development using Gaussian Process Regression, a Bayesian non-parametric regression technique, implemented in GPy in Python (https://sheffieldml.github.io/GPy/). 493 TDC [243 female, median (range) GA = 39.86 (24.71-43.00) weeks; median (range) PMA = 41.00 (31.14-45.14) weeks] from the developing Human Connectome Project (dHCP), imaged with the same protocol, were used to model typical brain development from 32-46 weeks PMA (Fig. 1&2)9–11. Absolute z-scores were derived for each neonate with DS, representing the degree of positive or negative deviation of a regional volume (in cm3) from the normative mean for a given sex and age (in weeks PMA) (Fig. 1&2). Relative volumes (as a ratio or %) were calculated as the proportion of each regional volume over total tissue volume (TTV), except for the lateral ventricles, which were calculated as a proportion of total brain volume (TBV) and extra-cerebral CSF (eCSF) as a proportion of total intracranial volume (ICV). Relative z-scores were also derived for each neonate (Fig. 1&2). Weights (at birth and scan, in kg) were converted into z-scores based on the RCPCH UK-WHO growth charts12.Results
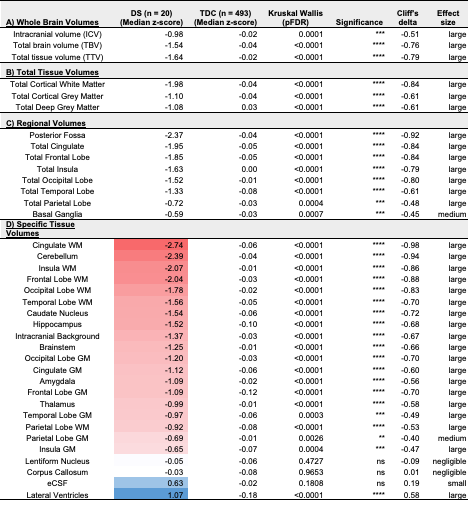
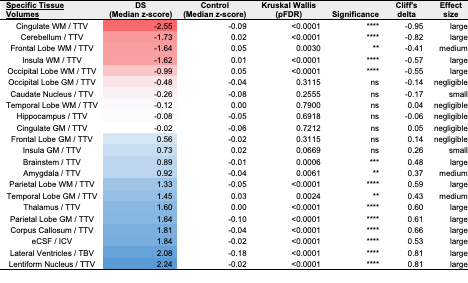
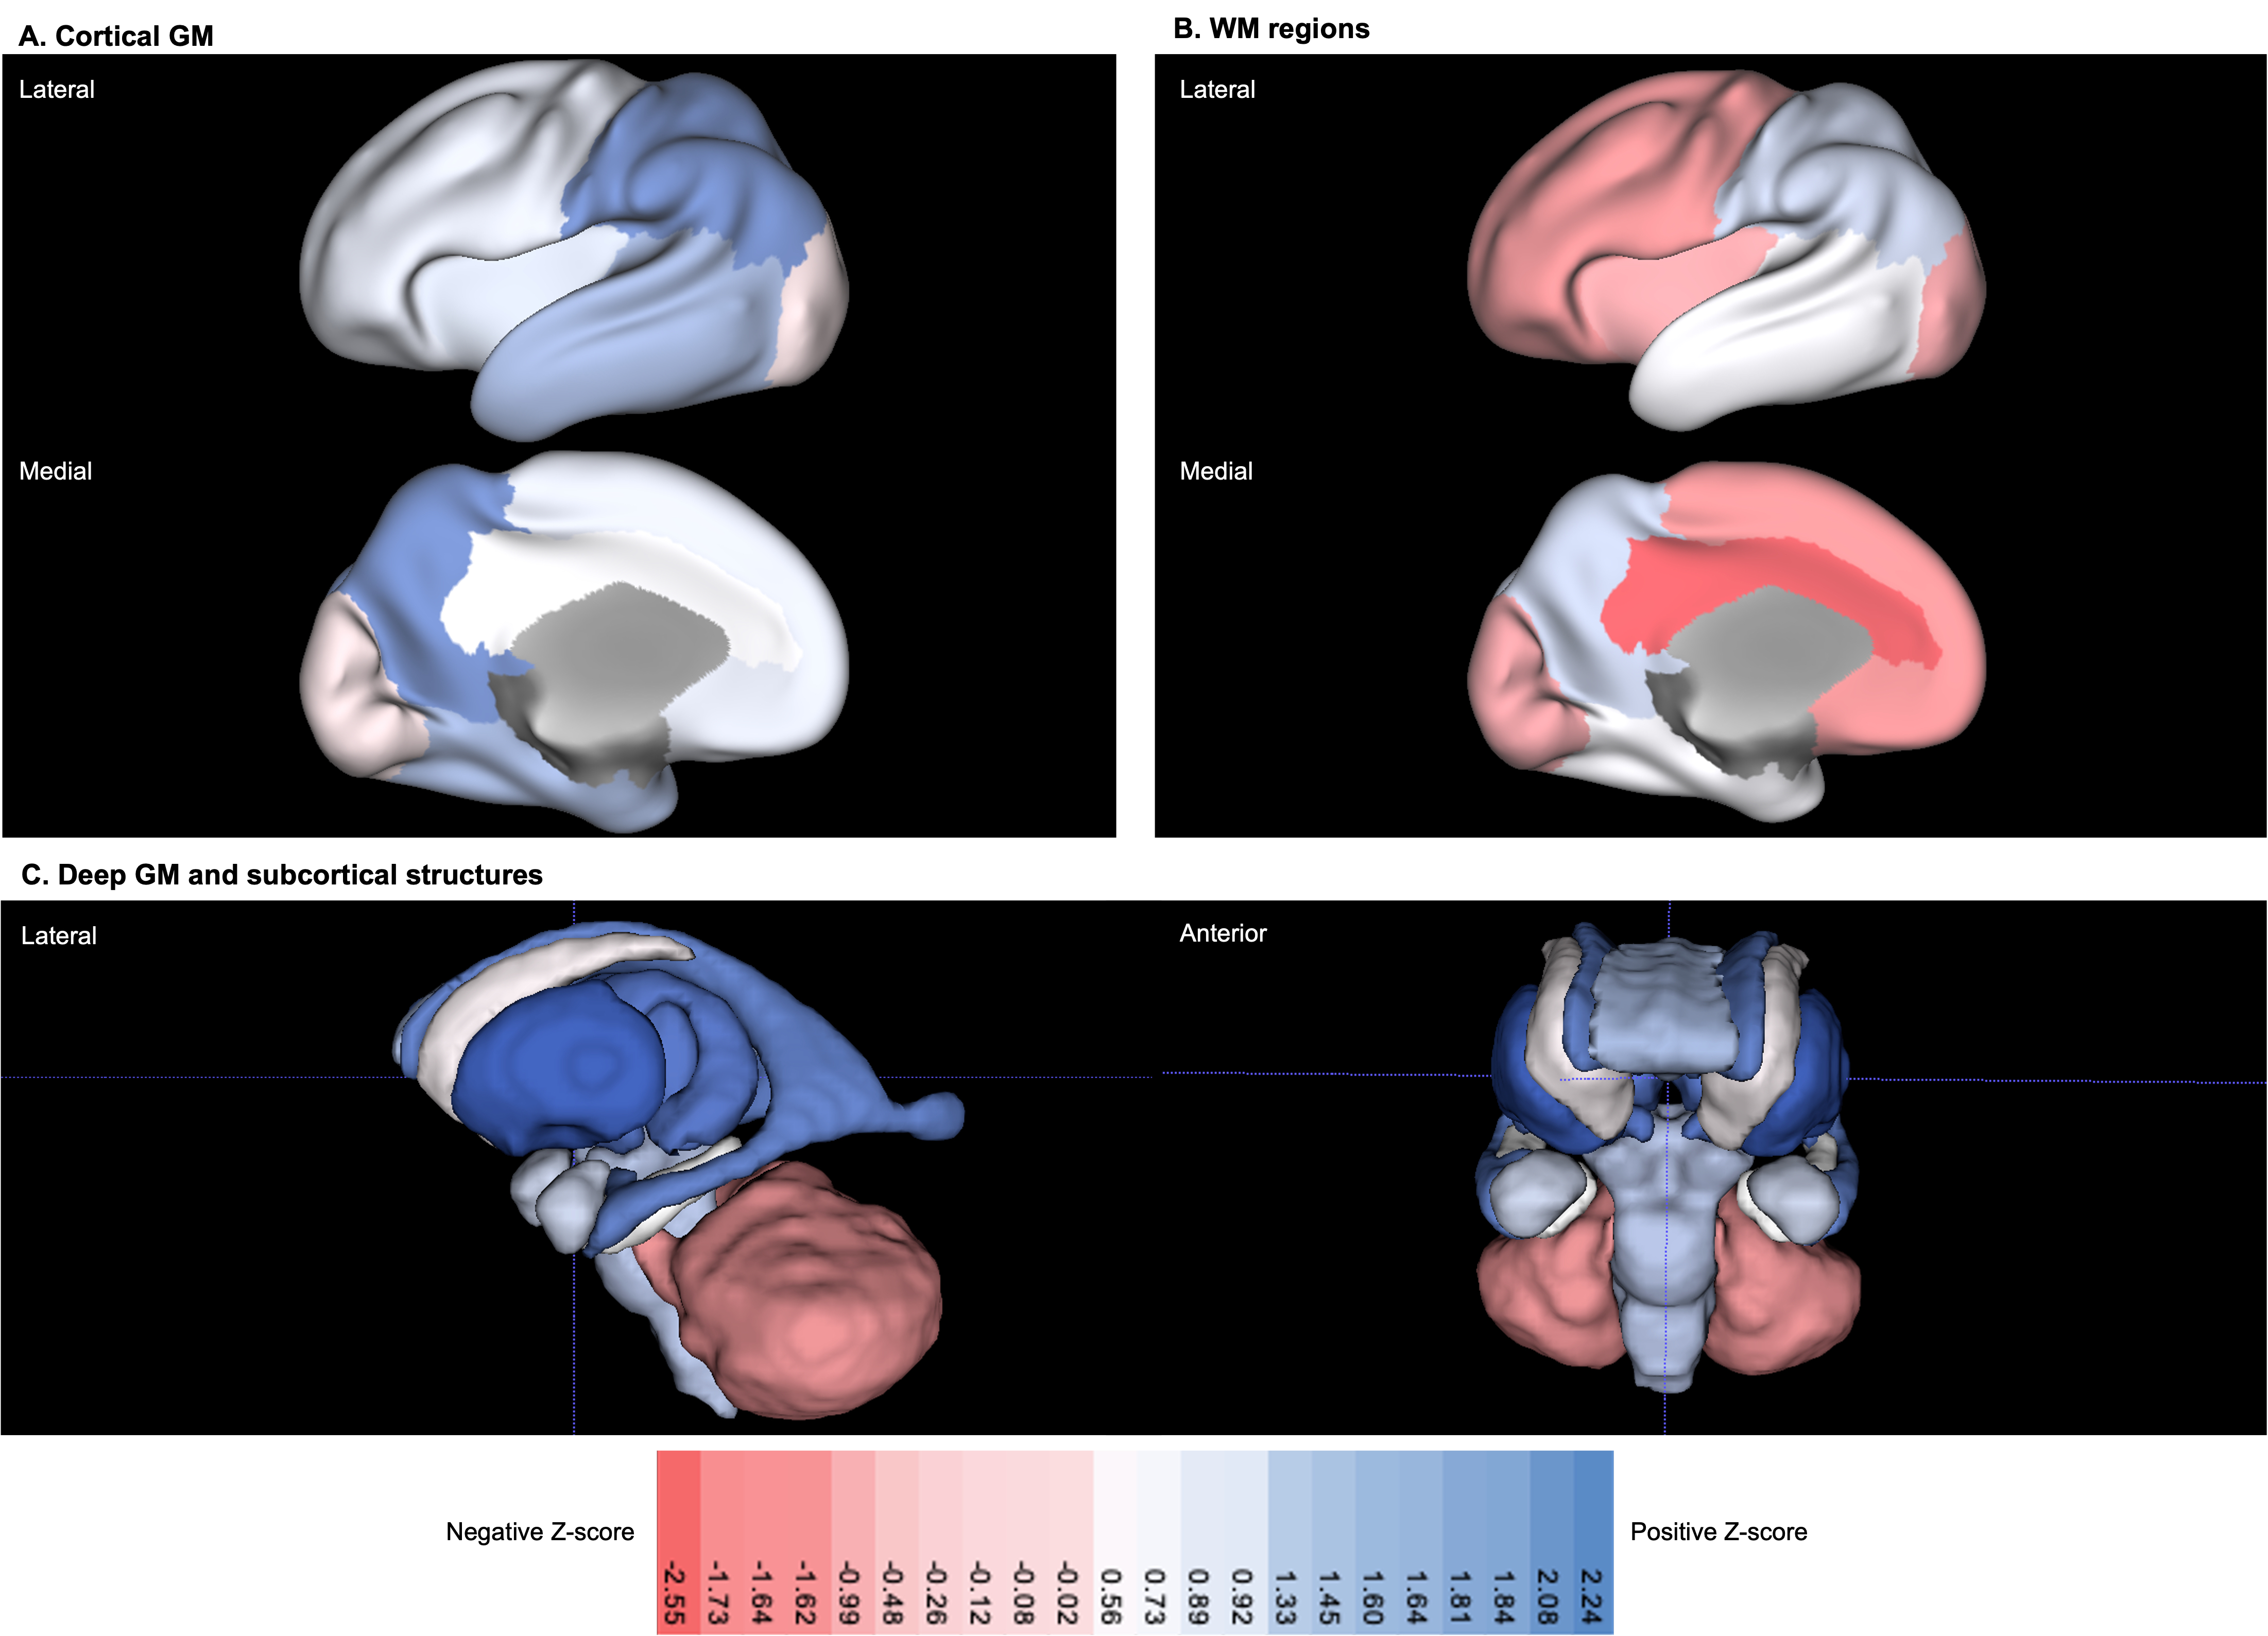
Once corrected for sex and age, birth and scan weight were not significantly different between DS and TDC. Whole brain volumes for the DS group were significantly smaller than TDC (ICV median z-score = -0.98, TTV median z-score = -1.64, pFDR <0.0001) (Fig. 3, section A). Almost all segmented regions and tissue types were significantly smaller in the DS group, with large effect sizes, except for the lentiform nucleus (median z-score = -0.05, pFDR = 0.47) and the corpus callosum (median z-score = -0.03, pFDR = 0.97), which were of similar size to TDC, whilst the eCSF (median z-score = +0.63, pFDR = 0.18) and lateral ventricles (median z-score = +1.07, pFDR <0.0001) were larger than norm (Fig. 3, sections B-D). Relative z-scores were used to distinguish between 1) volumetric differences that were predominantly driven by underlying differences in whole brain size from 2) extreme volumetric deviations that remained after controlling for differences in whole brain size13,14. This scaling analysis revealed that the cingulate WM (median z-score = -2.55, pFDR <0.0001), the cerebellum (median z-score = -1.73, pFDR <0.0001), the frontal WM (median z-score = -1.64, pFDR = 0.003), the insular WM (median z-score = -1.62, pFDR <0.0001), and the occipital WM (median z-score = -0.99, pFDR <0.0001) occupied significantly smaller proportions of the brain in DS neonates compared to TDCs (Figs. 4&5).Discussion
Despite its congenital nature, there have been relatively few early neuroimaging studies in DS compared to childhood, adolescent, and adult studies15. Traditionally, ultrasound imaging of the fetal brain in DS has shown evidence for ventriculomegaly16,17 (i.e., lateral ventricular diameter ≥ 10mm) and reduced cerebellar measurements (i.e., cerebellar hypoplasia)18 in the second trimester of gestation. More recently, in vivo fetal MRI has demonstrated decreased growth trajectories for the cortical GM, the sub-cortical parenchyma and the cerebellar hemispheres in fetuses with DS19. Furthermore, our recent combined fetal and neonatal MRI study revealed significantly reduced whole brain and cerebellar volumes, as well as enlarged lateral ventricular volumes, from the second trimester (< 28 weeks GA), whilst cortical GM volumes were reduced from the third trimester (> 28 weeks GA) in DS20. All the above findings were corroborated in our current neonatal study. Here, using robust normative modelling of the neonatal brain, we have been able to identify that, in addition to the cerebellum, the cingulate, frontal, insular and occipital WM segments were strongly reduced in age-appropriate volume, and occupied significantly smaller proportions of the brain in DS compared to TDC.Conclusion
In addition to cerebellar hypoplasia, ventriculomegaly and reduced cortical GM volumes, here we have identified that neonates with DS have markedly reduced volumes in the cingulate, frontal, insular and occipital WM segments compared to TDC. In future, a correlative approach of individual neuro-developmental outcomes and regional brain deviations may help elucidate the aetiology of highly varied cognitive impairments and intellectual disability3,4 in DS.Acknowledgements
We thank the parents and children who participated in this study. The authors gratefully acknowledge staff from the Centre for the Developing Brain (CDB) at King's College London and the Neonatal Intensive Care Unit (NICU) at St. Thomas’ Hospital. In particular, the research radiologists, radiographers, clinicians, neonatal nurses, midwives, and the administrative teams. In addition, we wish to thank all our obstetric and fetal medicine colleagues from our patient identification sites who have referred participants to us.
This work was supported by the Medical Research Council (MRC) [MR/K006355/1 and MR/LO11530/1], Rosetrees Trust [A1563], Fondation Jérôme Lejeune [2017b–1707], and Sparks and Great Ormond Street Hospital Children's Charity [V5318]. The normative sample was collected as part of the developing Human Connectome Project (dHCP), funded by the ERC grant agreement no. 319456. J.O. is supported by a Sir Henry Dale Fellowship jointly funded by the Wellcome Trust and the Royal Society (Grant 206675/Z/17/Z). M.R., J.O., A.D.E. received support from the MRC Centre for Neurodevelopmental Disorders (CNDD), King’s College London (Grant MR/N026063/1). A.F-G.'s PhD is supported by the MRC CNDD at King’s College London. This research was supported by core funding from the Wellcome/EPSRC Centre for Medical Engineering [WT203148/Z/16/Z], the National Institute for Health Research (NIHR) Biomedical Research Centre based at Guy’s and St Thomas’ NHS Foundation Trust & King’s College London, and the NIHR Clinical Research Facility. The views expressed are those of the author(s) and not necessarily those of the NHS, the NIHR or the Department of Health and Social Care.
References
1. Antonarakis, S. E. et al. Down syndrome. Nat. Rev. Dis. Prim. 6, 1–20 (2020).
2. Wu, J. & Morris, J. K. Trends in maternal age distribution and the live birth prevalence of Down’s syndrome in England and Wales: 1938-2010. Eur. J. Hum. Genet. 21, 943–947 (2013).
3. Karmiloff-Smith, A. et al. The importance of understanding individual differences in Down syndrome. F1000Research 5, 1–10 (2016).
4. Thomas, M. S. C. et al. A multi-level developmental approach to exploring individual differences in Down syndrome: genes, brain, behaviour, and environment. Res. Dev. Disabil. 104, 103638 (2020).
5. Kuklisova-Murgasova, M., Quaghebeur, G., Rutherford, M. A., Hajnal, J. V. & Schnabel, J. A. Reconstruction of fetal brain MRI with intensity matching and complete outlier removal. Med. Image Anal. 16, 1550–1564 (2012).
6. Makropoulos, A. et al. Automatic whole brain MRI segmentation of the developing neonatal brain. IEEE Trans. Med. Imaging 33, 1818–1831 (2014).
7. Makropoulos, A. et al. Regional growth and atlasing of the developing human brain. Neuroimage 125, 456–478 (2016).
8. Makropoulos, A. et al. The developing human connectome project: A minimal processing pipeline for neonatal cortical surface reconstruction. Neuroimage 173, 88–112 (2018).
9. Dimitrova, R. et al. Heterogeneity in brain microstructural development following preterm birth. Cereb. Cortex 30, 4800–4810 (2020).
10. Dimitrova, R. et al. Phenotyping the Preterm Brain: Characterizing Individual Deviations From Normative Volumetric Development in Two Large Infant Cohorts. Cereb. Cortex 1–13 (2021) doi:10.1093/cercor/bhab039.
11. Bonthrone, A. F. et al. Individualized brain development and cognitive outcome in infants with congenital heart disease. Brain Commun. 3, 1–14 (2021).
12. Wright, C. M. et al. Using the new UK-WHO growth charts. BMJ 340, c1140–c1140 (2010).
13. Kapellou, O. et al. Abnormal cortical development after premature birth shown by altered allometric scaling of brain growth. PLoS Med. 3, 1382–1390 (2006).
14. de Jong, L. W. et al. Allometric scaling of brain regions to intra-cranial volume: An epidemiological MRI study. Hum. Brain Mapp. 38, 151–164 (2017).
15. Hamner, T., Udhnani, M. D., Osipowicz, K. Z. & Lee, N. R. Pediatric Brain Development in Down Syndrome: A Field in Its Infancy. J. Int. Neuropsychol. Soc. 24, 966–976 (2018).
16. Aagaard-Tillery, K. M. et al. Role of second-trimester genetic sonography after down syndrome screening. Obstet. Gynecol. 114, 1189–1196 (2009).
17. Agathokleous, M., Chaveeva, P., Poon, L. C. Y., Kosinski, P. & Nicolaides, K. H. Meta-analysis of second-trimester markers for trisomy 21. Ultrasound Obstet. Gynecol. 41, 247–261 (2013).
18. Rotmensch, S. et al. Fetal transcerebellar diameter in Down syndrome. Obstet. Gynecol. 89, 534–537 (1997).
19. Tarui, T. et al. Quantitative MRI Analyses of Regional Brain Growth in Living Fetuses with down Syndrome. Cereb. Cortex 30, 382–390 (2020).
20. Patkee, P. A. et al. Early alterations in cortical and cerebellar regional brain growth in Down Syndrome: An in vivo fetal and neonatal MRI assessment. NeuroImage Clin. 25, 102139 (2020).
Figures