1231
Imaging of aortic valve dynamics: comparison between sub-millisecond MRI and echocardiography1Center for MR Research, University of Illinois at Chicago, Chicago, IL, United States, 2Department of Radiology, Stanford University, Stanford, CA, United States, 3Division of Cardiology, Department of Medicine, University of Illinois at Chicago, Chicago, IL, United States, 4Department of Radiology, University of Illinois at Chicago, Chicago, IL, United States, 5Department of Neurosurgery, University of Illinois at Chicago, Chicago, IL, United States, 6Department of Biomedical Engineering, University of Illinois at Chicago, Chicago, IL, United States
Synopsis
The aortic valve dynamics is traditionally examined using ultrasound echocardiography in clinical practice. Recently, a novel MRI technique capable of sub-millisecond temporal resolution, coined get-SPEEDI MRI, was successfully applied to visualize the aortic valve dynamics. We have evaluated both get-SPEEDI and echocardiography on healthy human subjects and found a substantial agreement between both techniques in the characterization of the aortic valve opening and closing phases. The sub-millisecond temporal resolution of get-SPEEDI allows for the measurement of steep AVA variations and the visualization of detailed features that may reflect the cardiac function and physiology.
Introduction
The aortic valve plays a key role in cardiac function. Diagnosis of aortic stenosis, regurgitation, calcification and other pathologies highly depends on an accurate measurement of the aortic valve dynamics1, which requires both high spatial and temporal resolutions2-4. Due partially to the limited temporal resolution of cardiac MR, the aortic valve dynamics is typically examined using ultrasound echocardiography. Recently, an MR technique capable of sub-millisecond temporal resolution, coined gradient-echo-train Sub-millisecond Periodic Event Encoded Dynamic Imaging (get-SPEEDI) has been introduced and successfully used to visualize the aortic valve dynamics in human subjects5,6. We herein investigate the possible correlation between get-SPEEDI measurements and echocardiography observations.Methods
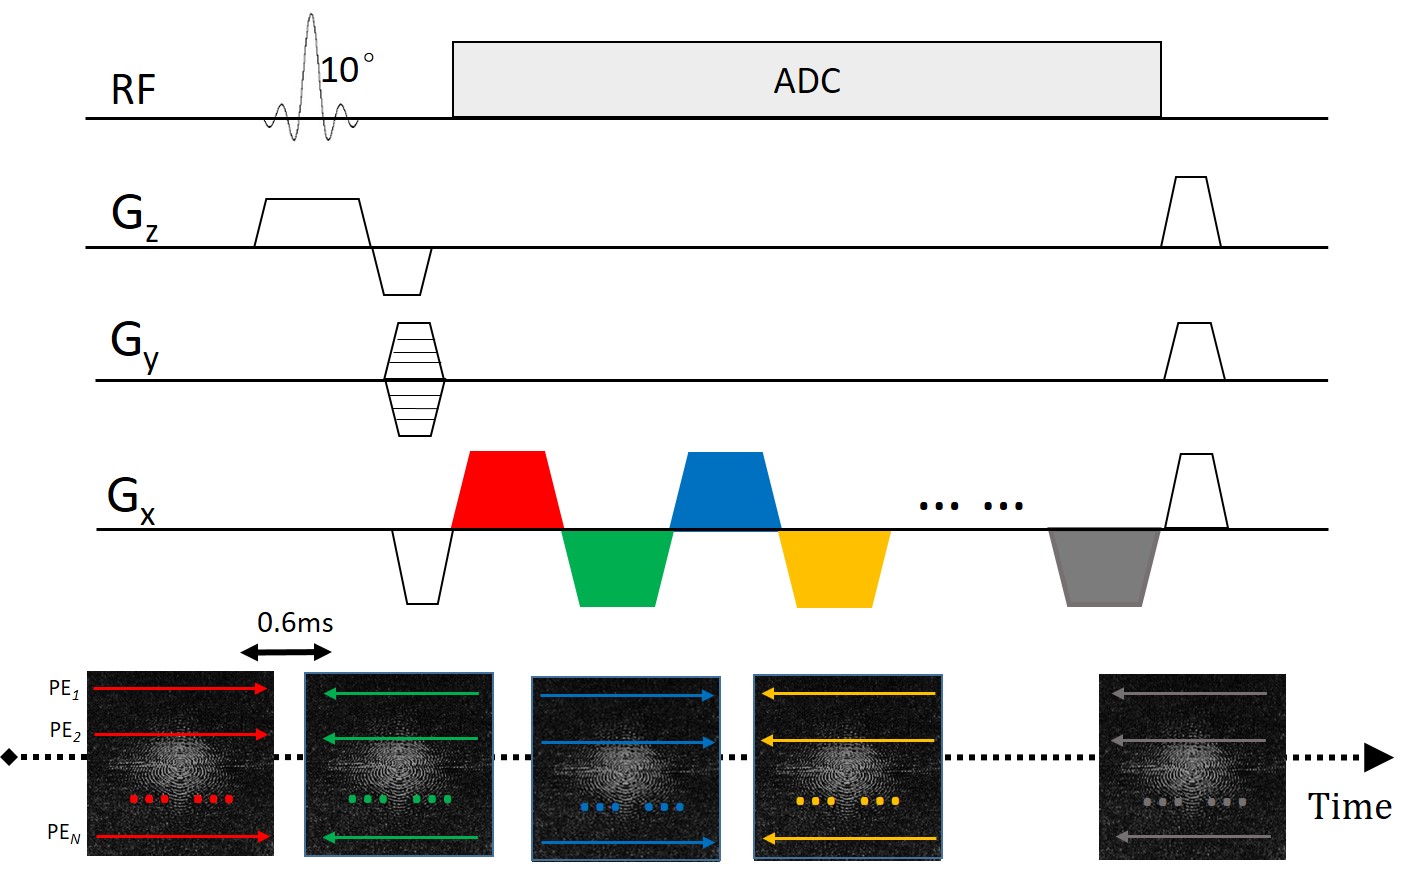
Five healthy human subjects (age:22-32 years; mean=27.6 years) were recruited under an IRB-approved protocol. All subjects underwent cardiac MRI examination on a 3T GE MR750 scanner using a 32-channel cardiac phased-array coil. After a series of localizer scans, an imaging plane was chosen orthogonally to the aortic outflow tract for simultaneous en face visualization of all three aortic valve cusps throughout the cardiac cycle using a get-SPEEDI sequence (Figure 1). The sequence consisted of a train of gradient echoes, where each echo in the echo train was equally phase encoded and assigned to a separate k-space. With ECG triggering and multiple breath holds, the sequence was iterated with different phase encodings, until the resulting collection of k-spaces was adequately sampled and Fourier-transformed into a time-resolved series of images. Therefore, the dynamics of the aortic valve was dissected with a temporal resolution equal to the echo spacing. In this study, the imaging parameters were: FOV=22cm×22cm, matrix size=118×118, slice thickness=8mm, flip angle=10°, and temporal resolution=0.6ms. The full acquisition spanned over 160 heart beats. Images were reconstructed offline for a total of 590 time-resolved frames. On each frame, the aortic valve orifice was delineated by a semi-automated algorithm in order to derive the planimetric aortic valve area (AVA) and investigate its time evolution6. From the time-series, the durations of the three phases of the aortic valve cycle – a rapid opening, a slow closing and a rapid closing – were measured, together with the extent and duration of the overshoot at the end of the rapid opening phase4. Transthoracic 2D echocardiography was carried out on an iE33 ultrasound unit (Philips Healthcare, Best, The Netherlands) for all subjects. The aorta dynamics were recorded in the parasternal long-axis view with one image acquired every 15ms under B-mode. Using the B-mode image as a reference, 1D M-mode echocardiograms covering the orifice plane were collected to capture the dynamics of aortic valve movement with a frame rate of 0.8ms, which was comparable to get-SPEEDI temporal resolution. Similar to the measurements from the MR images, the dynamic change of AVA, the durations of the three primary phases of the aortic valve cycle, and the overshoot were assessed on the M-mode profiles. Finally, the maximum aortic valve area was extracted as the highest point in the curve for the get-SPEEDI data and derived by the continuity equation in the ultrasound, using either the velocity-time integral or the peak velocity7. Data were compared between the imaging methods by a Mann-Whitney U test and a Pearson’s correlation analysis.Results and Discussion
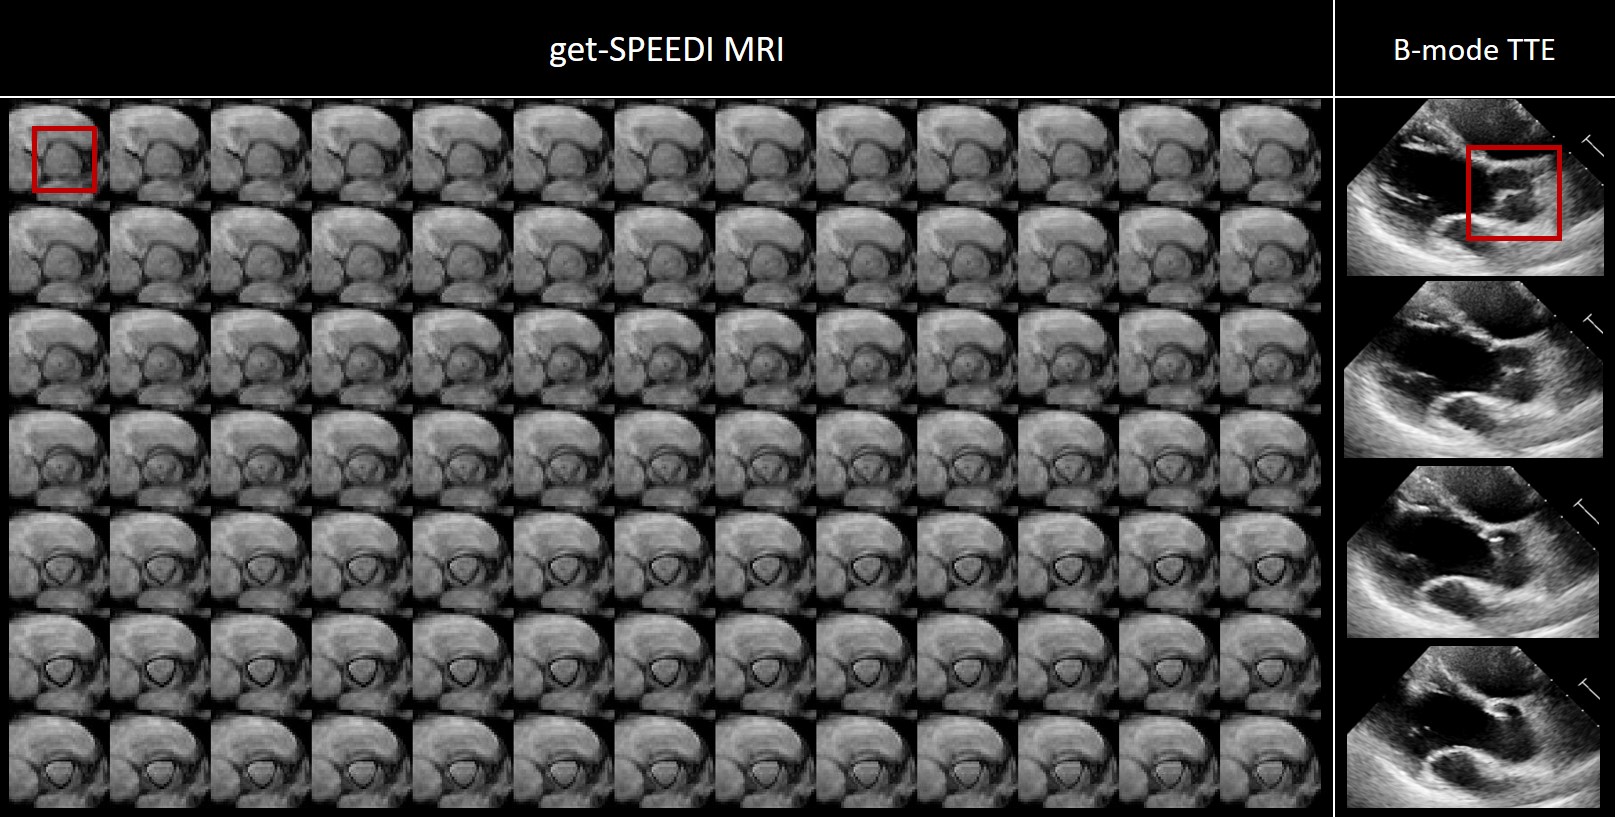
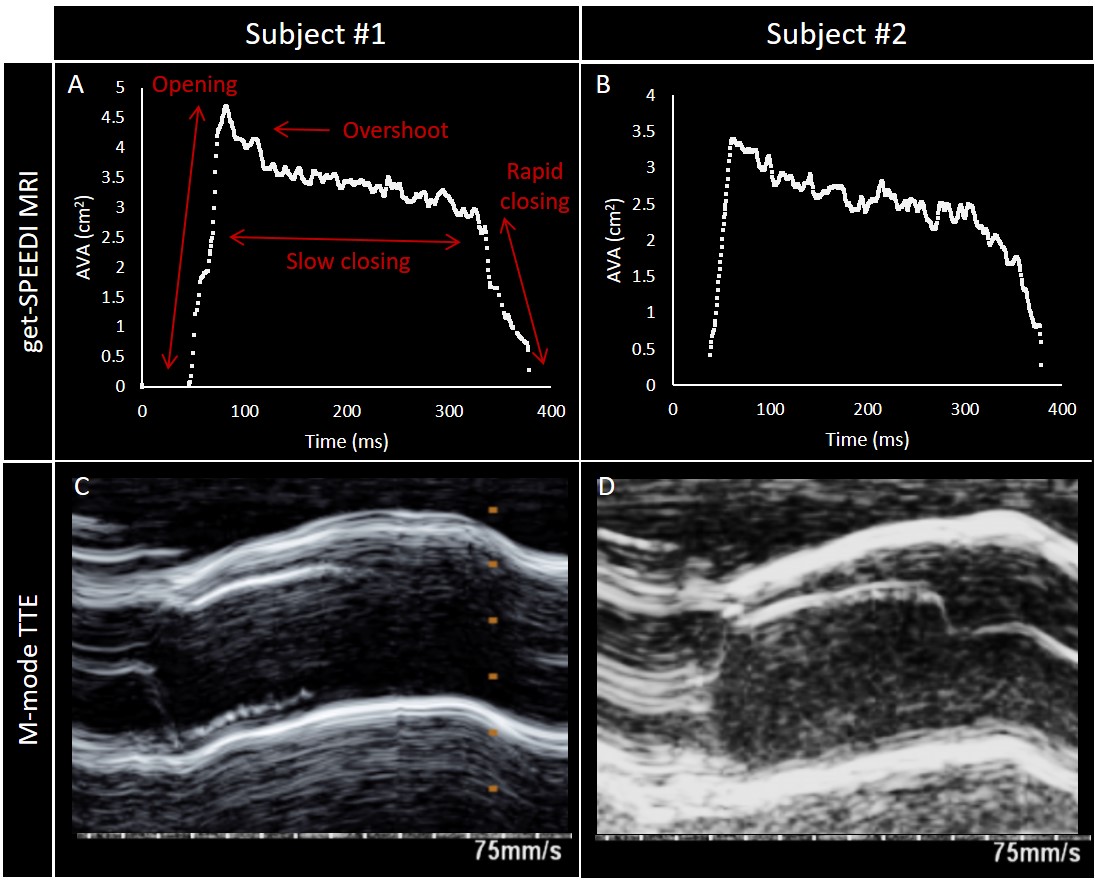
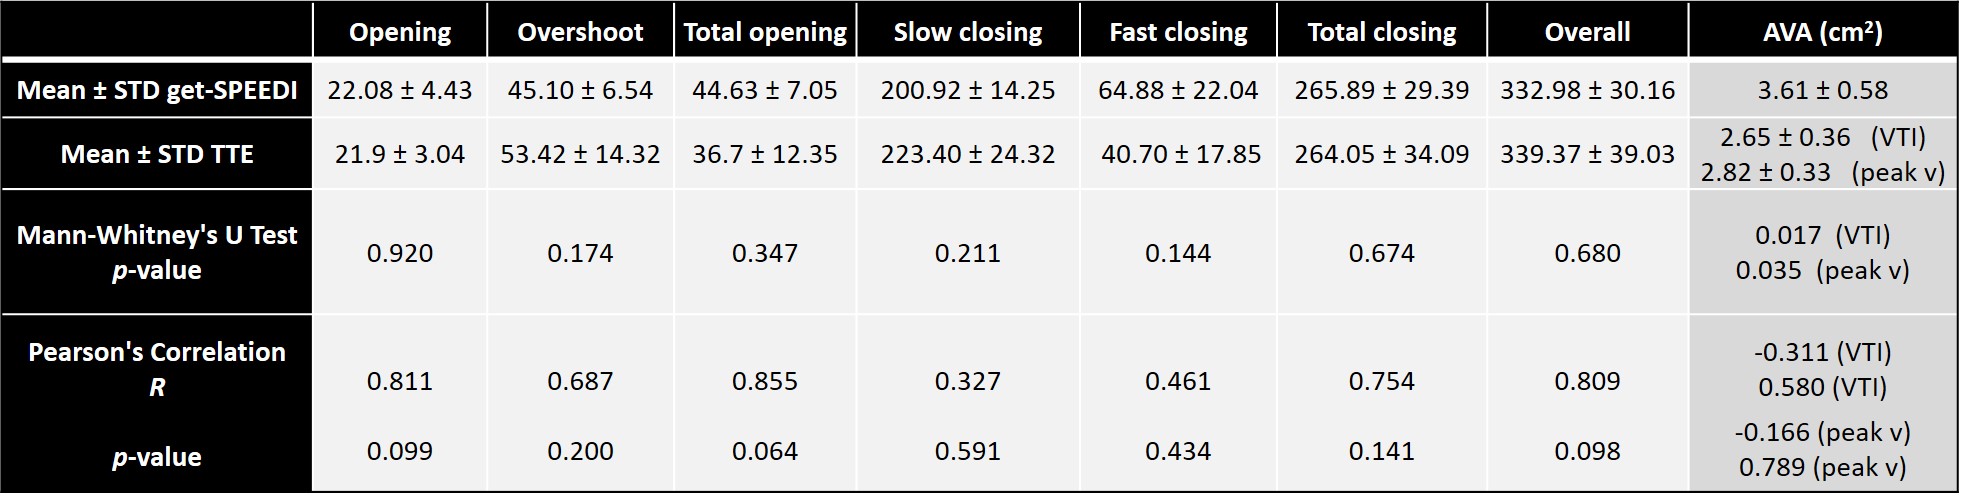
A qualitative comparison of get-SPEEDI and B-mode echocardiography during the aortic valve opening phase is shown in Figure 2 for a representative subject. A good correlation between the methods was observed, despite difference in temporal resolution. The evolution of the valve area from get-SPEEDI is plotted in Figure 3A-B, together with the M-mode echocardiograms (Figure 3C-D) covering the same time span. The quantitative analysis results are summarized in Table 1. There was no statistically significant difference between the duration of the phases measured with get-SPEEDI MRI and ultrasound echocardiography. Interestingly, the small differences observed in the measurements of the slow and rapid closing phases were complementary, resulting in a good agreement for the total closing phase. A possible explanation might lie in the inaccuracy in determining the exact echocardiographic frame when the transition from slow to rapid closing occurred (see for example Figure 3C). A similar argument can be made for the onset and final frame of the overshoot, which was not always easily identifiable, while measurements of the opening phase and overall duration were comparable between the two techniques. Trends towards correlation, albeit not statistically significant possibly due to the limited sample size, were found in the Pearson correlation analysis for the opening phases and overall duration. The maximal AVA measured by the planimetric get-SPEEDI resulted in significantly larger values than the one measured by echocardiography through the continuity equation, using either considering the velocity time integral or the peak velocity, as previously reported7.Conclusion
The comparison of get-SPEEDI with echocardiography revealed a substantial agreement between the techniques in the measurement of the time course of the aortic valve dynamics. The frontal orientation and good image quality of get-SPEEDI MRI are attractive features for visualizing the movement of all three leaflets throughout the cardiac cycle. The sub-millisecond temporal resolution allows for the measurement of steep AVA variations and the characterization of fine features that can reflect the cardiac function and physiology.Acknowledgements
This work was supported in part by the National Institutes of Health (Grant No. 1S10RR028898-01). We thank Jianping Han for performing echocardiography, Dr. Kaibao Sun and Guangyu Dan for aiding the MRI sequence development, and Dr. Mayank Kansal for the helpful discussion on echocardiography in clinical practice.References
1. Zoghbi WA, Adams D, Bonow RO, Enriquez-Sarano M, Foster E, Grayburn PA, Hahn RT, Han Y, Hung J, Lang RM, Little SH, Shah DJ, Shernan S, Thavendiranathan P, Thomas JD, Weissman NJ. Recommendations for Noninvasive Evaluation of Native Valvular Regurgitation: A Report from the American Society of Echocardiography Developed in Collaboration with the Society for Cardiovascular Magnetic Resonance. J Am Soc Echocardiogr. 2017;30(4):303. doi:10.1016/j.echo.2017.01.007.
2. Leyh RG, Schmidtke C, Sievers HH and Yacoub MH. Opening and Closing Characteristics of the Aortic Valve After Different Types of Valve-Preserving Surgery. Circulation. 1999 Nov 23;100(21):2153-60. doi: 10.1161/01.cir.100.21.2153.
3. La Grutta L, Toia P, Grassedonio E, Pasta S, Albano D, Agnello F, Maffei E, Cademartiri F, Bartolotta TV, Galia M, Midiri M. TAVI imaging: over the echocardiography. Radiol Med. 2020 Nov;125(11):1148-1166. doi:10.1007/s11547-020-01281-0.
4. Romero J, Ajijola O, Shivkumar K, Tung R. Characterization of Aortic Valve Closure Artifact During Outflow Tract Mapping Correlation With Hemodynamics and Mechanical Valves. Circulation: Arrhythmia and Electrophysiology Volume 10, Issue 6, June 2017. doi:10.1161.CIRCEP/116.004845.
5. Zhong Z, Sun K, Karaman MM, Zhou XJ. Magnetic resonance imaging with submillisecond temporal resolution. Magn Reson Med. 2021 May;85(5):2434-2444. doi: 10.1002/mrm.28588.
6. Zhong Z, Sun K, Dan G, Luo Q, Farzaneh-Far A, Karaman MM, Zhou XJ. Visualization of Human Aortic Valve Dynamics Using Magnetic Resonance Imaging with Sub-Millisecond Temporal Resolution. J Magn Reson Imaging. 2021 Oct;54(4):1246-1254. doi: 10.1002/jmri.27603.
7. Woldendorp K, Bannon PG, Grieve SM. Evaluation of aortic stenosis using cardiovascular magnetic resonance: a systematic review & meta-analysis. J Cardiovasc Magn Reson. 2020;22(1):45. Published 2020 Jun 15. doi:10.1186/s12968-020-00633-z.
Figures