1230
Towards fast but accurate velocity quantification with 3D ultra-short TE phase contrast imaging1Physikalisch-Technische Bundesanstalt (PTB), Braunschweig and Berlin, Germany, 2Center for Magnetic Resonance Research, University of Minnesota, Minneapolis, MN, United States, 3Division of Medical Physics in Radiology, German Cancer Research Center (DKFZ), Heidelberg, Germany, 4Institute of Radiology, University Hospital Erlangen, Friedrich-Alexander-Universität Erlangen-Nürnberg (FAU), Erlangen, Germany, 5Department of Cardiology and Nephrology, Experimental and Clinical Research Center, a joint cooperation between the Charité Medical Faculty and the Max-Delbrueck Center for Molecular Medicine and HELIOS Hospital Berlin Buch, Berlin, Germany, 6DZHK (German Center for Cardiovascular Research), partner site Berlin, Berlin, Germany
Synopsis
The aim of this work is to develop and investigate an accurate sequence for MR flow quantification. We utilized a 3D ultra-short echo time (UTE) flow sequence to minimize the displacement artifact that frequently occurs in MR flow imaging. In UTE acquisitions, the position is encoded at the beginning of the readout. Thus, the time difference between velocity encoding and spatial position encoding is minimized. This leads to an improved accuracy of the velocity quantification. The sequence was tested and validated against a reference sequence and a conventional 4D flow sequence in a flow experiment in vitro at 3T.
Introduction
Phase-contrast (PC) based flow MRI is an established method commonly used in clinical routine1. Moreover, in medical research, 4D flow2 is increasingly applied in-vitro to quantify velocity vector fields in 3D printed phantoms3. Such applications require accurate measurements; however, they are limited by artifacts in Cartesian PC flow MRI4 since position and velocity are not encoded simultaneously. To circumvent this, SYNC-SPI (Synchronized Single Point Imaging) was recently proposed5, but SYNC-SPI requires scan times of several hours5. Fast but still accurate flow measurements can be achieved with ultra-short echo time (UTE) sequences that are known to reduce flow artifacts e.g., in stenoses6,7, and that have been applied in recent animal studies8,9. However, a systematic analysis of the reduction of the artifact compared to a Cartesian 4D flow sequence and a comparison to an artifact-free ground truth acquisition is still missing. Therefore, the aim of this work was to develop a 4D flow radial, center-out UTE sequence and to quantify the displacement artifacts of an UTE, Cartesian and SYNC-SPI sequence in phantom measurements.Methods
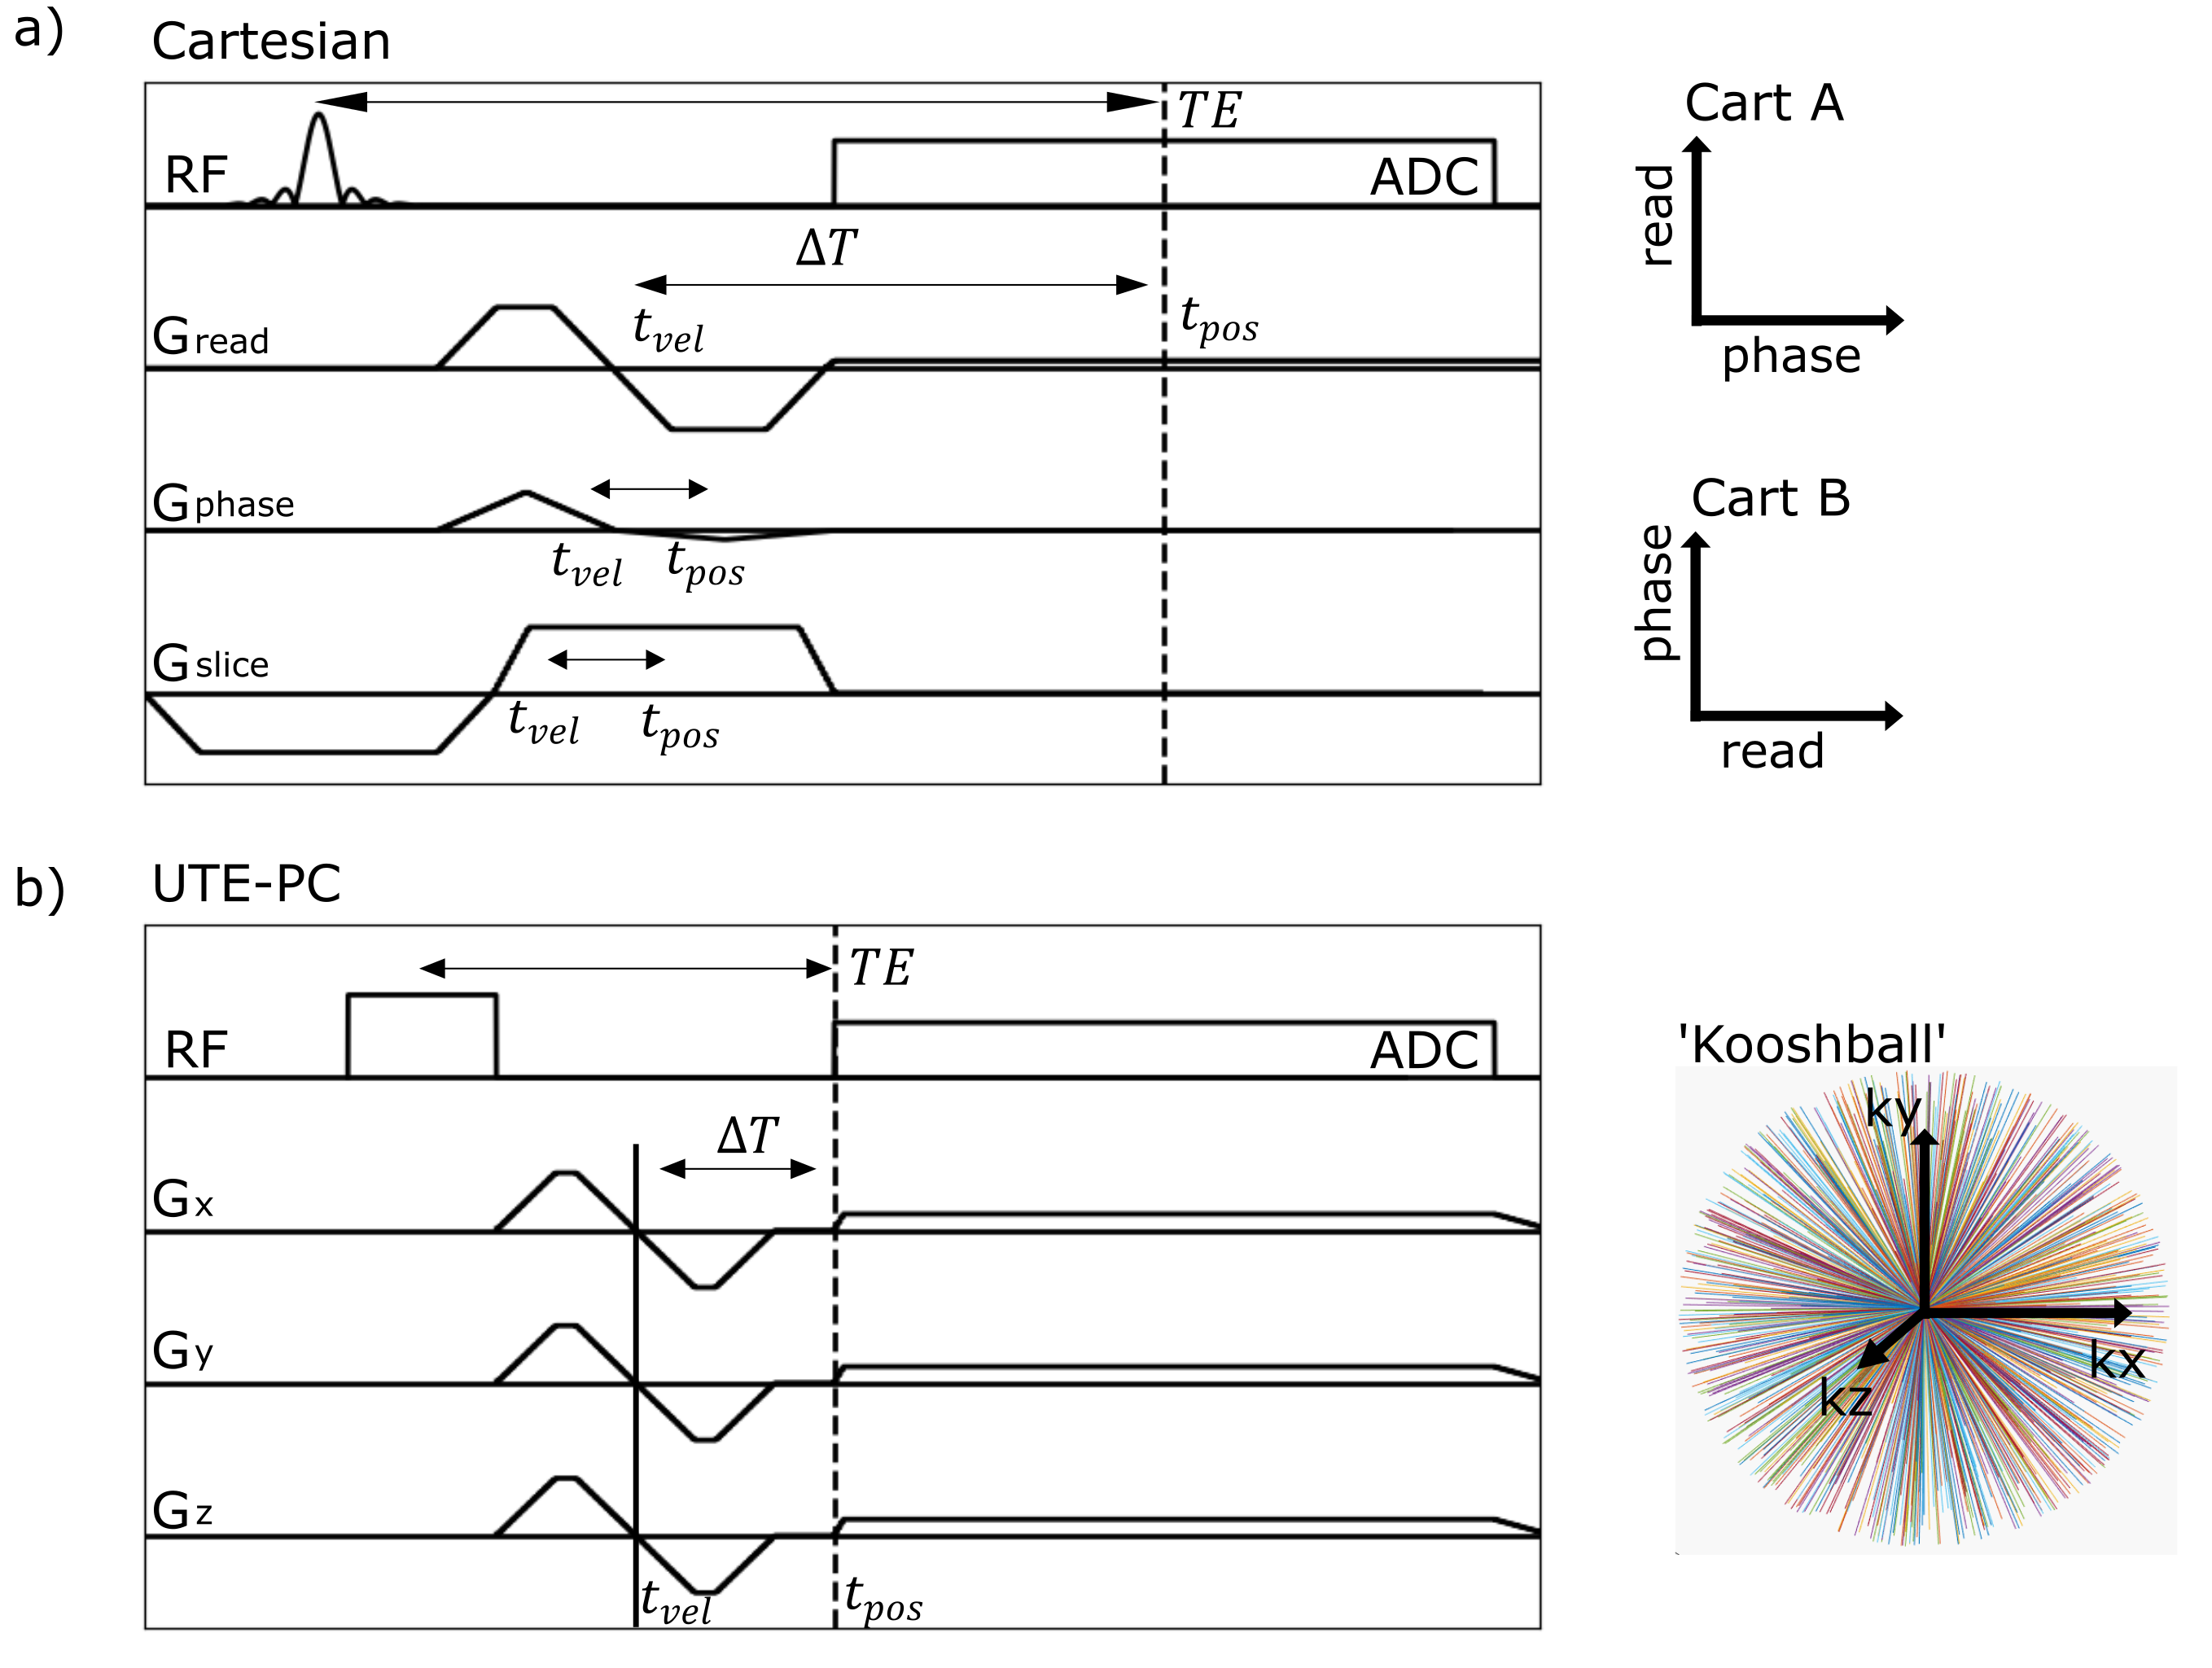
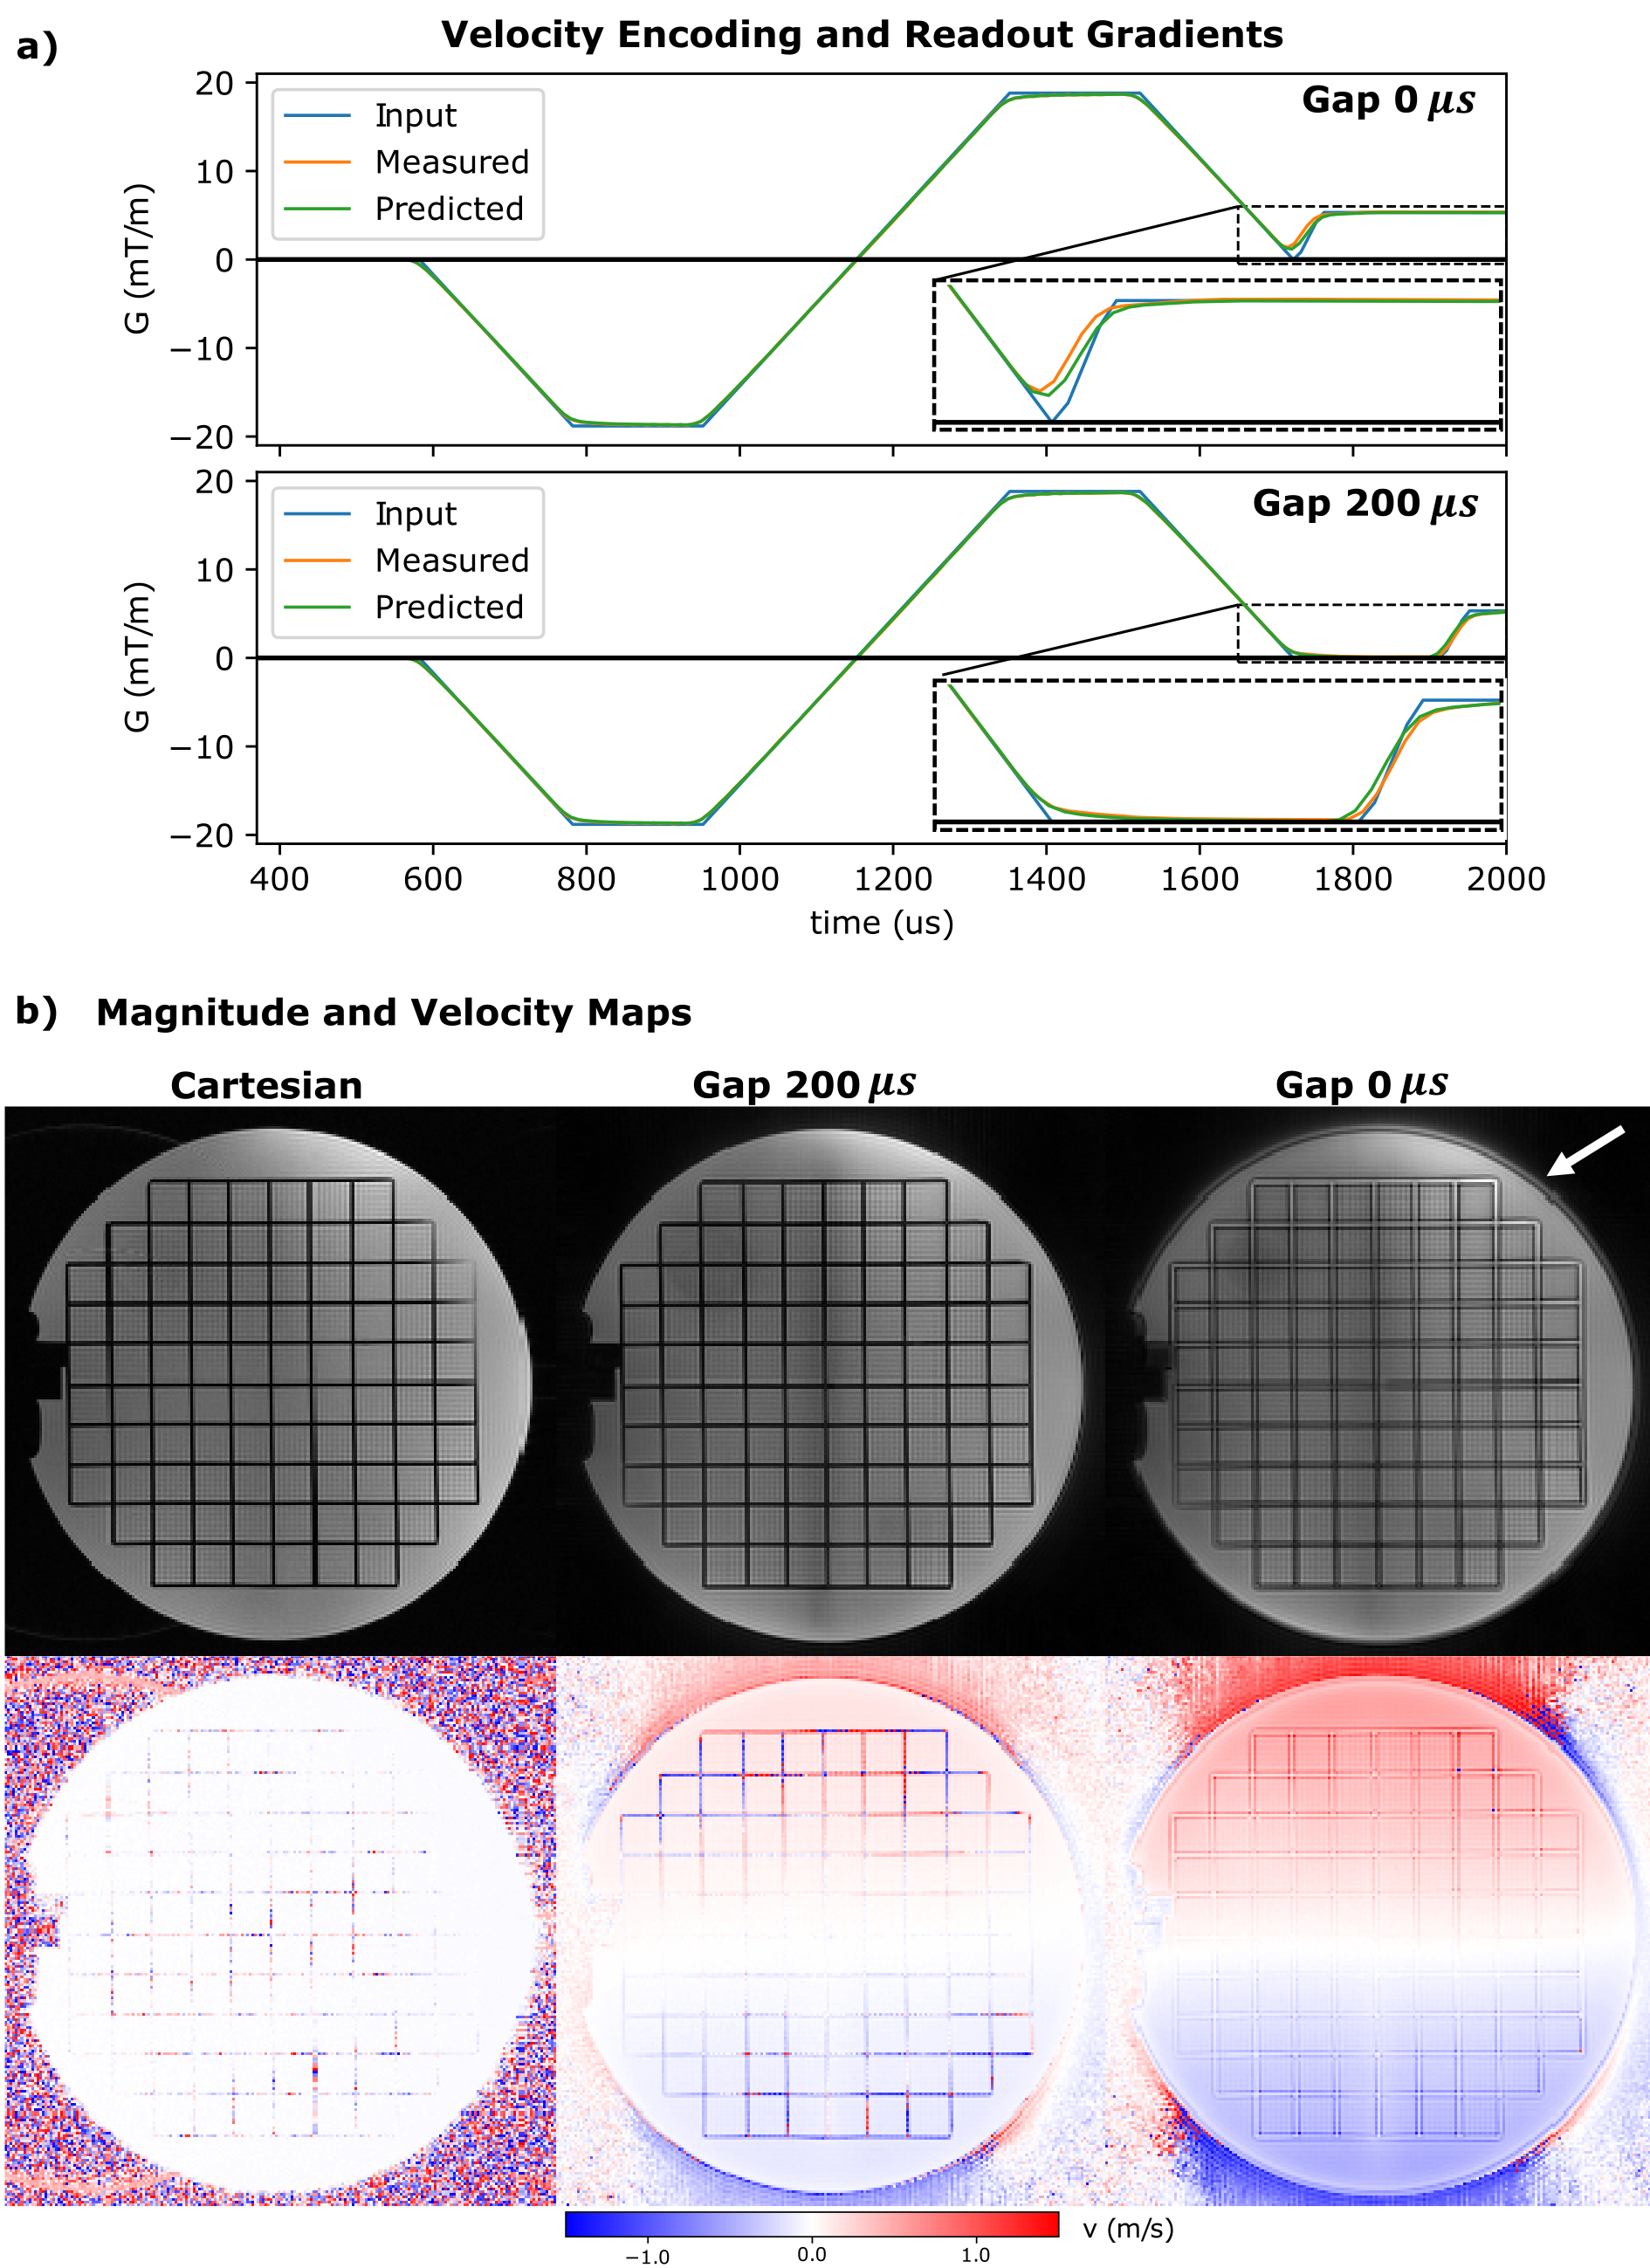
A non-zero $$$\Delta T$$$ yields displacement artifacts $$$\Delta d=v\cdot\Delta T$$$ of the moving spins that can shift magnetizations even outside of the vessel for high velocities10. Therefore, the time interval $$$\Delta T$$$ between the time of encoding the moving magnetization's velocity component and its spatial position should be minimized. Here, a center-out radial 3D UTE-PC sequence with a ‘kooshball’11 trajectory is adapted for velocity imaging (cf. Figure 1). Resulting displacement artifacts are compared to those generated by a Cartesian 4D flow sequence12 and a SYNC-SPI sequence5, that is regarded as reference. While $$$\Delta T$$$ vanishes for the SYNC -SPI and thus no displacement artifact occurs, $$$\Delta T$$$ of the Cartesian sequence depends on the readout/phase-encoding direction, resolution and other sequence parameters10.Since UTE sequences are known to be sensitive to gradient imperfections13, the gradient impulse response function (GIRF) was measured14 and used to predict the readout trajectory for the reconstruction. For comparison, the readout trajectory was also measured14 directly. To reduce eddy currents related artifacts, a gap of 200$$$µs$$$ was included between flow encoding and readout gradients. Initial measurements were performed using a static precision phantom with parameters listed in Table 1a) to evaluate the gap's impact on the image quality.
Subsequently, a flow phantom study was performed with a flow pump (CardioFlow 5000 MR, Shelley Medical Imaging Technologies, London, Canada) and a constant flow rate of 40 mL/s on a 3T MR system (Siemens Verio, Erlangen, Germany). The phantom10 represents an aortic arc with a stenosed section and is embedded in a body filled with agarose-gel (1.5% agarose). The Cartesian sequence was obtained twice with swapped readout/phase-encoding directions. All Parameters are given in Table 1b).
Data was reconstructed in Matlab R2017a (MathWorks, Natick, MA) using a non-uniform FFT.
Results
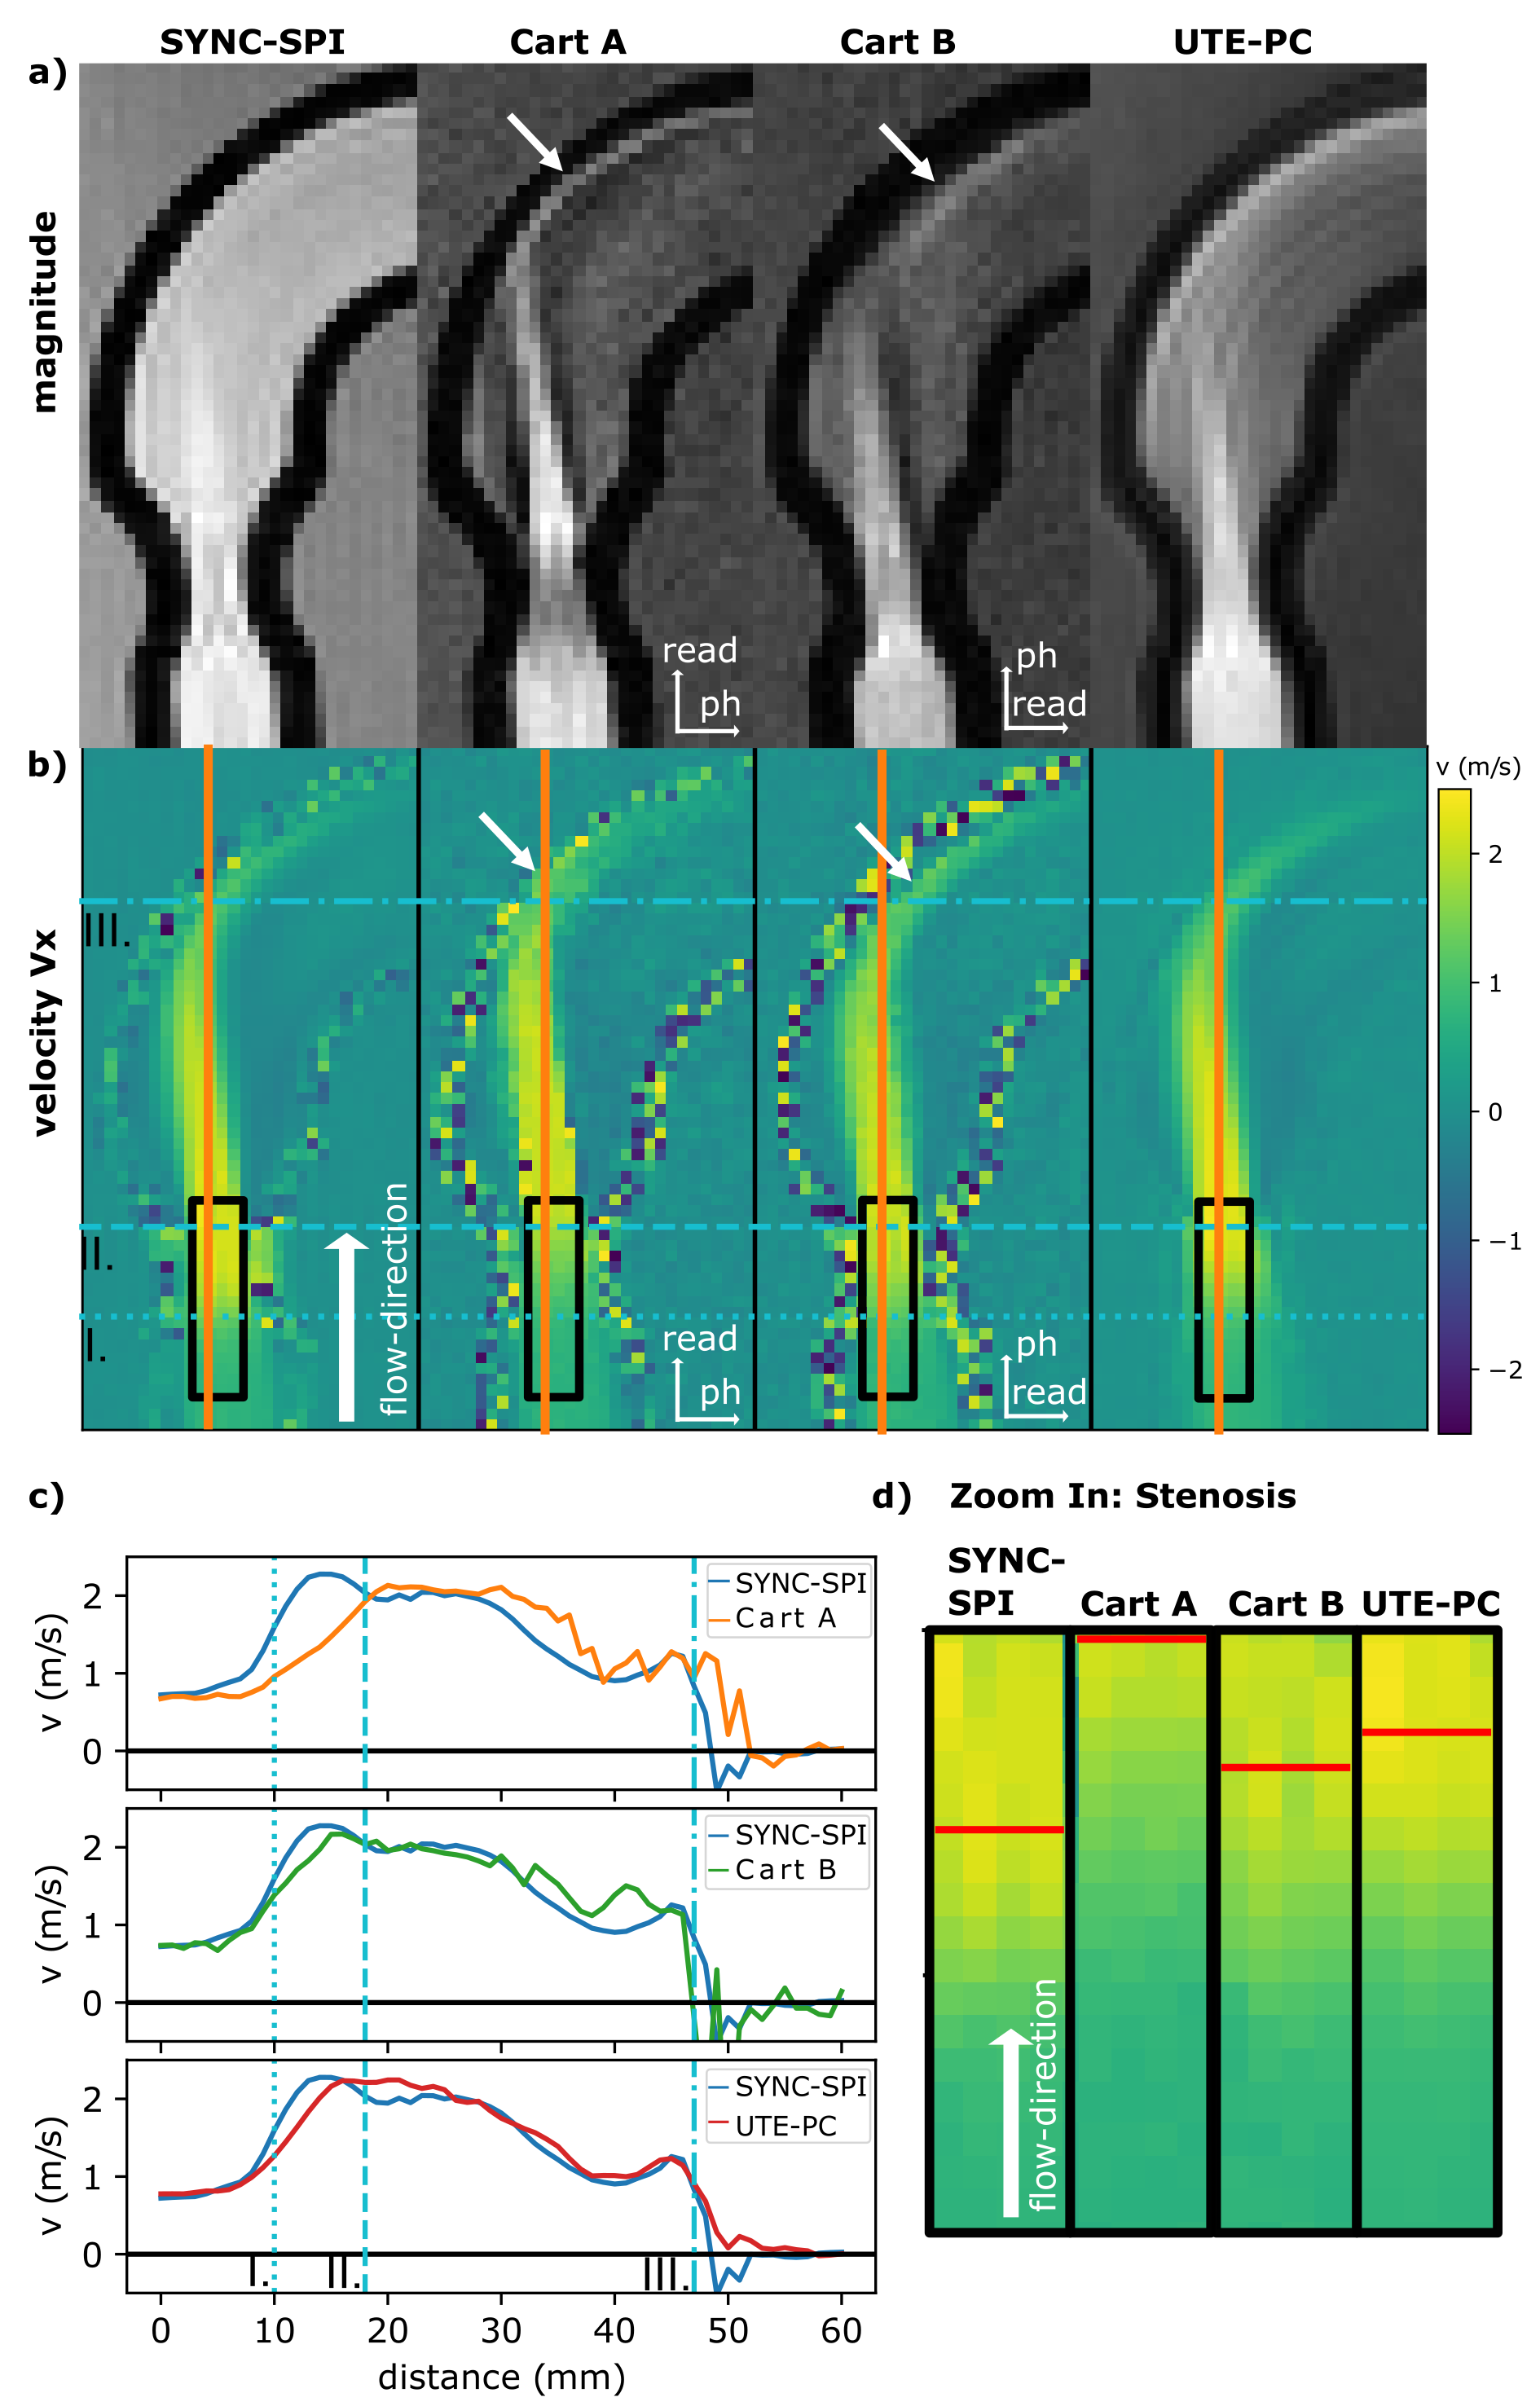
Nominal, measured, and predicted gradient waveforms are illustrated in Figure 2 for the UTE-PC sequence with/without a gap. The gapped sequence resulted in sharper magnitude images (Fig. 2b) in the precision phantom, comparable to the Cartesian case.Magnitude and phase data of the flow phantom scan (Fig. 3) reveal qualitatively the highest image quality and velocity accuracy for the SYNC-SPI: no geometric distortions of the phantom are observed, and the peak velocity is measured within the stenosis (Fig. 3a,b). The Cartesian sequence with readout (RO) along the stenosis reveals signal cancellations at the edges of the stenotic jet, and a shift of the peak velocity downstream. Distortions of the phantom are observed in the arch of the phantom, depending on the RO direction which is in line with previous results10. The UTE sequence shows, in contrast, qualitatively less signal cancellation and less geometric distortion in the magnitude image of the arch.
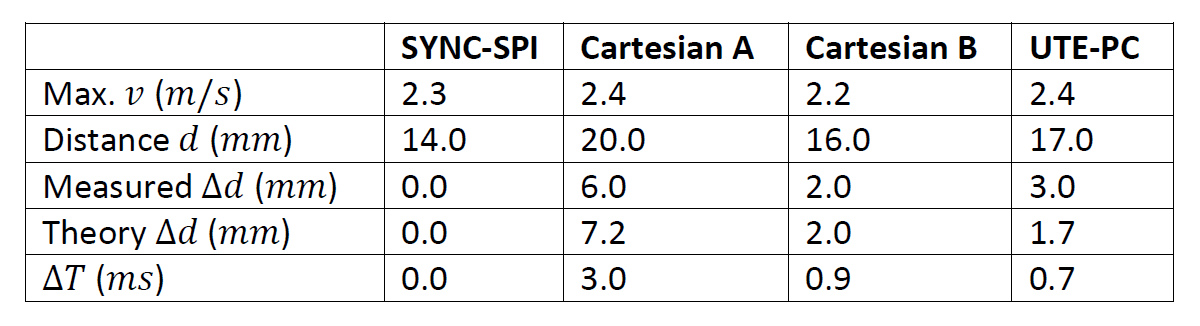
Quantitatively, the displacement artifact within the stenosis was measured for the Cartesian sequence to amount 6.0 $$$mm$$$ (RO along the stenosis) and 2.0 $$$mm$$$ (perpendicular to the stenosis), and to 3.0 $$$mm$$$ for UTE-PC. $$$\Delta T$$$ values were calculated based on parameters of the Cartesian sequence to 3.0 $$$ms$$$ (RO direction) and 0.9 $$$ms$$$ (PE direction), and for UTE-PC to 0.7 $$$ms$$$. This yields theoretical displacements of 7.1 $$$mm$$$ (Cartesian, RO along stenosis), 2.0 $$$mm$$$ (Cartesian, RO perpendicular stenosis), 1.7 $$$mm$$$ (UTE-PC), which agrees with the measured values (Table 2).
For the same resolution and 3D FOV, similar acquisition times (cf. Table 1a+b) are feasible as for the Cartesian case. However, the Cartesian 4D flow allows slab-selective excitations, which enabled a 5-6-fold faster acquisition in the flow phantom scan. Nevertheless, scan times are an order of magnitude faster as for the SYNC-SPI and the UTE acquisition could be further accelerated.
Discussion and Conclusion
This work demonstrates the successful reduction of displacement artifacts with an UTE-PC sequence. The sequence resulted in less and isotropic displacement artifacts compared to the Cartesian counterpart. UTE acquisitions are inherently prone to system imperfections. While these effects have been minimized by including a gap and predicting the trajectory, removing the gap will further reduce $$$\Delta T$$$ and, thus, the displacement artifact.Ultimately, this work will enable more accurate in-vitro measurements compared to 4D flow, e.g., to investigate turbulence, but still provide faster acquisitions as the reference, the SYNC-SPI.
Acknowledgements
We gratefully acknowledge funding from the German Research Foundation (GRK2260, BIOQIC).References
1. Demir A, Wiesemann S, Erley J, et al. Traveling Volunteers: A Multi-Vendor, Multi-Center Study on Reproducibility and Comparability of 4D Flow Derived Aortic Hemodynamics in Cardiovascular Magnetic Resonance. J Magn Reson Imaging. Published online 2021:1-12. doi:10.1002/jmri.27804
2. Markl M, Frydrychowicz A, Kozerke S, Hope M, Wieben O. 4D flow MRI. J Magn Reson Imaging. 2012;36(5):1015-1036. doi:10.1002/jmri.23632
3. Mandell JG, Loke YH, Mass PN, et al. Altered hemodynamics by 4D flow cardiovascular magnetic resonance predict exercise intolerance in repaired coarctation of the aorta: an in vitro study. J Cardiovasc Magn Reson. 2021;23(1). doi:10.1186/s12968-021-00796-3
4. Nishimura DG, Jackson JI, Pauly JM. On the nature and reduction of the displacement artifact in flow images. Magn Reson Med. 1991;22(2):481-492. doi:10.1002/mrm.1910220255
5. Bruschewski M, Kolkmannn H, John K, Grundmann S. Phase-contrast single-point imaging with synchronized encoding: a more reliable technique for in vitro flow quantification. Magn Reson Med. 2019;81(5):2937-2946. doi:10.1002/mrm.27604
6. Petersson S, Dyverfeldt P, Sigfridsson A, Lantz J, Carlhäll CJ, Ebbers T. Quantification of turbulence and velocity in stenotic flow using spiral three-dimensional phase-contrast MRI. Magn Reson Med. 2016;75(3):1249-1255. doi:10.1002/mrm.25698
7. Kadbi M, Negahdar MJ, Cha JW, et al. 4D UTE flow: A phase-contrast MRI technique for assessment and visualization of stenotic flows. Magn Reson Med. 2015;73(3):939-950. doi:10.1002/mrm.25188
8. Winter P, Andelovic K, Kampf T, et al. Fast self-navigated wall shear stress measurements in the murine aortic arch using radial 4D-phase contrast cardiovascular magnetic resonance at 17.6 T. J Cardiovasc Magn Reson. 2019;21(1):1-17. doi:10.1186/s12968-019-0566-z
9. Krämer M, Motaal AG, Herrmann KH, et al. Cardiac 4D phase-contrast CMR at 9.4 T using self-gated ultra-short echo time (UTE) imaging. J Cardiovasc Magn Reson. 2017;19(1). doi:10.1186/s12968-017-0351-9
10. Schmidt S, Flassbeck S, Schmelter S, Schmeyer E, Ladd ME, Schmitter S. The impact of 4D flow displacement artifacts on wall shear stress estimation. Magn Reson Med. 2021;85(6):3154-3168. doi:10.1002/mrm.28641
11. Nagel AM, Laun FB, Weber MA, Matthies C, Semmler W, Schad LR. Sodium MRI using a density-adapted 3D radial acquisition technique. Magn Reson Med. 2009;62(6):1565-1573. doi:10.1002/mrm.22157
12. Bernstein MA, Shimakawa A, Pelc NJ. Minimizing TE in moment‐nulled or flow‐encoded two‐and three‐dimensional gradient‐echo imaging. J Magn Reson Imaging. 1992;2(5):583-588. doi:10.1002/jmri.1880020517
13. Vannesjo SJ, Graedel NN, Kasper L, et al. Image reconstruction using a gradient impulse response model for trajectory prediction. Magn Reson Med. 2016;76(1):45-58. doi:10.1002/mrm.25841
14. Duyn JH, Yang Y, Frank JA, Van Der Veen JW. Simple Correction Method for K-Space Trajectory Deviations in MRI The New Method Measures the Actual k-Space Trajectories. Vol 132.; 1998.
Figures