1229
Reproducibility of aortic diameter and displacement derived from free-breathing 3D balanced steady-state free precession CINE images at 3T1Radiology and Nuclear Medicine, Amsterdam University Medical Centers, Amsterdam, Netherlands, 2Department of Medical Engineering & Physics, Amsterdam University Medical Centers, Amsterdam, Netherlands, 3University Medical Center Utrecht, Utrecht, Netherlands
Synopsis
Capturing 3D aortic motion over the heart cycle may give insight into a new biomarker for aortic disease and potentially improve the measurement of aortic hemodynamic parameters. An isotropic, free-breathing, respiratory-corrected 3D CINE balanced steady-state free precession imaging technique of the thoracic aorta was developed to investigate scan-rescan reproducibility of aortic diameter and displacement measures in nine healthy volunteers. Scan-rescan diameter was highly reproducible (CV<10% , ICC=0.85-0.86 and Pearson’s ρ=0.87) while displacement was more variable (CV=34-42%, ICC=0.34-0.50, ρ=0.59-0.72). These results are encouraging for future studies investigating aortic motion in health and aortopathy.
Introduction
The motion of the aorta over the cardiac cycle has not often been considered as a biomarker for aortic disease. However, it is possible that aortapathy is exacerbated by increased aortic resistance to heart motion (expressed as decreased aortic displacement over the cardiac cycle), for example in Marfan disease. Therefore, it is of interest to investigate whether the motion of the aorta over the cardiac cycle can be reliably quantified.CINE balanced steady-state free precession (bSSFP) provides excellent blood-tissue contrast to study motion of the heart and aorta, but is clinically acquired in multiple breath-holds and thick slices, hindering accurate quantification of 3D diameter and motion. Therefore, the aim of this study was to create an isotropic, free-breathing, respiratory-corrected 3D CINE bSSFP imaging technique of the thoracic aorta, and to investigate aortic scan-rescan reproducibility of diameter and displacement measurements.
Methods
Nine healthy control subjects (7 women, age 28 ± 3 years) were enrolled and underwent two MRI examinations separated by a break of 2-5 minutes that included repositioning and replanning. All 3D CINE bSSFP exams were performed during free breathing with PROspective Undersampling in multiple Dimensions1 (PROUD CINE) with an undersampling factor of R = 10 in a sagittal oblique orientation. MRI acquisitions used retrospective electrocardiogram (ECG) gating on an Ingenia 3T MRI scanner (Philips Healthcare, Best, Netherlands) using a 16-channel torso and 8 channel posterior coil. Pulse sequence parameters for the PROUD CINE scan were: field of view = 256 × 256 × 88 mm3; acquired/reconstructed spatial resolution = 1.6×1.6×1.6 mm3; temporal resolution ~67 msec (15 timeframes); TR/TR=3.4/1.7 msec; FA=30°; free-running acquisition time ~3 min:48 s.For respiratory correction of PROUD CINE, the k0,0 readout in the foot-head direction (sampled at ~3.9 Hz) was used to extract the respiratory self-gating signal2. K-space data were then re-sorted into a 5D dataset with 15 cardiac frames and 4 respiratory frames. Subsequently, a compressed sensing3,4 reconstruction of the data was applied using a sparsifying total variation operator along the cardiac and respiratory dimensions with regularization parameters $$$ \lambda_C=\lambda_R=0.1$$$ and number of iterations set to 205. To correct for respiratory motion, non-rigid registration6 of cardiac-averaged reconstructions to the end-expiration phase was performed. Each respiratory phase of the 5D set was then transformed to end-respiration using the displacement fields retrieved with the registration and the average over the respiratory dimension was used for further analysis. In post-processing, inspection was used to determine the last cardiac phase showing contraction, which was selected as the cardiac phase for the 3D end-systolic images. The diastolic images were systematically selected 5 cardiac phases later and both were manually segmented using Mimics v24 (Materialise, Leuven, Belgium).
The segmentations were transformed into surface objects in Matlab and the diameter was calculated per surface vertex as the length of the vector along the normal of the surface to the opposing side7. Aortic displacement was calculated following non-rigid registration of the systolic segmentation surface to the diastolic segmentation surface using an iterative closest point (ICP) method8. The distance between the registered and source surface vertices represents displacement, where source coordinate values were subtracted from registered coordinate values.
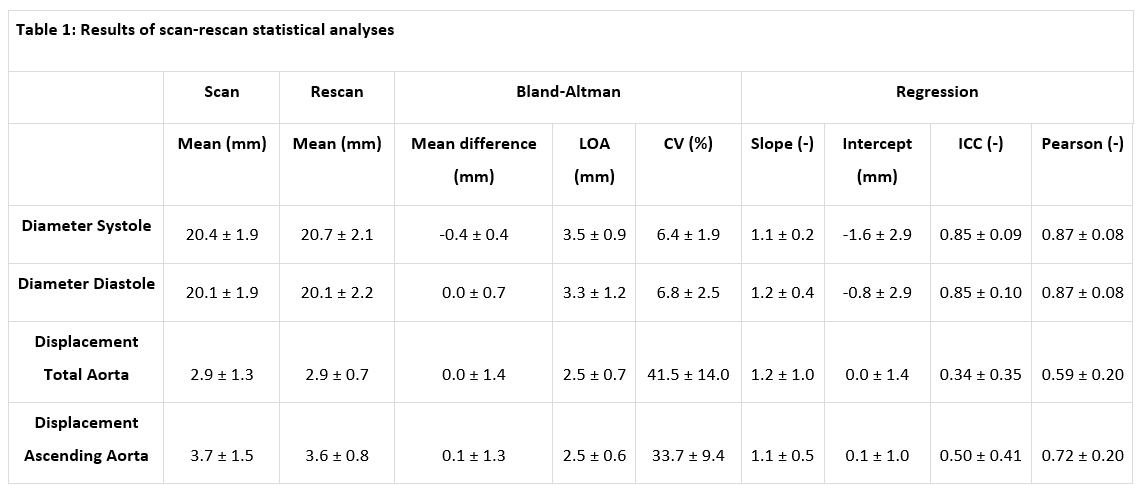
Diameter and displacement results are given as mean ± standard deviations. To quantify scan-rescan reproducibility of these metrics, the rescan data was rigidly registered and interpolated 8 to the scan data using FLIRT (FMRIB’s Linear Image Registration Tool9), after which voxel-by-voxel Bland-Altman (mean difference, limits of agreements (LoA) and coefficient of variation (CV)) and orthogonal regression (slope, intercept, Pearson’s ρ and intra-class correlation coefficient (ICC)) analysis were calculated per subject and subsequently averaged over the subjects. A sub-analysis for the ascending aorta was performed.
Results
Figure 1 shows the data acquisition and reconstruction pipeline and an example of healthy aortic motion. In Figure 2 segmentation contours are provided for systolic and diastolic scan and rescan aortic slices. Figure 3 displays the displacement calculation method and an example of an aortic 3D diameter and displacement map. Figure 4 shows an example of scan-rescan systolic and diastolic diameter and displacement maps as well as Bland-Altman and orthogonal regression plots. Table 1 provides the results of the voxel-by-voxel Bland-Altman and orthogonal regression analysis over all subjects.For all diameter and displacement measurements, the absolute mean differences were smaller than 0.5 mm with LoA=2.5-3.5 mm. The reproducibility for diameter measurements was good (CV<10% , ICC=0.85 and ρ=0.87) while the reproducibility for voxel-by-voxel displacement was poor (CV=42%, ICC=0.34, ρ=0.59). Displacement reproducibility was higher for the ascending aorta (CV=34%, ICC=0.50, ρ=0.72).
Discussion
Three-dimensional aortic diameter maps showed good reproducibility. For displacement, the result of ICP registration might be sensitive to small differences in segmentation, especially on a voxel-by-voxel basis. Comparison of initial segmentation differences with corresponding displacement map differences supports this suggestion, which was also reflected in the better agreement for the ascending aorta. Automatic machine learning segmentation may mitigate this problem after more data is acquired9.Conclusion
Systolic and diastolic segmentations of the aorta from high isotropic spatial resolution free-breathing, respiratory-corrected 3D CINE PROUD scans showed good reproducibility for diameter, while the moderate reproducibility of displacement metrics needs further investigation. This technique may be useful for future studies investigating aortic motion in health and disease.Acknowledgements
No acknowledgement found.References
1. Gottwald LM, Peper ES, Zhang Q, et al. Pseudo-spiral sampling and compressed sensing reconstruction provides flexibility of temporal resolution in accelerated aortic 4D flow MRI: A comparison with k-t principal component analysis. NMR in Biomedicine. 2020;33(4). doi:10.1002/nbm.4255
2. Pang J, Sharif B, Fan Z, et al. ECG and navigator-free four-dimensional whole-heart coronary MRA for simultaneous visualization of cardiac anatomy and function. Magnetic Resonance in Medicine. 2014;72(5):1208-1217. doi:10.1002/mrm.25450
3. Lustig M, Donoho D, Pauly JM. Sparse MRI: The application of compressed sensing for rapid MR imaging. Magnetic Resonance in Medicine. 2007;58(6):1182-1195. doi:10.1002/mrm.21391
4. Lustig M, Donoho DL, Santos JM, Pauly JM. Compressed sensing MRI: A look at how CS can improve on current imaging techniques. IEEE Signal Processing Magazine. 2008;25(2):72-82. doi:10.1109/MSP.2007.914728
5. Uecker M, Ong F, Tamir JI, et al. Berkeley Advanced Reconstruction Toolbox. Proc Intl Soc Mag Reson Med 23. Published online 2015. doi:10.5281/zenodo.12495
6. Vercauteren T, Pennec X, Perchant A, Ayache N. Diffeomorphic demons: efficient non-parametric image registration. NeuroImage. 2009;45(1 Suppl). doi:10.1016/j.neuroimage.2008.10.040
7. van Ooij P, Collins J, Fedak P, et al. 3D Linear Regression Analysis Reveals Relationships of 4D flow MRI-derived Aortic Dimensions with Age, Gender and Wall Shear Stress in Patients with Aortopathy. In: Proc. Intl. Soc. Mag. Reson. 25. ; 2017:0288.
8. van Ooij P, Powell AL, Potters W v., Carr JC, Markl M, Barker AAJ. Reproducibility and interobserver variability of systolic blood flow velocity and 3D wall shear stress derived from 4D flow MRI in the healthy aorta. Journal of Magnetic Resonance Imaging. 2016;43(1):236-248. doi:10.1002/jmri.24959
9. Berhane H, Scott M, Elbaz M, et al. Fully automated 3D aortic segmentation of 4D flow MRI for hemodynamic analysis using deep learning. Magnetic Resonance in Medicine. 2020;84(4):2204-2218. doi:10.1002/mrm.28257
Figures
Figure 1: Data acquisition and reconstruction pipeline
1. A free-running prospectively undersampling bSSFP acquires data in ~4 minutes.
2. From the k0,0 line, respiratory self-gating is performed and data are sorted into a 5D dataset with 15 cardiac and 4 respiratory phases. CS reconstruction uses total variation over cardiac and respiratory dimensions.
3. Images are averaged over the cardiac dimension, followed by 3D non-rigid registration to end-expiration (vector overlays). Respiratory displacements are then applied to the 5D images and data is respiratory-averaged.
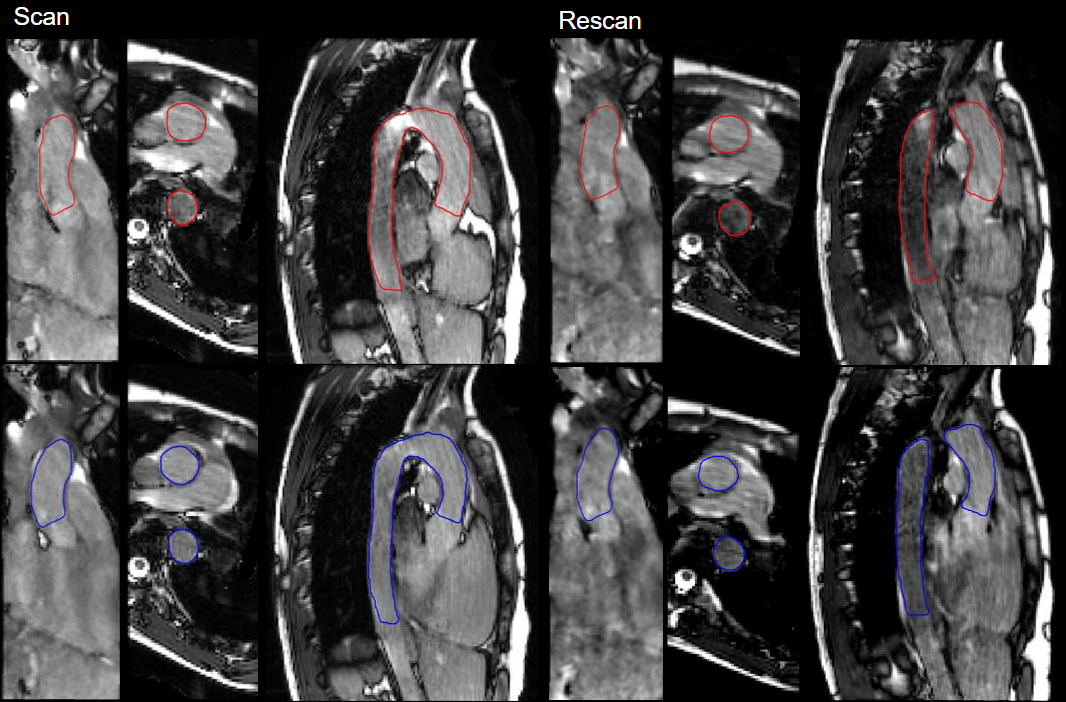
Figure 2: Reconstruction of PROUD CINE with segmentation contour of diastolic (blue) and end-systolic phase (red) of the scan and rescan in one volunteer in coronal, axial and sagittal view.
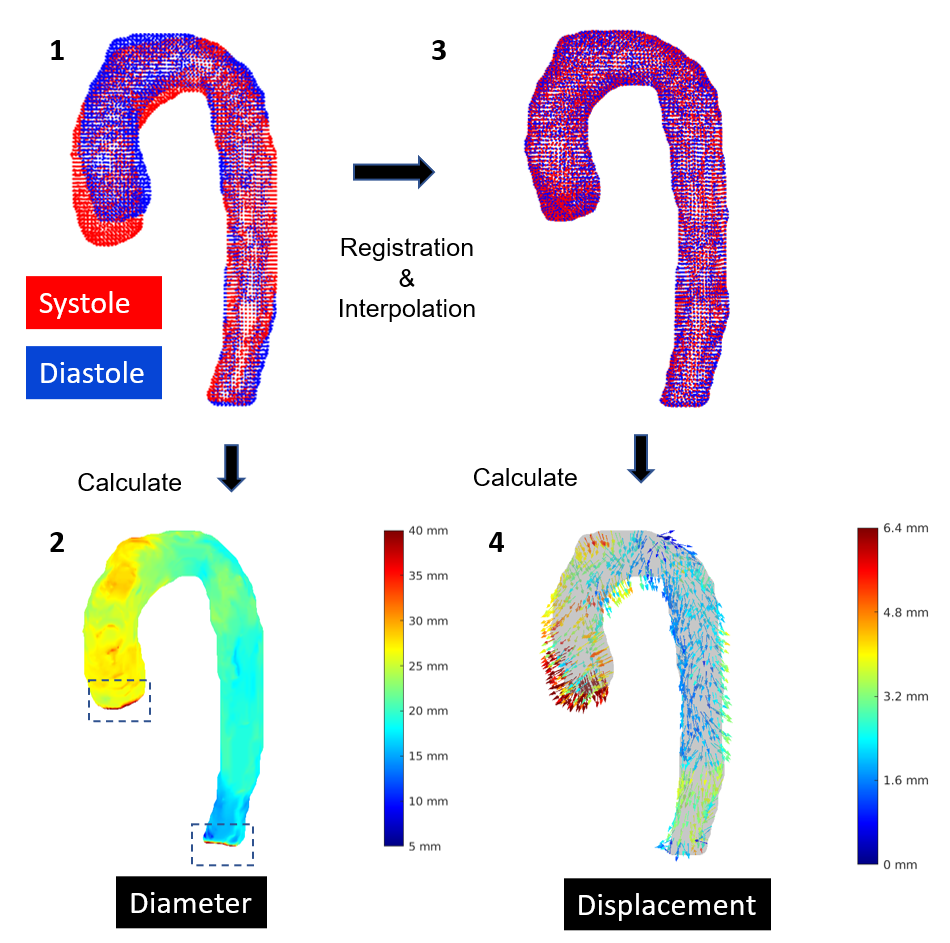
Figure 3: Post processing pipeline
1. The systolic and diastolic aorta segmentations are transformed to a surface in Matlab.
2. For each surface vertex the diameter is calculated. For the final analysis a fixed extend of the surfaces are discarded to remove erroneous diameter calculations from face-end vertices.
3. The systolic surface is non-rigidly registered to the diastolic surface using iterative closest point method and diameter values interpolated.6
4. Displacement is calculated by subtracting the old systolic vertex coordinates from the new vertex coordinates.
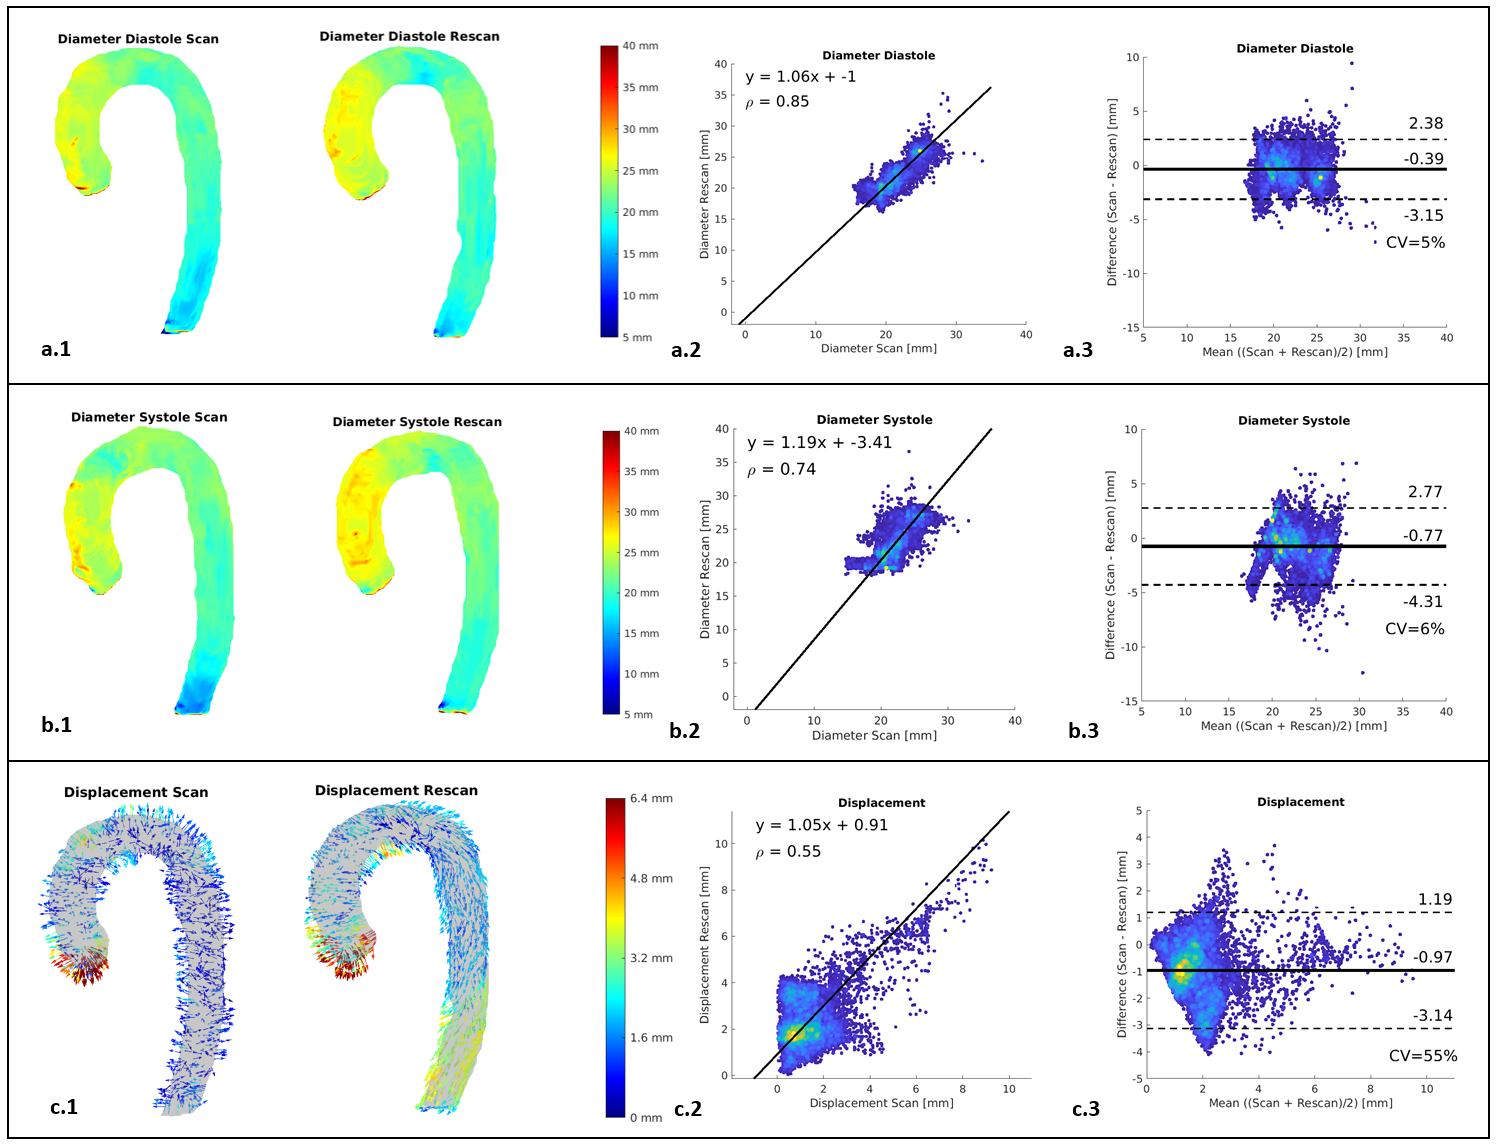
Figure 4: Scan-rescan diameter and displacement analysis in one volunteer of diastolic diameter (a) systolic diameter (b) and displacement (c). 1: The 3D diameter and displacement fields used for the voxel-by-voxel analysis. 2: voxel-by-voxel analysis: Bland-Altman comparison, 3: orthogonal regression.