1228
Wall shear stress in abdominal aortic aneurysms: a 4D Flow MRI case-control study1Department of Health, Medicine and Caring Sciences, Linköping University, Linköping, Sweden, 2Center for Medical Image Science and Visualization (CMIV), Linköping University, Linköping, Sweden, 3Department of Cardiology, Linköping University Hospital, Linköping, Sweden
Synopsis
Current guidelines for risk stratification of abdominal aortic aneurysm are based on vessel diameter and are not sufficient to prevent catastrophic events. Wall shear stress based parameters (WSS, OSI and RRT) are potential markers for AAA altered hemodynamics. Here, WSS vectors were computed from 4D flow MRI in the whole aorta of patients with AAA, age-matched elderly controls, and young normal controls. The aorta was divided in five segments and average values were computed in each segment. AAA had lower WSS and higher RRT in the IAA compared to proximal segments and to the age-matched controls, but not higher OSI.
Background
Abdominal aortic aneurysm (AAA) is an asymptomatic disease, that can lead to dissection or rupture. Current guidelines for risk stratification are based on diameter, but size alone is insufficient to prevent catastrophic events. In addition to rupture risk, AAA significantly increases the risk of other cardiovascular events and is an expression of general aortic disease1. Low wall shear stress (WSS), high oscillatory shear index (OSI), and high relative residence time (RRT) have been correlated with increased uptake of inflammatory markers and increased oxidative activities in the vessel wall. These WSS-based parameters may improve risk stratification of AAA. Nevertheless, previous studies of WSS and OSI in patients with AAA are limited to a small number of subjects. No study has compared WSS between AAA patients and controls, and the role of RRT has been explored only in animal studies2,3. We set out to comprehensively explore WSS, OSI, and RRT in the whole aorta in patients with AAA, age-matched elderly controls (EC) and young normal controls (YC). Comparisons were made to assess the effects of disease (AAA vs EC) and normal ageing (YC vs EC). Further, to explore the association between AAA and hemodynamics in thoracic aorta, we included the entire aorta in the analysis.Methods
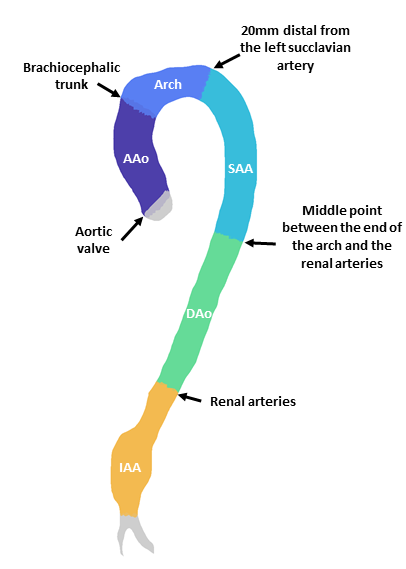
4D Flow magnetic resonance images (MRI) of the whole aorta were acquired with 3T Philips Ingenia scanner (Philips Healthcare, Best, the Netherlands) in 18 AAA patients (age 70.8±3.4), 23 age-matched controls (age 71.2±3.4), and 23 young normal controls (age 23.3±3.1), all males. 3D peak systolic segmentations of the whole aorta were created with a semi-automatic method. Time-resolved segmentations were generated by registering the 3D segmentation to every other timeframe in the 4D Flow MRI data with a non-rigid registration method based on the Morphon algorithm4. WSS vectors at each timeframe were computed using the method of Potters et al5.The aorta was divided into five segments: ascending aorta (AAo), arch, descending aorta (DAo), suprarenal and infrarenal abdominal aorta (SAA and IAA) (Figure 1). For each segment, average values of peak WSS, TAWSS, OSI, and RRT were computed. Further, peak velocity and maximum diameter normalized by body surface area (BSA) were also included. Student’s t-tests were used to compare values between the three cohorts where the data were normally distributed, and the non-parametric Wilcoxon rank sum tests were used otherwise.Results
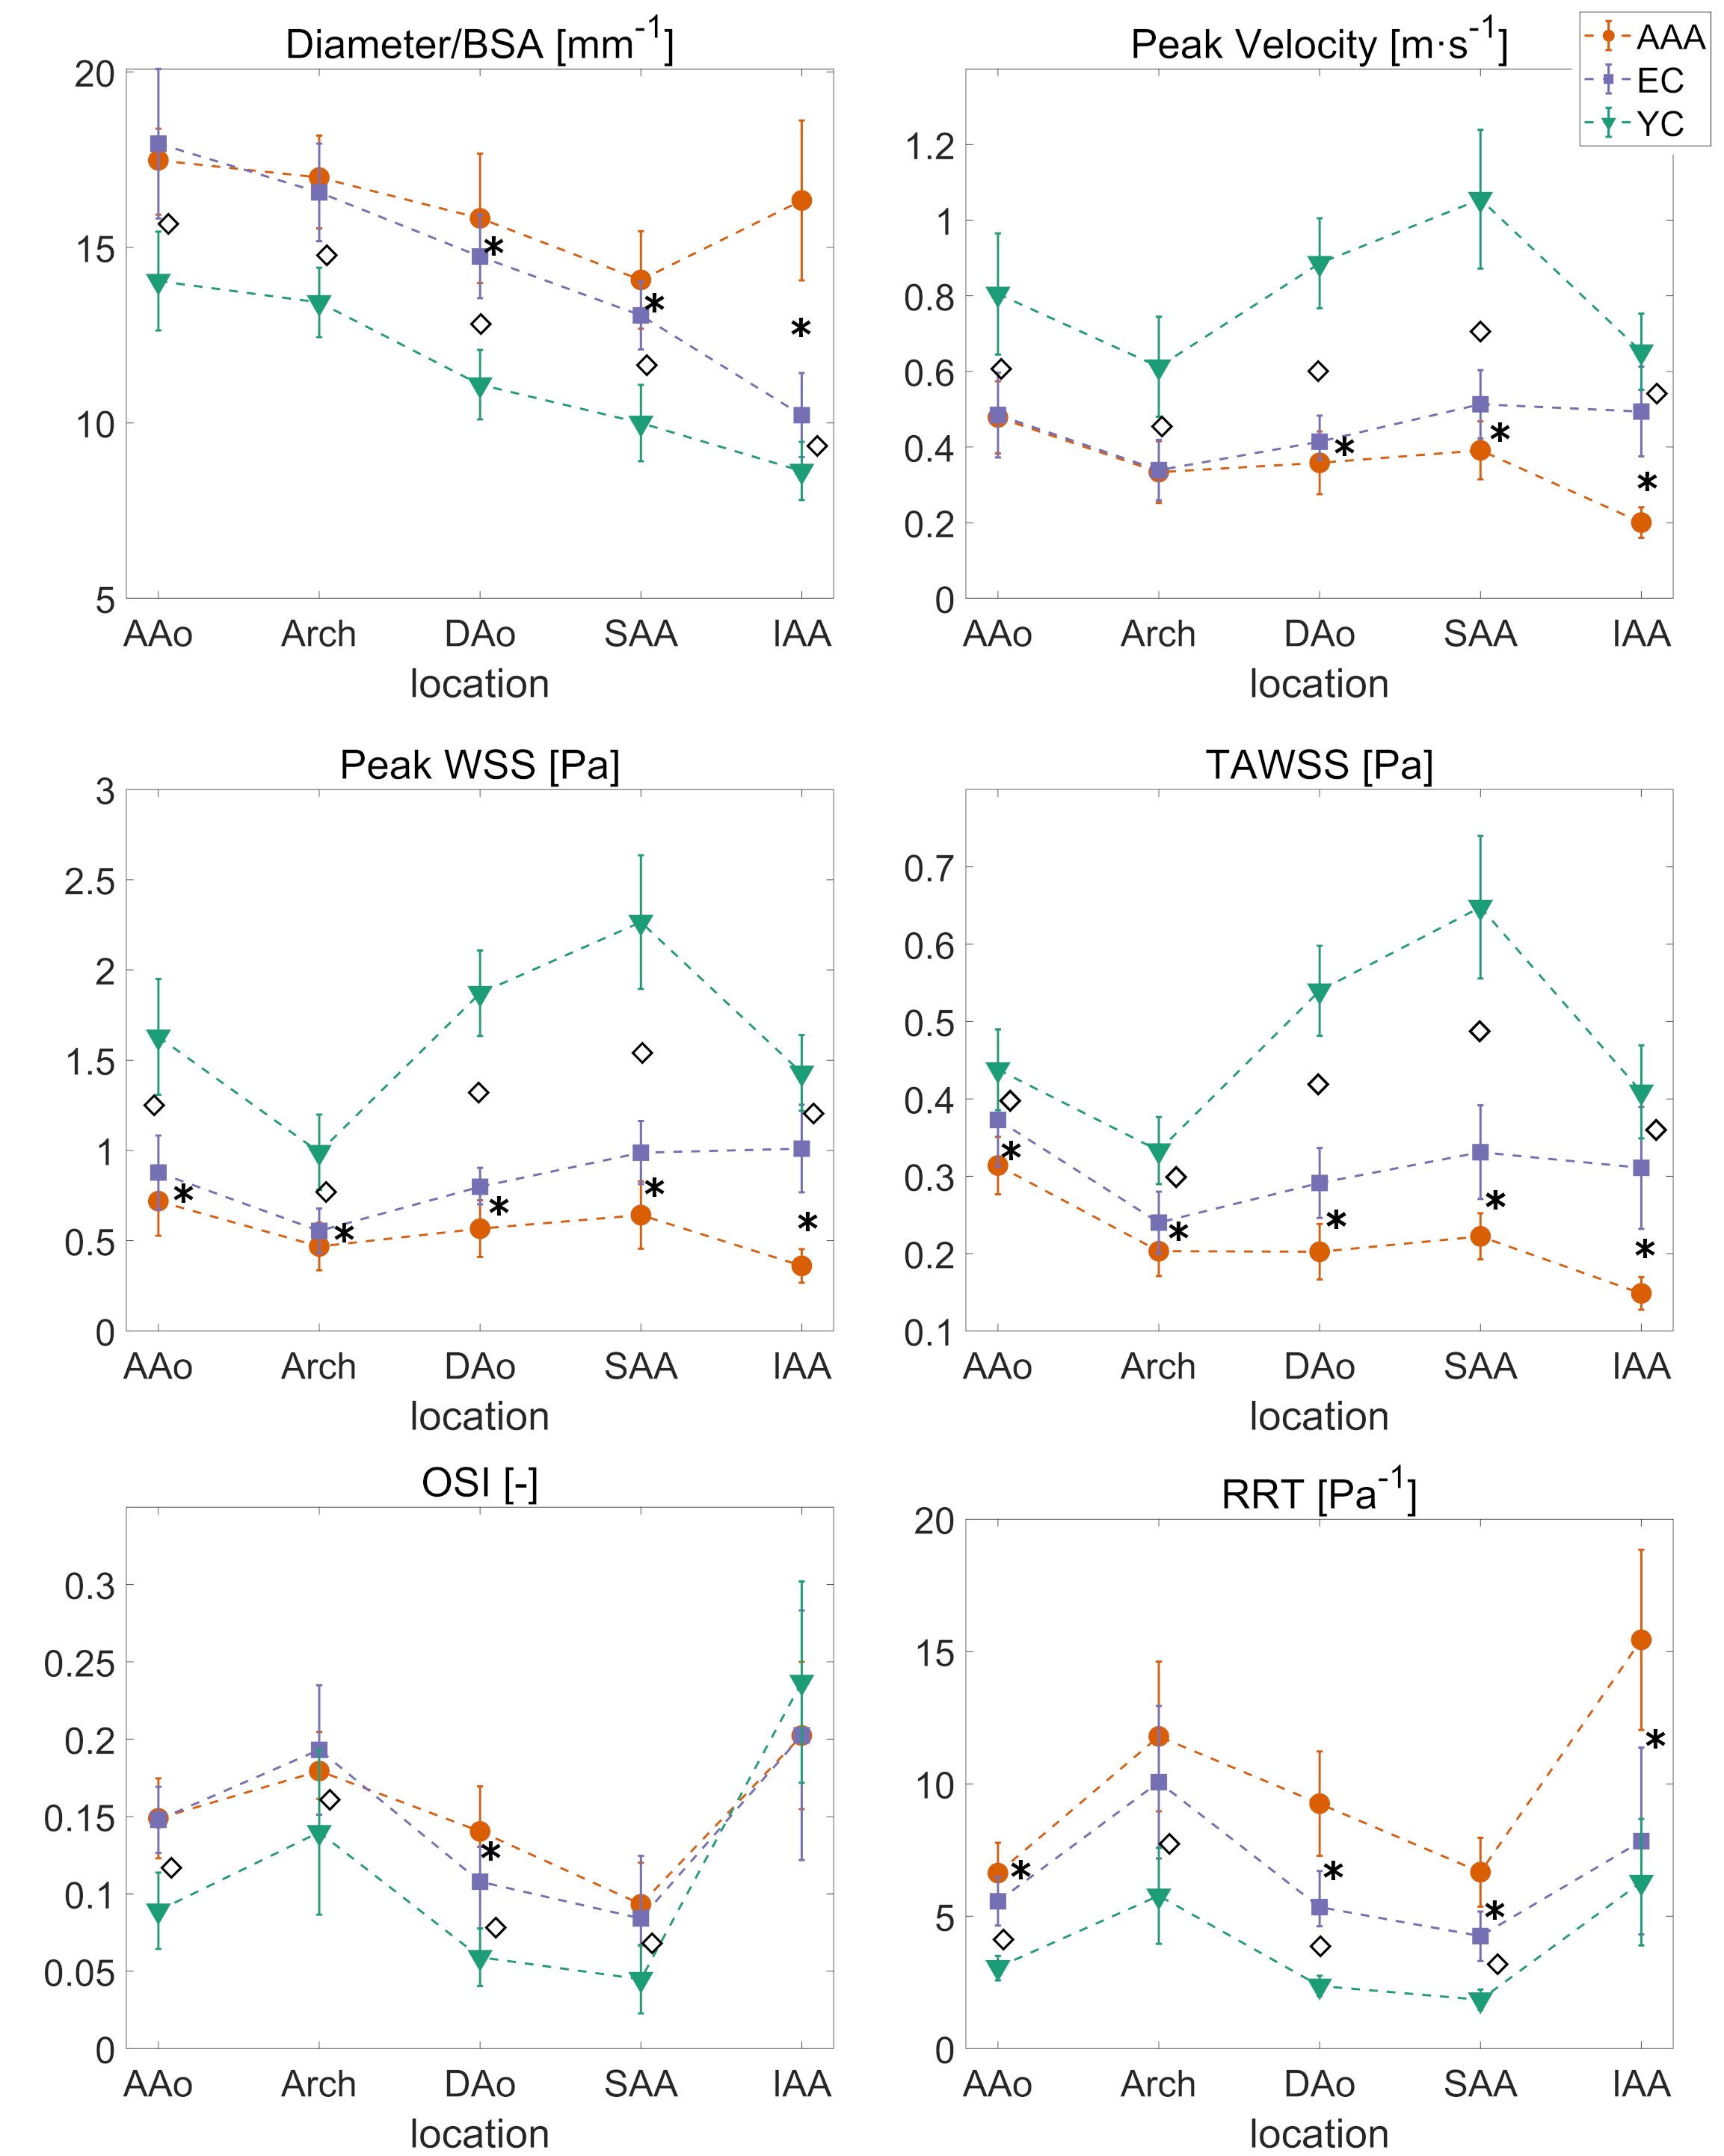
For each segment, average values of normalized diameter, peak velocity, peak WSS, TAWSS, OSI, and RRT are reported for the three cohorts in Figure 2. AAA patients had lower peak WSS and TAWSS in the entire aorta compared to elderly controls (p ≤ 0.05), similar OSI, but higher RRT in the ascending, descending and abdominal aorta (p ≤ 0.05). Elderly controls had lower peak WSS compared to young controls throughout the aorta (p < 0.0001), higher OSI in all segments, except for the infrarenal aorta (p < 0.0001), and higher RRT throughout the aorta (p < 0.05).Discussion
While elderly controls experience similar peak systolic WSS and TAWSS in the suprarenal and infrarenal abdominal aorta, in the infrarenal aorta both peak WSS and TAWSS are more than halved compared to proximal aorta for AAA patients, which is probably due to pathological expansion of the vessel that leads to reduced velocities, as reported in a previous study3. Interestingly, it seems that AAA patients have altered hemodynamics not only in the infrarenal aorta, but also in proximal segments. Moreover, the infrarenal aorta seems to be the segment least affected by ageing. Indeed, ageing leads to deterioration of the elastic lamina, more prominent in the thoracic aorta. Thus, reduction in velocity and shear stress, and increase in OSI and RRT with age, may be explained by age-related change in aortic morphology, namely increased diameter and vessel tortuosity with age. RRT is almost doubled in AAA compared to elderly controls, while more unexpectedly, there was no difference in OSI for infrarenal aorta between the three cohorts. As suggested previously2, OSI alone may not be a suitable index for describing recirculation zones in pulsatile flows, because of its insensitivity to shear magnitude. Reverse flow in the proximity of the iliac bifurcation may be a confounding factor for the use of OSI as a hemodynamic marker in AAA.Conclusion
This study provides novel insights into WSS, OSI, and RRT in patients with AAA in relation to normal ageing, highlighting how AAA patients have markedly abnormal hemodynamics stresses not only in the infrarenal, but the entire aorta. Moreover, we identified RRT as a marker of abnormal AAA hemodynamics. The combination of low velocities and oscillatory flow, resulting in elevated RRT, in the aneurysm may promote macromolecular uptake by the vessel wall, but also deployment of fibrinogen, circulating cellular elements, such as leukocytes, platelets, and red blood cells in the intra-lumen thrombus (ILT). Inflammatory markers aggregating in ILT are transported outwards to the wall and contribute to ECM degradation2,6. RRT could be a potential marker to locate dangerous sites for rupture also at the ILT surface. Further investigations are needed to explore if RRT or other measures of hemodynamics stress best predict AAA growth, rupture or ILT deposition.Acknowledgements
No acknowledgement found.References
1. Bath MF, Saratzis A, Saedon M, Sidloff D, Sayers R, Bown MJ, et al. Patients with Small Abdominal Aortic Aneurysm are at Significant Risk of Cardiovascular Events and this Risk is not Addressed Sufficiently. Eur J Vasc Endovasc Surg. 2017 Feb;53(2):255–60.
2. Himburg HA, Grzybowski DM, Hazel AL, LaMack JA, Li X-M, Friedman MH. Spatial comparison between wall shear stress measures and porcine arterial endothelial permeability. Am J Physiol-Heart Circ Physiol. 2004 May 1;286(5):H1916–22.
3.Takehara Y, Isoda H, Takahashi M, Unno N, Shiiya N, Ushio T, et al. Abnormal Flow Dynamics Result in Low Wall Shear Stress and High Oscillatory Shear Index in Abdominal Aortic Dilatation: Initial in vivo Assessment with 4D-flow MRI. Magn Reson Med Sci. 2020 Jul 13;19(3):235–46.
4. Bustamante M, Gupta V, Carlhäll C-J, Ebbers T. Improving visualization of 4D flow cardiovascular magnetic resonance with four-dimensional angiographic data: generation of a 4D phase-contrast magnetic resonance CardioAngiography (4D PC-MRCA). J Cardiovasc Magn Reson. 2017 Jun 23;19(1):47.
5. Potters WV, van Ooij P, Marquering H, vanBavel E, Nederveen AJ. Volumetric arterial wall shear stress calculation based on cine phase contrast MRI: Volumetric Wall Shear Stress Calculation. J Magn Reson Imaging. 2015 Feb;41(2):505–16.
6. Sakalihasan N,
Michel J-B, Katsargyris A, Kuivaniemi H, Defraigne J-O, Nchimi A, et al.
Abdominal aortic aneurysms. Nat Rev Dis Primer. 2018 Dec;4(1):34.
Figures