1222
Oxygen Extraction Fraction is higher in elderly participants with a higher cardiovascular disease risk; a combined QSM and ASL study1Division of Neuroscience and Experimental Psychology, University of Manchester, Manchester, United Kingdom, 2Division of Informatics, Imaging and Data Science, University of Manchester, Manchester, United Kingdom, 3Geoffrey Jefferson Brain Research Centre, Manchester Academic Health Science Centre, Manchester, United Kingdom, 4Greater Manchester Mental Health NHS Foundation Trust, Manchester, United Kingdom, 5University Hospital of Morecambe Bay NHS Foundation Trust, Lancaster, United Kingdom, 6Centre for Medical Image Computing, University College London, London, United Kingdom, 7Bioxydyn Limited, Manchester, United Kingdom, 8Lancaster Medical School, Lancaster University, Lancaster, United Kingdom, 9Department of Neurology, Lancashire Teaching Hospitals NHS Foundation Trust, Preston, United Kingdom, 10GE Healthcare, Manchester, United Kingdom
Synopsis
We investigated quantitative susceptibility mapping (QSM) and arterial spin labelling (ASL) to measure cerebrovascular parameters in elderly people with a range of vascular disease risk (QRisk) and cognitive impairment. Cerebral blood flow (CBF) and arterial transit time (ATT) were derived from ASL and oxygen extraction fraction (OEF) from QSM. Regional estimates were obtained by matching six large veins to their draining territories. QRisk had a significant positive relationship with ATT. OEF had a significant compensatory increase with altered ATT and CBF. Both OEF and ATT were found to be elevated with impaired cognition.
Introduction
Cerebrovascular disease is an important contributor to dementia. Oxygen extraction fraction (OEF), cerebral blood flow (CBF), oxygen metabolism (CMRO2), and arterial transit time (ATT) were measured using MRI in volunteers with a range of vascular disease risk (characterised by QRisk2 score) and cognitive impairment (characterised by Montreal Cognitive Assessment score) to determine if a) vascular disease risk was associated with altered vascular imaging parameters, b) if OEF was increased in association with impaired blood supply and increased transit times, and c) if cognitive impairment was associated with compensatory changes in CMRO2, ATT, OEF, or CBF. We used Arterial Spin Labelling (ASL) to estimate CBF and ATT, and Quantitative Susceptibility Mapping (QSM) to estimate OEF from six veins in elderly subjects. We collected [18F]flutemetamol PET to determine amyloid status of each participant and so account for the contribution of amyloid positivity to cognitive impairment.Methods
Twenty-four volunteers (age 69.5 ± 5.3 years; 14 female) with a range of vascular risk factors (QRisk2 18.7 ± 10.8 %) and cognitive impairment (MoCA 26.7 ± 3.4) were recruited.MRI was performed using a 3T scanner (Signa PET/MR, GE Healthcare, Milwaukee, WI) and 32-channel head coil (Nova Medical, Wilmington, MA). QSM used a sagittal flow compensated 3D gradient multi-echo sequence: 1 mm isotropic voxels, 8 TEs (3 to 16.5 ms), TR 22.7 ms, flip angle 15°, ASSET acceleration (factor = 2, phase encoding direction) and bipolar echo collection. Multi-delay ASL with pCASL labelling, 3D spiral FSE read-out, 6 PLDs (700 to 2458 ms) and variable label duration (573-2042 ms) was collected with voxel size 1.7x1.7x4 mm. A T1w MP-RAGE image was collected with 1 mm isotropic resolution. Arterial blood saturation was estimated by sampling end-tidal O2 using a nasal cannula. A blood sample was collected to measure haematocrit (Hct).
Susceptibility maps were calculated from the real and imaginary 3D gradient-echo images as described in Mc Fadden et al1. Six veins (SS - Straight Sinus, ICVs – Internal Cerebral Veins, SSS || - Superior Sagittal Sinus (parallel to B0), SSS ꓕ - Superior Sagittal Sinus (perpendicular to B0), BVs – Basal Veins, TS – Tentorial Sinuses) were delineated using MRIcron (v6.6, https://people.cas.sc.edu/rorden/mricron/index.html). The 90th percentile susceptibility value was used to calculate the venous oxygen saturation and then OEF in each region.
CBF and ATT maps were calculated following recommendations of the ASL white paper2 using a single blood compartment model with fixed parameters T1_blood =1.65 s, labelling efficiency=0.85, blood-brain partition coefficient=0.9 and voxel-wise M0 calibration, fitting for both CBF and ATT.
Median CBF and ATT values were extracted from the vascular territory of the selected veins through co-registration (using FSL FLIRT) with the T1w images which were segmented using Freesurfer v6.0.03.
CMRO2 was calculated using:
$$CMRO_{2} = CBF \cdot [O_{2}]_{a}\cdot OEF$$
where [O2]a is the concentration of oxygen within arterial blood, calculated from Hct. Statistical analyses were conducted using R 3.6.0 (R Core Team, 2019). Three modelling strategies were used; for aims a) and b), linear mixed models and type III ANOVAs were used for each imaging parameter with subject as a random effect. For c) we averaged the regional values of the imaging parameters to give a global estimate. A linear model was constructed with MoCA score as the dependent variable and analysed using a type II ANOVA.
Results
ATT rose significantly by 85 ms per 10 point increase in QRisk (Table 1) with a trend for CBF to decline by 1.6 ml/min/100 ml for the same increase in QRisk. There was a significant interaction between amyloid status and QRisk for OEF, with amyloid positivity associated with a stronger association between OEF and QRisk. There was a trend for OEF to be lower in those with amyloid positivity, and for the relationship between OEF and QRisk to vary across regions.OEF rose significantly by 5% for a decrease in CBF of 21.6 ml/min/100 ml or a rise in ATT of 432.0 ms (Table 2), with a trend for that relationship to vary by region (p = 0.084).
OEF and ATT increased with cognitive impairment (a rise of 16.8% in OEF and 703.2 ms in ATT for a 5 point reduction in MoCA score). Amyloid status was significantly associated with MoCA except for the ATT model, where a trend was observed.
Discussion
The significant relationship between ATT and QRisk, and trend between CBF and QRisk, are possibly due to increased cerebrovascular disease causing blockages and narrowing of blood vessels with all regions affected, though dysfunction further upstream (e.g. reduced cardiac output) could be contributing. The alterations in these two parameters with OEF confirm that oxygen extraction varies with cerebrovascular dysfunction. The links between OEF, ATT, and cognition suggests that the ability to compensate for reduced oxygen delivery with elevated OEF is insufficient to maintain cognitive function. CMRO2 however, did not decline with QRisk and was not directly associated with MoCA. This may be because we are measuring CMRO2 at rest when the deficiencies in oxygen supply are not apparent and metabolic demand can be met.Acknowledgements
Thanks to GE Healthcare for use of the multi-delay ASL sequence. This work was supported by GE Healthcare and EPSRC grant EP/M005909/1. Furthermore, we wish to thanks: John Cain; Jose Anton-Rodriguez; Will Lloyd; Amy Watkins, Ioannis Vamvakas, and other radiographers at the University of Manchester PET-MR suite; Sarah Woods; Mike Green, Jonathon Lowe, and the operational staff of the Wolfson Molecular Imaging Centre.
References
1. McFadden JJ, Matthews JC, Scott LA, Parker GJM, Lohézic M, Parkes LM. Optimization of quantitative susceptibility mapping for regional estimation of oxygen extraction fraction in the brain. Magn Reson Med. 2021.
2. Alsop DC, Detre JA, Golay X, et al. Recommended implementation of arterial spin‐labeled perfusion MRI for clinical applications: a consensus of the ISMRM perfusion study group and the European consortium for ASL in dementia. Magn Reson Med. 2015;73(1):102-116.
3. Fischl B. FreeSurfer. Neuroimage. 2012;62(2):774-781.
Figures
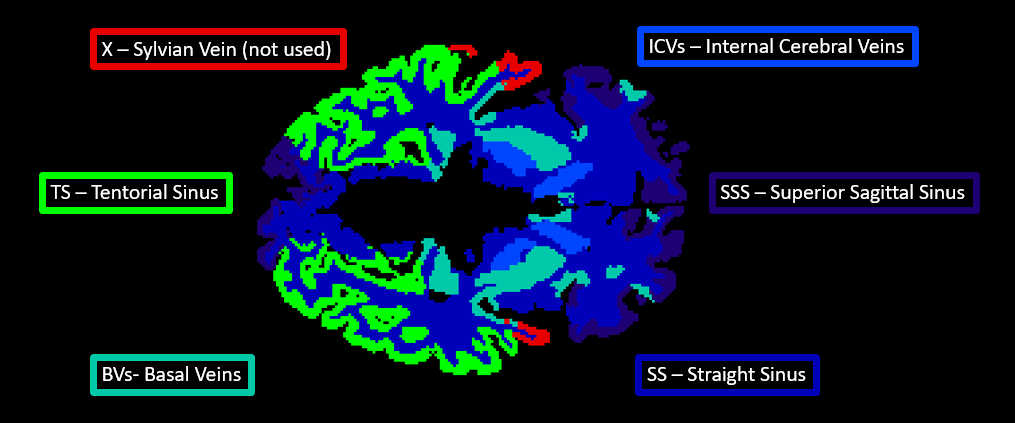
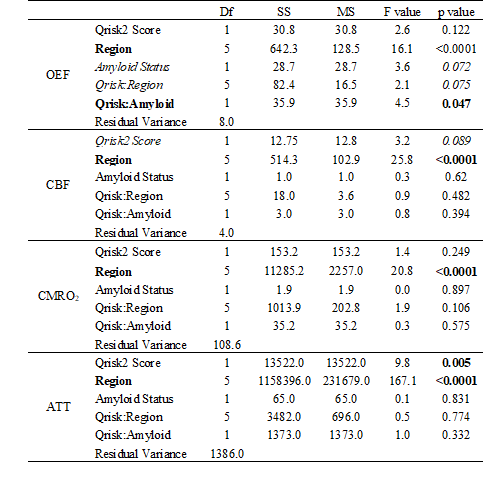
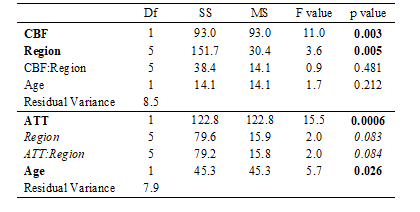
Table 2: Association between OEF and CBF/ATT
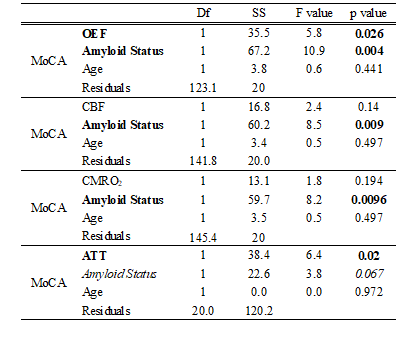
Table 3: Association between vascular imaging parameters and cognition (MoCA score)
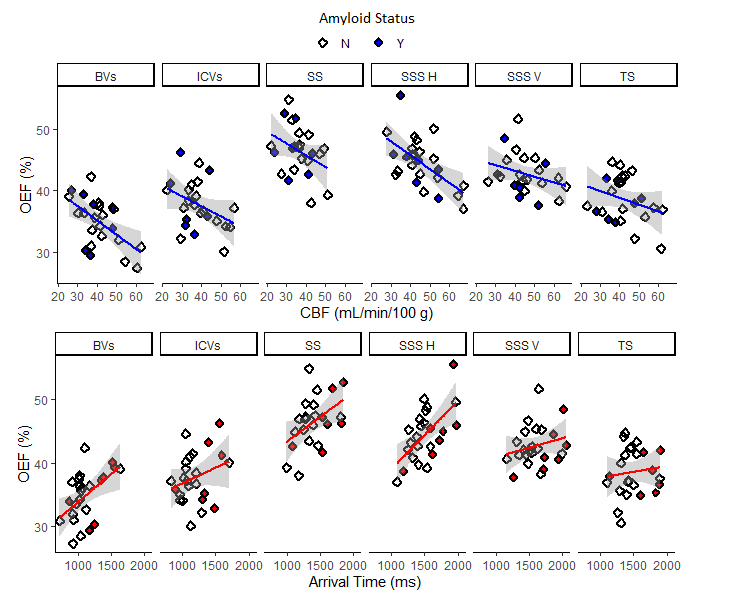
Figure 2: Compensatory relationship between OEF and CBF or ATT. Regional vascular imaging measurements of oxygen extraction fraction (OEF) against a) cerebral blood flow (CBF) and b) arterial transit time (ATT). Dark diamonds represent people with amyloid positive status as determined from amyloid PET imaging and open diamonds people who are amyloid negative. Shaded regions are confidence intervals calculated along with the linear fit using the geom_smooth function in R.