1219
Cerebrovascular brain-age1Department of Radiology and Nuclear Medicine, Amsterdam Neuroscience, Amsterdam University Medical Center, Amsterdam, Netherlands, 2Mediri GmbH, Heidelberg, Germany, 3Department of Diagnostic Physics, Division of Radiology and Nuclear Medicine, Oslo University Hospital, Oslo, Norway, 4Norwegian Centre for Mental Disorders Research (NORMENT), Institute of Clinical Medicine, University of Oslo & Division of Mental Health and Addiction, Oslo University Hospital, Oslo, Norway, 5Department of Psychology, University of Oslo, Oslo, Norway, 6KG Jebsen Centre for Neurodevelopmental Disorders, University of Oslo, Oslo, Norway, 7Dementia Research Centre, Queen Square Institute of Neurology; Centre for Medical Image Computing, University College London, London, United Kingdom, 8Queen Square Institute of Neurology and Centre for Medical Image Computing, University College London, London, United Kingdom, 9Helmholtz-Zentrum Dresden-Rossendorf, Dresden, Germany
Synopsis
The structural brain-age makes predictions based on changes in tissue integrity. Adding cerebrovascular MRI biomarkers may add sensitivity to physiological and metabolic changes, hence complementing structural brain-age, and possibly improving its early pathology sensitivity. Baseline and follow-up T1w, FLAIR, and ASL data of 233 healthy participants and combinations of features and algorithms were used to predict ‘Cerebrovascular brain-age’.
The ExtraTrees algorithm utilising T1w, ASL, and FLAIR features performed best and showed good longitudinal reproducibility.
Introduction
The brain-age method is able to estimate the biological brain age using structural MRI images, with a mean absolute error (MAE) of 5.3 years [1]. The brain-age offset to the chronological age — the age gap — is associated with cognitive pathology in healthy and cognitively impaired cohorts [2]. The structural brain-age makes predictions based on changes in brain-tissue integrity and irreversible structural changes. Adding vascular or functional MRI biomarkers may add sensitivity to physiological and metabolic changes, hence complementing and improving structural brain-age, and possibly improving its sensitivity to earlier disease changes.Arterial spin labeling (ASL) MRI is a potential early biomarker displaying changes in both blood supply and demand, and was shown to correlate with the initial stages of cognitive pathology [3]. First results by Rokicki et al. showed that ASL-derived features do improve brain-age prediction (r2=0.77, MAE = 6.4 years) [4]. It remains to be studied whether the use of other ASL-derived parameters, such as the spatial Coefficient of Variation (CoV) and vascular-territory derived (VT) CBF, may improve brain-age estimation even further [5,6]. These features incorporate ASL imaging properties that reflect age, such as arterial transit artefacts (ATA), in VT’s that are directly related to cerebrovascular health.
In this study, we propose the ‘Cerebrovascular brain-age’ as a combination of T1w, FLAIR, and ASL image features. We will compare its performance between different machine learning methods and image features, and estimate its long-term reproducibility.
Methods
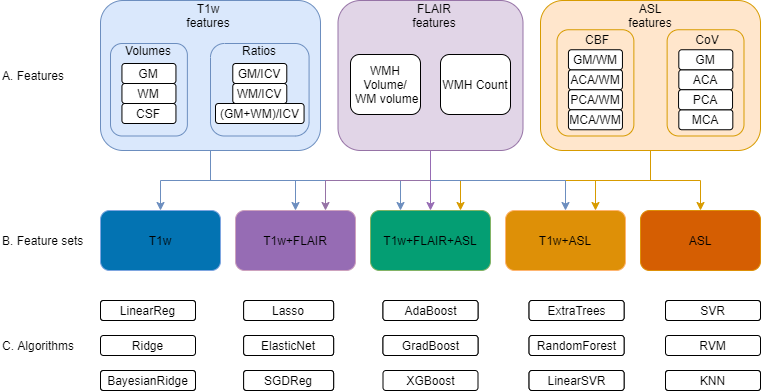
Methods-study design/dataBaseline and follow-up (1.7±0.5 years) T1w, FLAIR, and 3D spiral PCASL data of 233 healthy participants (36.8% male, age: 61.4±13.5 years) were drawn from the NORMENT (Norwegian Centre for Mental Disorders Research) StrokeMRI dataset [4], of which image acquisition specifics were described previously [4]. Image processing was performed with ExploreASL (Figure 1A) [7]. All images were registered to T1w and spatially normalised to MNI.
Comparison of machine learning models & image features
We compared different features (Figure 1A), feature sets (Figure 1B), and machine learning algorithms readily available within Python packages scikit-learn version 0.23.1, xgboost library version 1.2.0, and sklearn_rvm library version 0.1.1 (Figure 1C).
To correct for individual physiological differences, CBF features were normalised by deep WM CBF [7], which was not associated with age. Model performance was assessed for each algorithm and feature set combination, using MAE of age gaps — chronological minus predicted brain age — and 300 Monte-Carlo cross-validation simulations using a 70%:30% train-test split (n=326 : n=140). The optimal combination of machine learning method and image features was used in subsequent analyses, described below.
Comparison with existing brainageR model
Model performance was compared to brainageR (trained on 3337 healthy individuals, age: 40.6±21.4 years, age-range 18-92 years [8]) using the best-performing model and feature set using a single 70%:30% train-test split.
Validation with follow-up data
The best-performing model was selected based on the lowest MAE and assessed for robustness by looking at back-to-back repeatability. Age gaps were calculated for baseline and follow-up in the same train-test split mentioned above. Next, we tested if the age gaps at follow-up differed from age gaps at baseline using the paired t-test and intra-class correlation coefficient (ICC). Lastly, we compared the age gaps of the best performing model and T1w feature set using the paired t-test.
Results
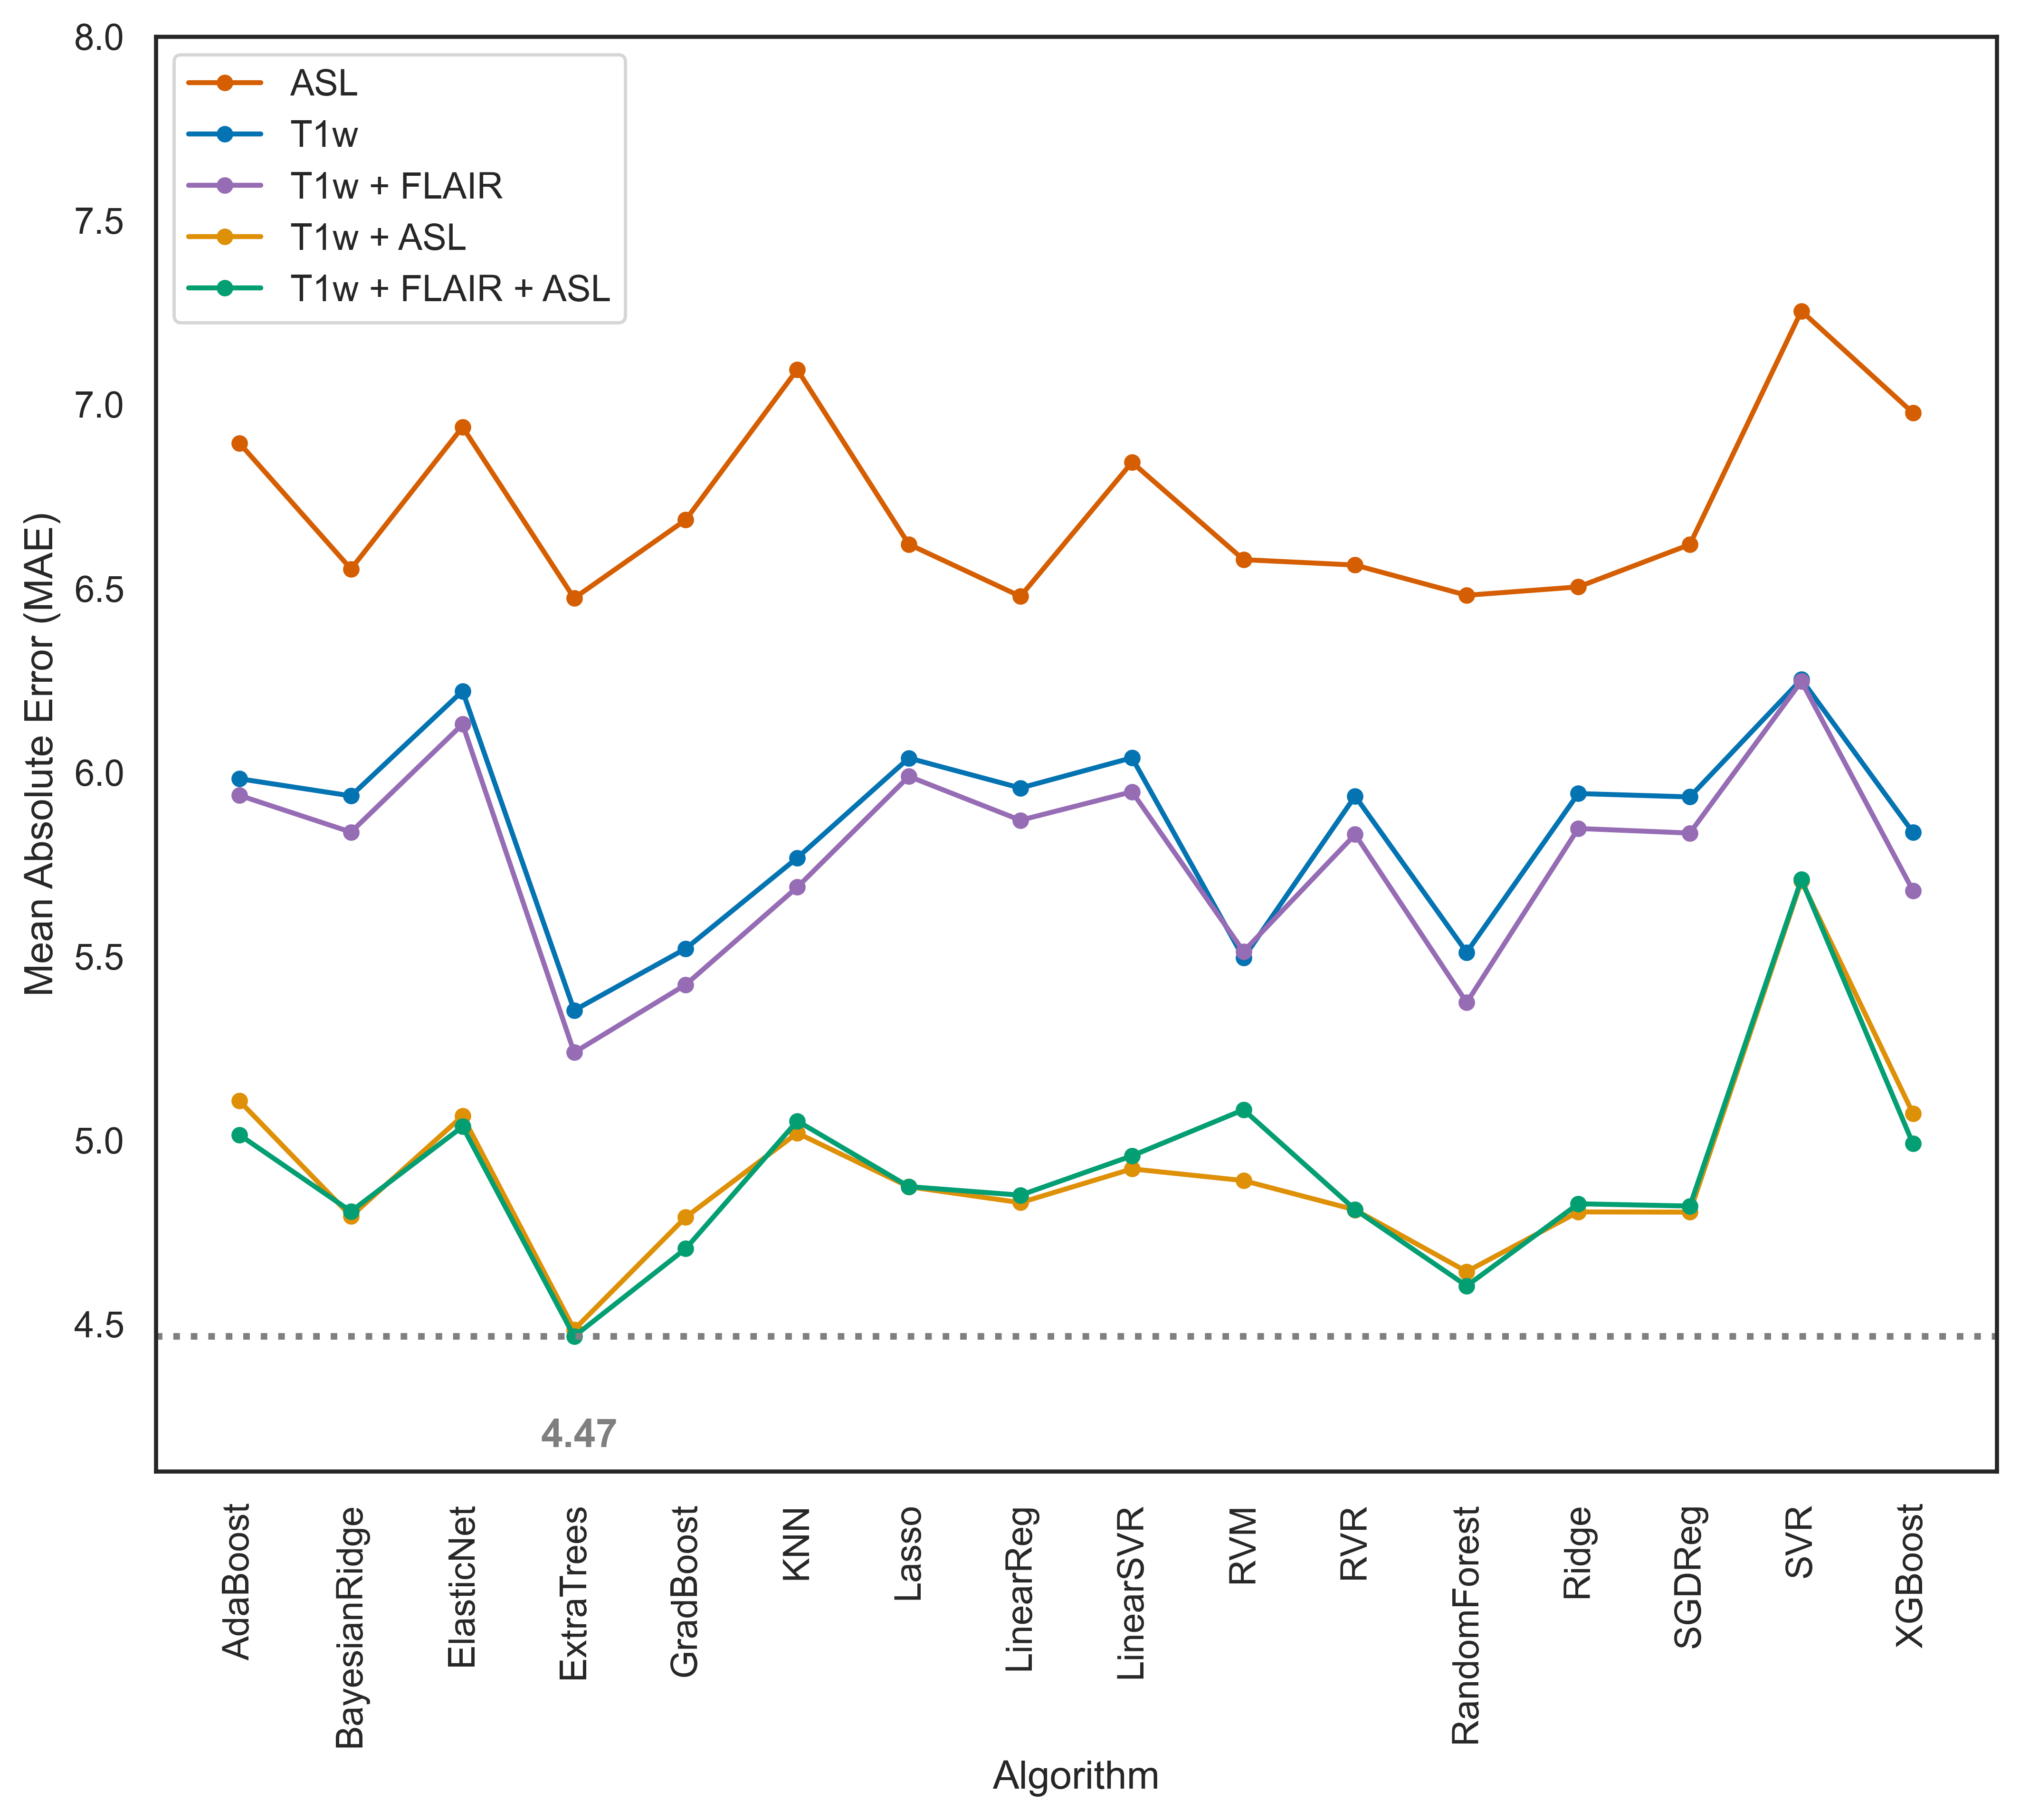
Comparison of machine learning models & image featuresThe ExtraTrees algorithm showed the lowest MAE for most feature sets, lowest for T1w+FLAIR+ASL (MAE = 4.47) (Figure 2).
Comparison with brainageR
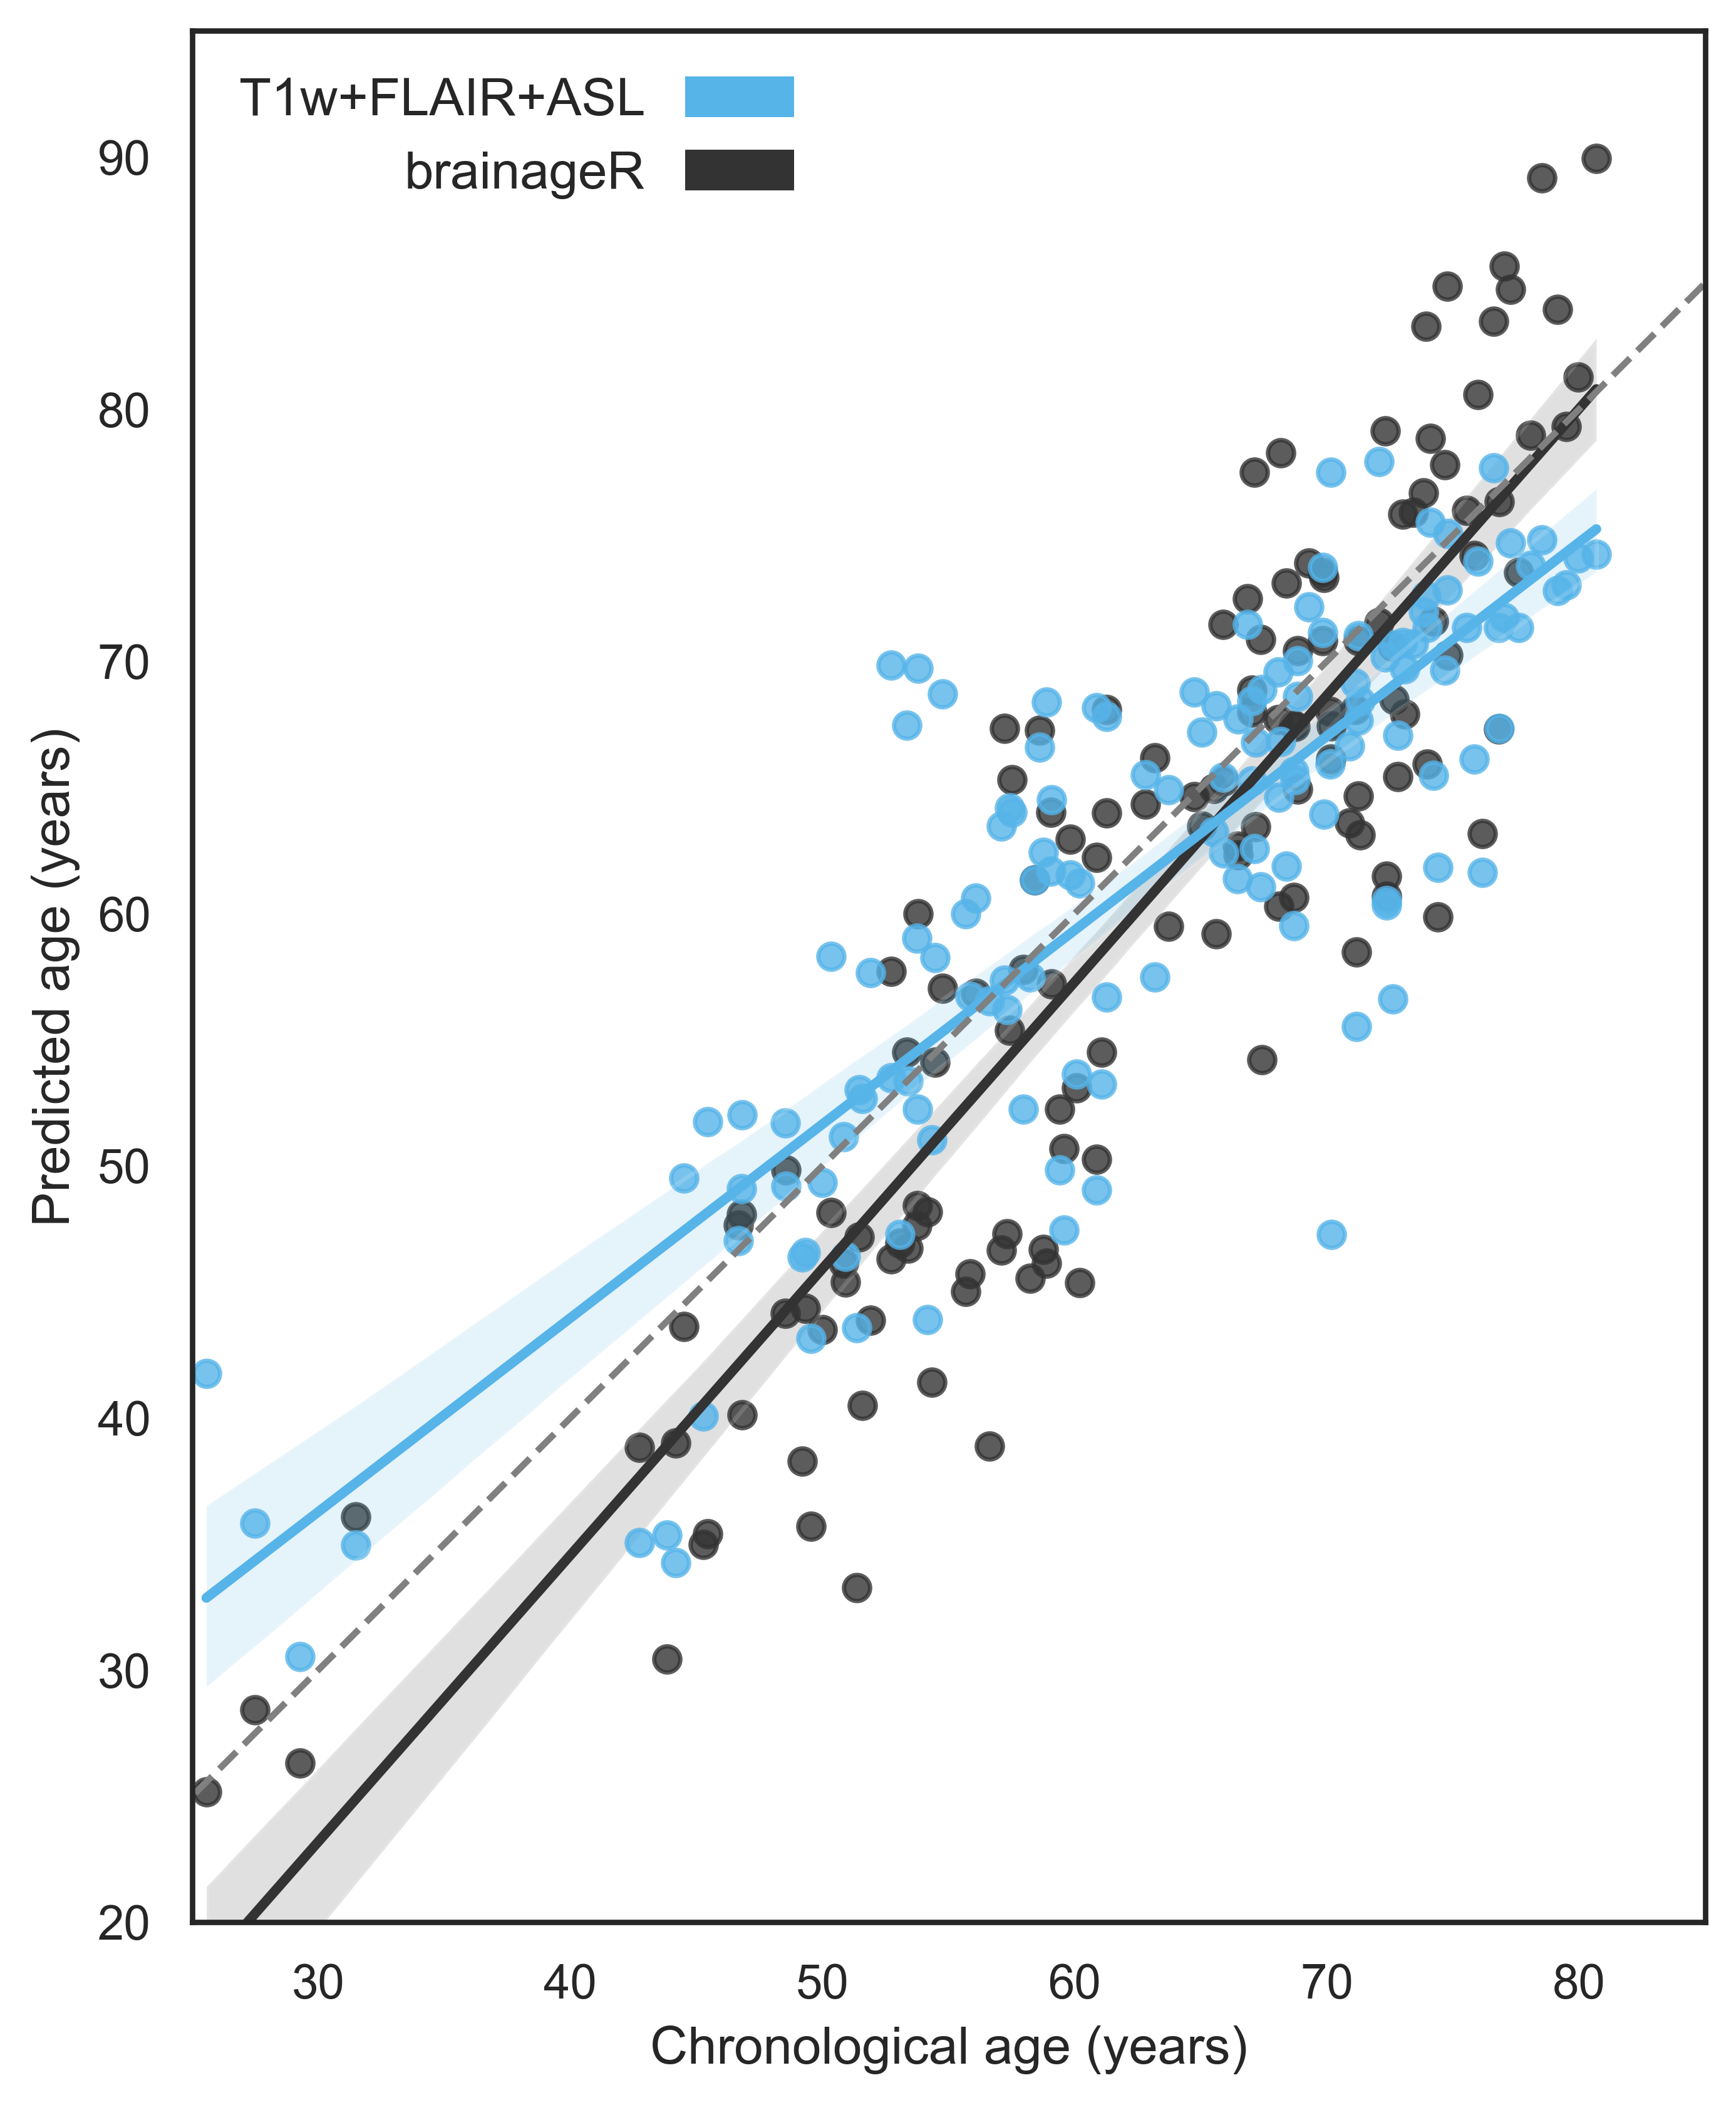
The ExtraTrees algorithm with T1w+FLAIR+ASL features performed better than brainageR (MAE = 5.36 and 5.67 respectively) in the single 70:30 split, but the difference was not significant (p = 0.06) (Figure 3).
Reproducibility in follow-up data
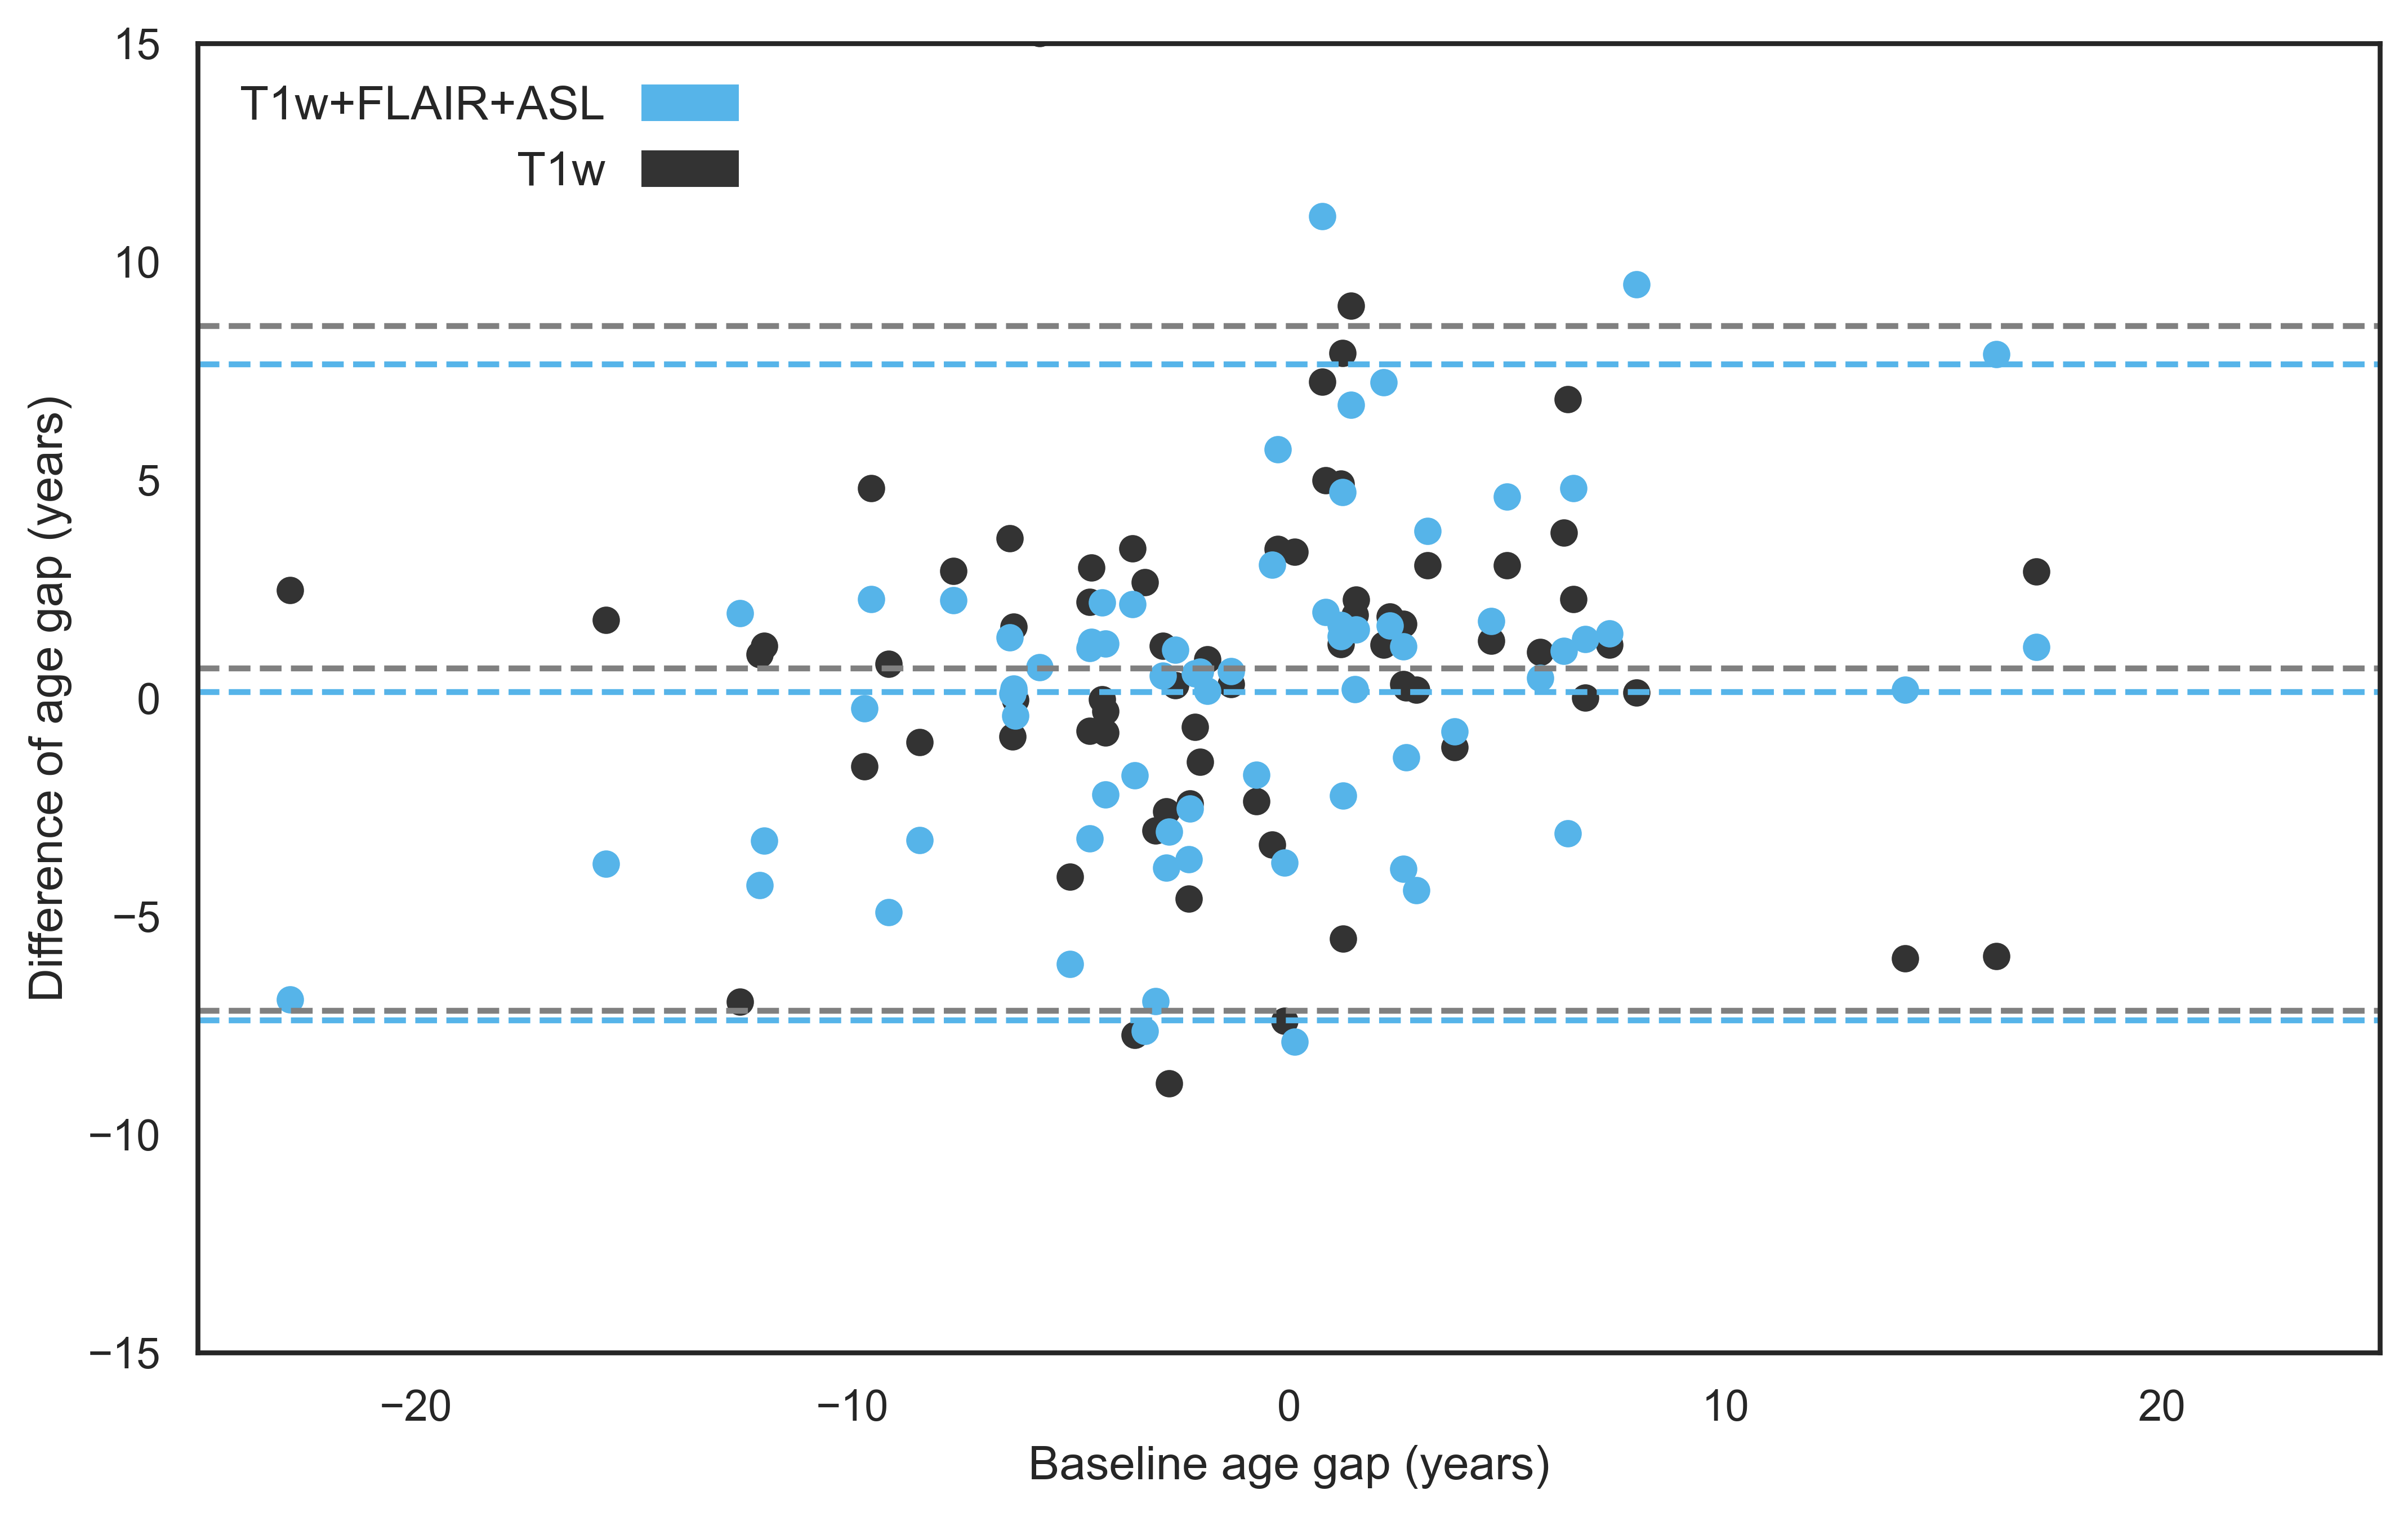
The ExtraTrees results showed very good reproducibility. The average baseline and follow-up age gaps were similar, respectively -1.18 ± 6.7 and -1.31 ± 6.2 years (p=0.38) with an average difference of 0.135 ± 3.8 years only (ICC = 0.83) (Figure 4). Reproducibility of T1w+FLAIR+ASL features, assessed as the average age gap differences between baseline and follow-up (p=0.17), was equally good as for only T1w features (Figure 5).
Discussion
Our results show that the addition of ASL and FLAIR features to structural brain-age can improve the prediction of brain-age and shows good long-term reproducibility. Out of the algorithms we compared, ExtraTrees performed the best. However, we could not improve the biological age prediction significantly from the existing brainageR model; probably because the brainageR model was trained with a larger population and wider age range. Furthermore, our model slightly overestimated young age and underestimated old age, which is the opposite to brainageR.Despite our relatively small population and the physiological variability of CBF, our cerebrovascular brain-age prediction remained relatively consistent from baseline to follow-up.
Our potential limitations include the relatively small, single-site, training and validation set. Future studies are encouraged to include multiple (longitudinal) cohorts and scanners to improve generalisation, and try to determine correlations between Cerebrovascular brain-age and cognitive decline.
Acknowledgements
We acknowledge the following grants: the Dutch Heart Foundation 2020T049 — M.B.J. Dijsselhof and H.J.M.M. Mutsaerts — the Eurostars-2 joint programme with co-funding from the European Union Horizon 2020 research and innovation programme (ASPIRE E!113701), provided by the Netherlands Enterprise Agency (RvO) — H.J.M.M. Mutsaerts and M. Stritt — and the EU Joint Program for Neurodegenerative Disease Research, provided by the Netherlands Organisation for Health Research and Development and Alzheimer Nederland DEBBIE JPND2020-568-106 — H.J.M.M. Mutsaerts.References
[1] James H Cole, Stuart J Ritchie, Mark E Bastin, MC Valdés Hernández, S Muñoz Maniega, Natalie Royle, Janie Corley, Alison Pattie, Sarah E Harris, Qian Zhang, et al. Brain age predicts mortality. Molecular psychiatry, 23(5):1385– 1392, 2018.
[2] B. Manor, M. Gorges, Y. Cruz-Almeida, K. Franke, and C. Gaser, “Ten Years of brain-age as a Neuroimaging Biomarker of Brain Aging: What Insights Have We Gained?,” Front. Neurol., vol. 1, p. 789, 2019, doi: 10.3389/fneur.2019.00789.
[3] Y Iturria-Medina, Sotero RC, Toussaint PJ, Mateos-Pérez JM, Weiner MW, Aisen P, Petersen R, et al. Early role of vascular dysregulation on late-onset Alzheimer’s disease based on multifactorial data-driven analysis. Nat Commun. doi:10.1038/ncomms11934
[4] Rokicki J, Wolfers T, Nordhøy W, Tesli N, Quintana DS, Alnaes D, Richard G, de Lange AG, Lund MJ, Norbom L, Agartz I, Melle I, Naerland T, Selbaek G, Persson K, Nordvik JE, Schwarz E, Andreassen OA, Kaufmann T, Westlye LT. Multimodal imaging improves brain age prediction and reveals distinct abnormalities in patients with psychiatric and neurological disorders. Hum Brain Mapp. 2021 Apr 15;42(6):1714-1726. doi: 10.1002/hbm.25323. Epub 2020 Dec 19. PMID: 33340180; PMCID: PMC7978139.
[5] Henri JMM Mutsaerts, Jan Petr, Lena Václav, Jan W Van Dalen, Andrew D Robertson, Matthan W Caan, Mario Masellis, Aart J Nederveen, Edo Richard, and Bradley J MacIntosh. The spatial coefficient of variation in arterial spin labeling cerebral blood flow images. Journal of Cerebral Blood Flow & Metabolism, 37(9):3184–3192, 2017
[6] Tatu L., Moulin, T., Bogousslavsky, J. & Duvernoy, H. Arterial territories of the human brain: cerebral hemispheres. Neurology 50, 1699–1708 (1998)
[7] H. J. M. M. Mutsaerts et al., “ExploreASL: An image processing pipeline for multi-center ASL perfusion MRI studies,” Neuroimage, vol. 219, Oct. 2020, doi: 10.1016/j.neuroimage.2020.117031.
[8] Biondo, F., Jewell, A., Pritchard, M., Aarsland, D., Steves, C. J., Mueller, C., & Cole, J. H. (2021). Brain-age predicts subsequent dementia in memory clinic patients. medRxiv, 2021.2004.2003.21254781
Figures