1217
Implementation of non-invasive Filter-Exchange Imaging (FEXI) to measure blood-brain barrier water exchange in the rat brain1Division of Neuroscience and Experimental Psychology, University of Manchester, Manchester, United Kingdom, 2Geoffrey Jefferson Brain Research Centre, University of Manchester, Manchester, United Kingdom, 3Centre for Medical Image Computing, UCL, London, United Kingdom, 4Department of Computer Science, UCL, London, United Kingdom, 5Danish Research Centre for Magnetic Resonance, Copenhagen University Hospital Amager and Hvidovre, Copenhagen, Denmark, 6Random Walk Imaging, Lund, Sweden, 7Department of Medical Physics and Biomedical Engineering, UCL, London, United Kingdom, 8Bioxydyn Limited, Manchester, United Kingdom, 9Division of Informatics, Imaging and Data Sciences, University of Manchester, Manchester, United Kingdom
Synopsis
We have developed a preclinical FEXI sequence optimised to measure water exchange across the blood-brain barrier in the rat brain. Simulated synthetic data estimated an apparent exchange rate (AXR) of 1.22 s-1, using the in-vivo acquisition parameters and exchange rate constant = 2.5 s-1, reflecting in-vivo measurements. The experimental normalised AXR in the rat brain was measured at 3.34 ± 1.14 s-1 (scan) and 3.62 ± 0.96 s-1 (rescan), with CoV = 26%, n = 10. This technique is a promising non-invasive tool which can be applied to in a wide range of disease models, including neurodegeneration, stroke and neuroinflammation.
Introduction
Filter-exchange imaging (FEXI) is a promising non-invasive MRI technique to measure water exchange processes[1, 2]. The technique has been used to measure vascular water exchange across the blood-brain barrier (BBB) in the human brain[3], which could be important for improved understanding of neurological conditions such as neuroinflammation and neurodegeneration. The FEXI method has yet to be applied to study BBB exchange in the rodent brain, due to challenging implementation with the markedly smaller brain size, requiring thinner slices and thus higher magnitude crusher gradients[4]. However, the application of FEXI in rodents would allow controlled studies of disease using transgenic rodent models to probe specific targets that underpin pathology relating to BBB function. Here, we establish a FEXI protocol optimised to measure water exchange across the BBB in the rat brain and provide estimates of apparent exchange rate (AXR).Methods and Materials
To investigate the effects of crusher gradients and low b-value used to measure BBB exchange, synthetic signals relating to a diffusion encoding experiment were simulated in Matlab R2021a using a two compartment model as described previously[4], with exchange rate, k = 2.5 s-1, extravascular volume fraction, fe = 0.95, intravascular and extravascular diffusivities, D1 = 8 x 10⁻³ mm2/s and D2 = 0.8 x 10⁻³ mm2/s [5], and all other acquisition parameters matching the in-vivo imaging protocol below.Experimental data were acquired in Wistar rats (n = 10) using an Agilent 7T magnet interfaced to a Bruker Avance III console with a rat head receiver coil (Bruker BioSpin) using double diffusion-encoding FEXI sequence, developed in house, with a single shot EPI readout. Non-selective filter pulses with slab thickness = 30mm were implemented in first diffusion-encoding filter module, to minimise in-flow effects, and slice selective pulses were used for the second diffusion-encoding with slice thickness = 4mm. Other imaging parameters: filter b-value (bf) = 0 s/mm2 and 250 s/mm2; b values = 0, 250 s/mm2; mixing times (tm) = 25, 50, 100, 200, 300 ms; TE = 14 ms; TR = 3000 ms; single-slice; resolution = 0.5 x 0.5 x 4 mm; repetitions = 10. Total scan time was approximately 35 minutes. Scans were repeated in the same rats 9 ± 2 days later to assess the repeatability of the measurement.
Experimental data were evaluated using Matlab (R2021a), in a whole brain ROI, excluding the ventricular regions. Synthetic and experimental data were fit with the standard apparent exchange rate (AXR) model:
ADC’(tm) = ADCeq(1 – σ exp(-tm AXR)) [2],
where ADC’ is the filtered apparent diffusion coefficient, ADCeq is the non-filtered apparent diffusion coefficient, σ is the filter efficiency, using a non-linear least squares fitting with ADCeq fixed at ADCeq(tm = 25ms). To reduce biases in ADC’ and ADCeq, and hence AXR, due to crusher gradients, the experimental ADC’ was normalised to the ADCeq at each tm prior to fitting a normalised AXR model: ADC’(tm)/ADCeq(tm) = 1 – σ exp(-tm AXR). Repeatability was quantified using the coefficient of variation (CoV).
Results & Discussion
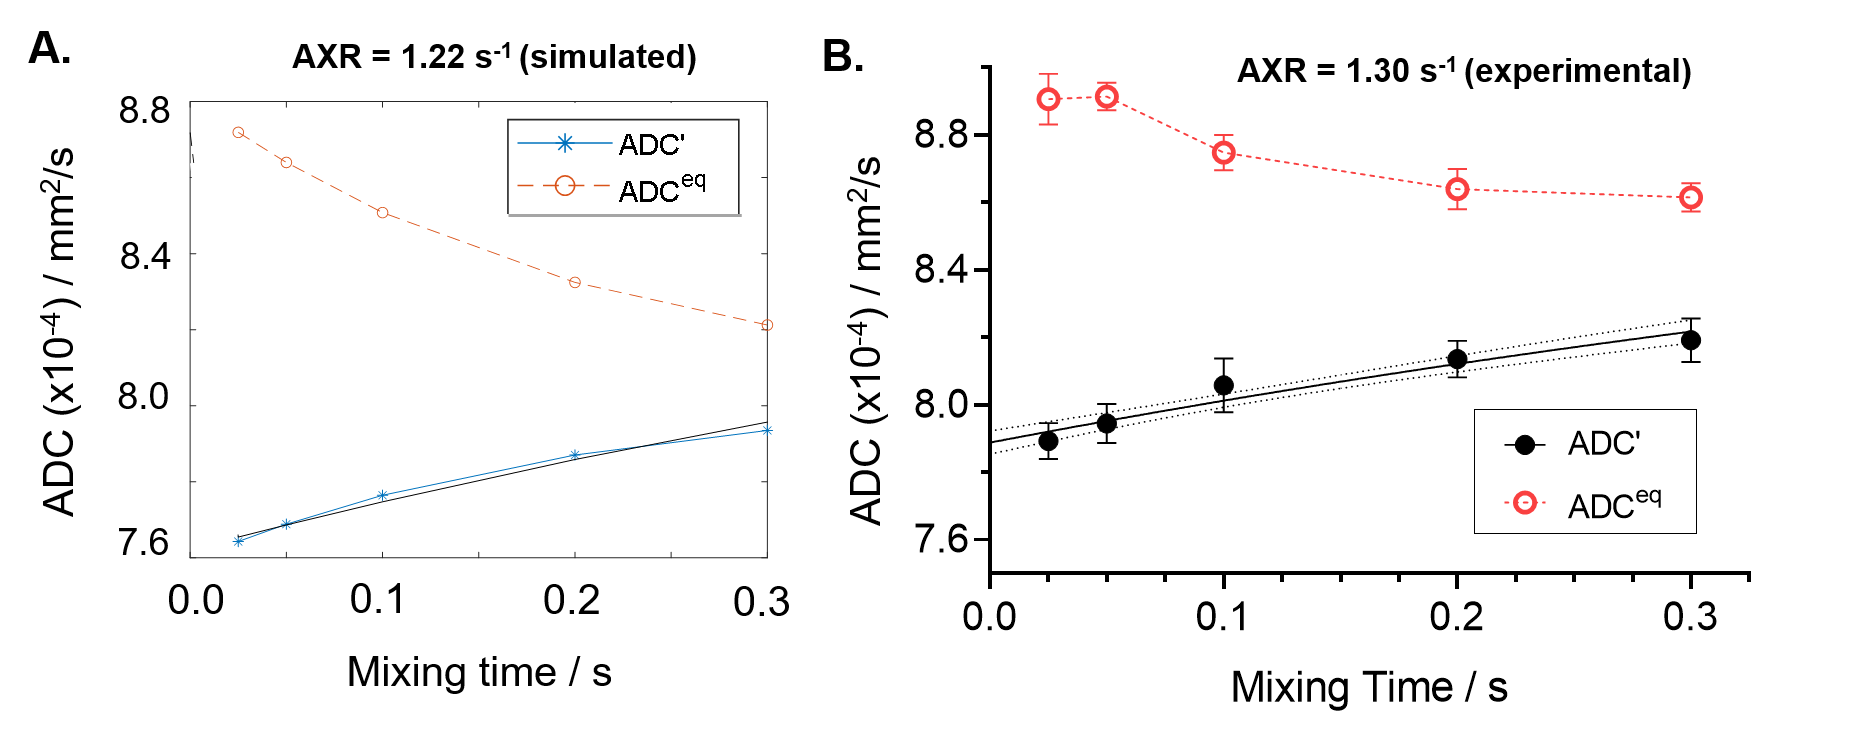
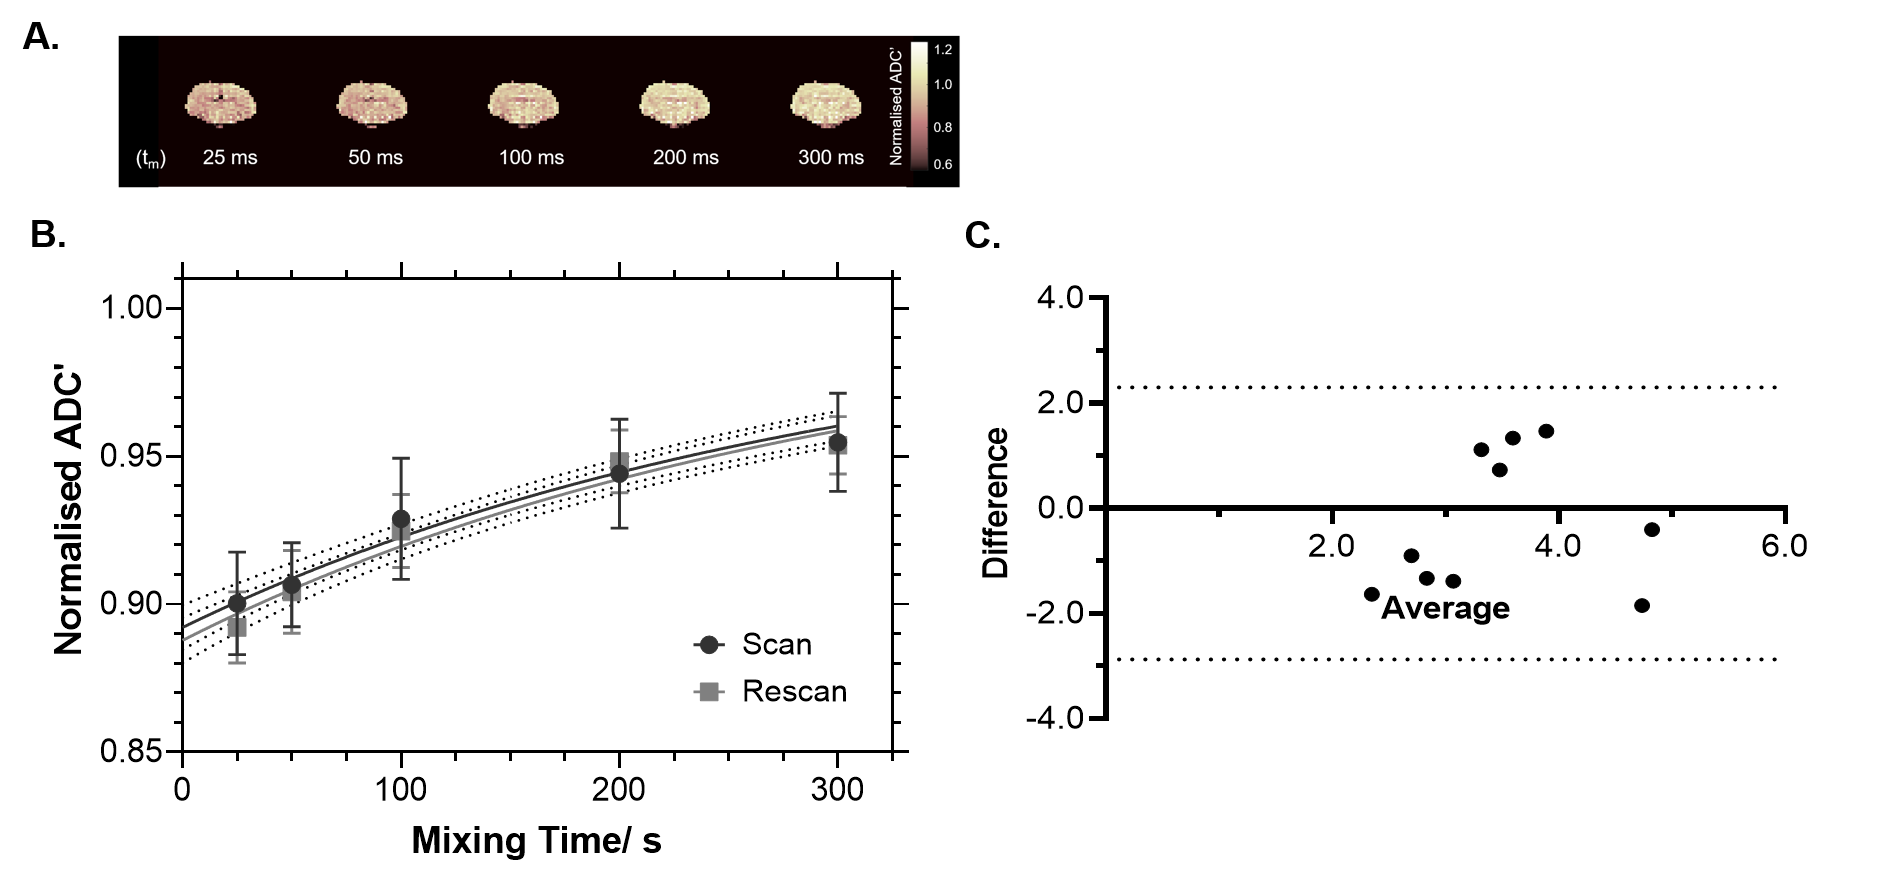
Figure 1 shows the simulated and experimental results of ADC’(tm) and estimates of AXR using the standard model. The simulated ADCeq data (Figure 1A) are biased due to the crusher gradients, leading to an underestimation of the AXR (from 2.5 s-1 to 1.22 s-1) [4]. The experimental ADCeq (Figure 1B) exhibits a similar trend (seen across all subjects), with mean experimental AXR = 0.78 ± 0.59 s-1 (scan), 0.51 ± 0.43 s-1 (rescan), n = 10. Figure 2A shows normalised ADC’ map for each tm in a representative subject. Group mean normalised AXR plots are shown in Figure 2B, demonstrating the correspondence between the scan and rescan measurements. The mean normalised AXR values were determined to be 3.34 ± 1.14 s-1 (scan) and 3.62 ± 0.96 s-1 (rescan), with Bland-Altman plot of the average vs the difference presented in Figure 2C; CoV = 0.26. Overall, the experimental data show a recovery of the ADC with increasing tm reflective of extravascular water entering the intravascular compartment. Though the mean AXR values obtained using the standard AXR model are slightly lower than expected, the normalised AXR measurements are in line with the average estimates of BBB water-exchange rate in the rodent brain[6]. The difference in T1 and T2 relaxation effects between the intravascular an extravascular compartments may be contributing to the underestimation of the AXR, which will be explored in future work[7]. This is a promising first step for using the non-invasive FEXI technique in the rat brain, and will be used to assess changes to BBB water permeability in disease conditions.Conclusion
We have developed a FEXI imaging protocol to measure the apparent water exchange rate across the BBB in rat brain. This technique has the potential to be applied to study BBB water-exchange processes in a wide range of disease models, including neurodegeneration, stroke and neuroinflammation.Acknowledgements
This work is funded by the EPSRC code EP/S031510/1 and the European Research Council (ERC) under the European Union’s Horizon 2020 research and innovation programme (grant agreement No 804746). SL is supported also by Random Walk Imaging. We would like to thank the staff at The Biological Service Facility at the University of Manchester for their help maintaining animal welfare and environmental enrichment during this study.References
[1] Lasicˇ, S. et al. Apparent Exchange Rate Mapping with Diffusion MRI. MRM (2011).
[2] Nilsson, M. et al. Noninvasive Mapping of Water Diffusional Exchange inthe Human Brain Using Filter-Exchange Imaging. MRM (2013).
[3] Bai, R. et al. Feasibility of filter-exchange imaging (FEXI) in measuring differentexchange processes in human brain. NeuroImage (2020)
[4] Lasicˇ, S. et al Effects of imaging gradients in sequences with varying longitudinal storage time - Caseof diffusion exchange imaging. MRM (2017).
[5] Scott et al. Characterisation of microvessel blood velocity and segment length in the brain using multi-diffusion-time diffusion-weighted MRI. JCBFM (2020)
[6] Dickie B.M et al. Measuring water exchange across the blood-brain barrier using MRI. Progress in NMR Spect. (2019).
[7] Eriksson, S. et al. NMR quantification of diffusional exchange in cell suspensions with relaxation rate differences between intra and extracellular compartments. PLoS One (2017)
Figures