1214
Changes in cerebrospinal fluid dynamics and its coupling with global brain activity in early glaucoma patients1Department of Ophthalmology, New York University Grossman School of Medicine, New York, NY, United States, 2Department of Radiology, New York University Grossman School of Medicine, New York, NY, United States
Synopsis
Neurodegenerative diseases are thought to involve changes in the cerebrospinal fluid (CSF). Since glaucoma is a neurodegenerative disease of the visual system, here, we examined the CSF dynamics in glaucoma patients. Specifically, using resting-state fMRI, we observed that early glaucoma patients present greater power in the low frequency of the CSF flow and greater coupling between CSF flow and global brain activity compared to late glaucoma patients. Further, the coupling between CSF flow and global brain activity is associated with the volumes of the optic nerve and optic chiasm. Overall, our results suggest that glaucoma involves changes in CSF flow.
Introduction
Cerebrospinal fluid (CSF) plays a critical role in clearing metabolic waste products from the brain1,2. Recent studies suggest that CSF flow is facilitated by global brain activity3 and that altered coupling between CSF flow and global brain activity is associated with the development of neurodegenerative diseases such as Alzheimer’s4. Given that glaucoma is considered a widespread neurodegenerative disease involving retinal ganglion cells, optic nerve and the distal visual pathways5, we focused on the possible involvements of CSF signals and its coupling with the global brain activity (CSF-BOLD coupling) in glaucoma.Methods
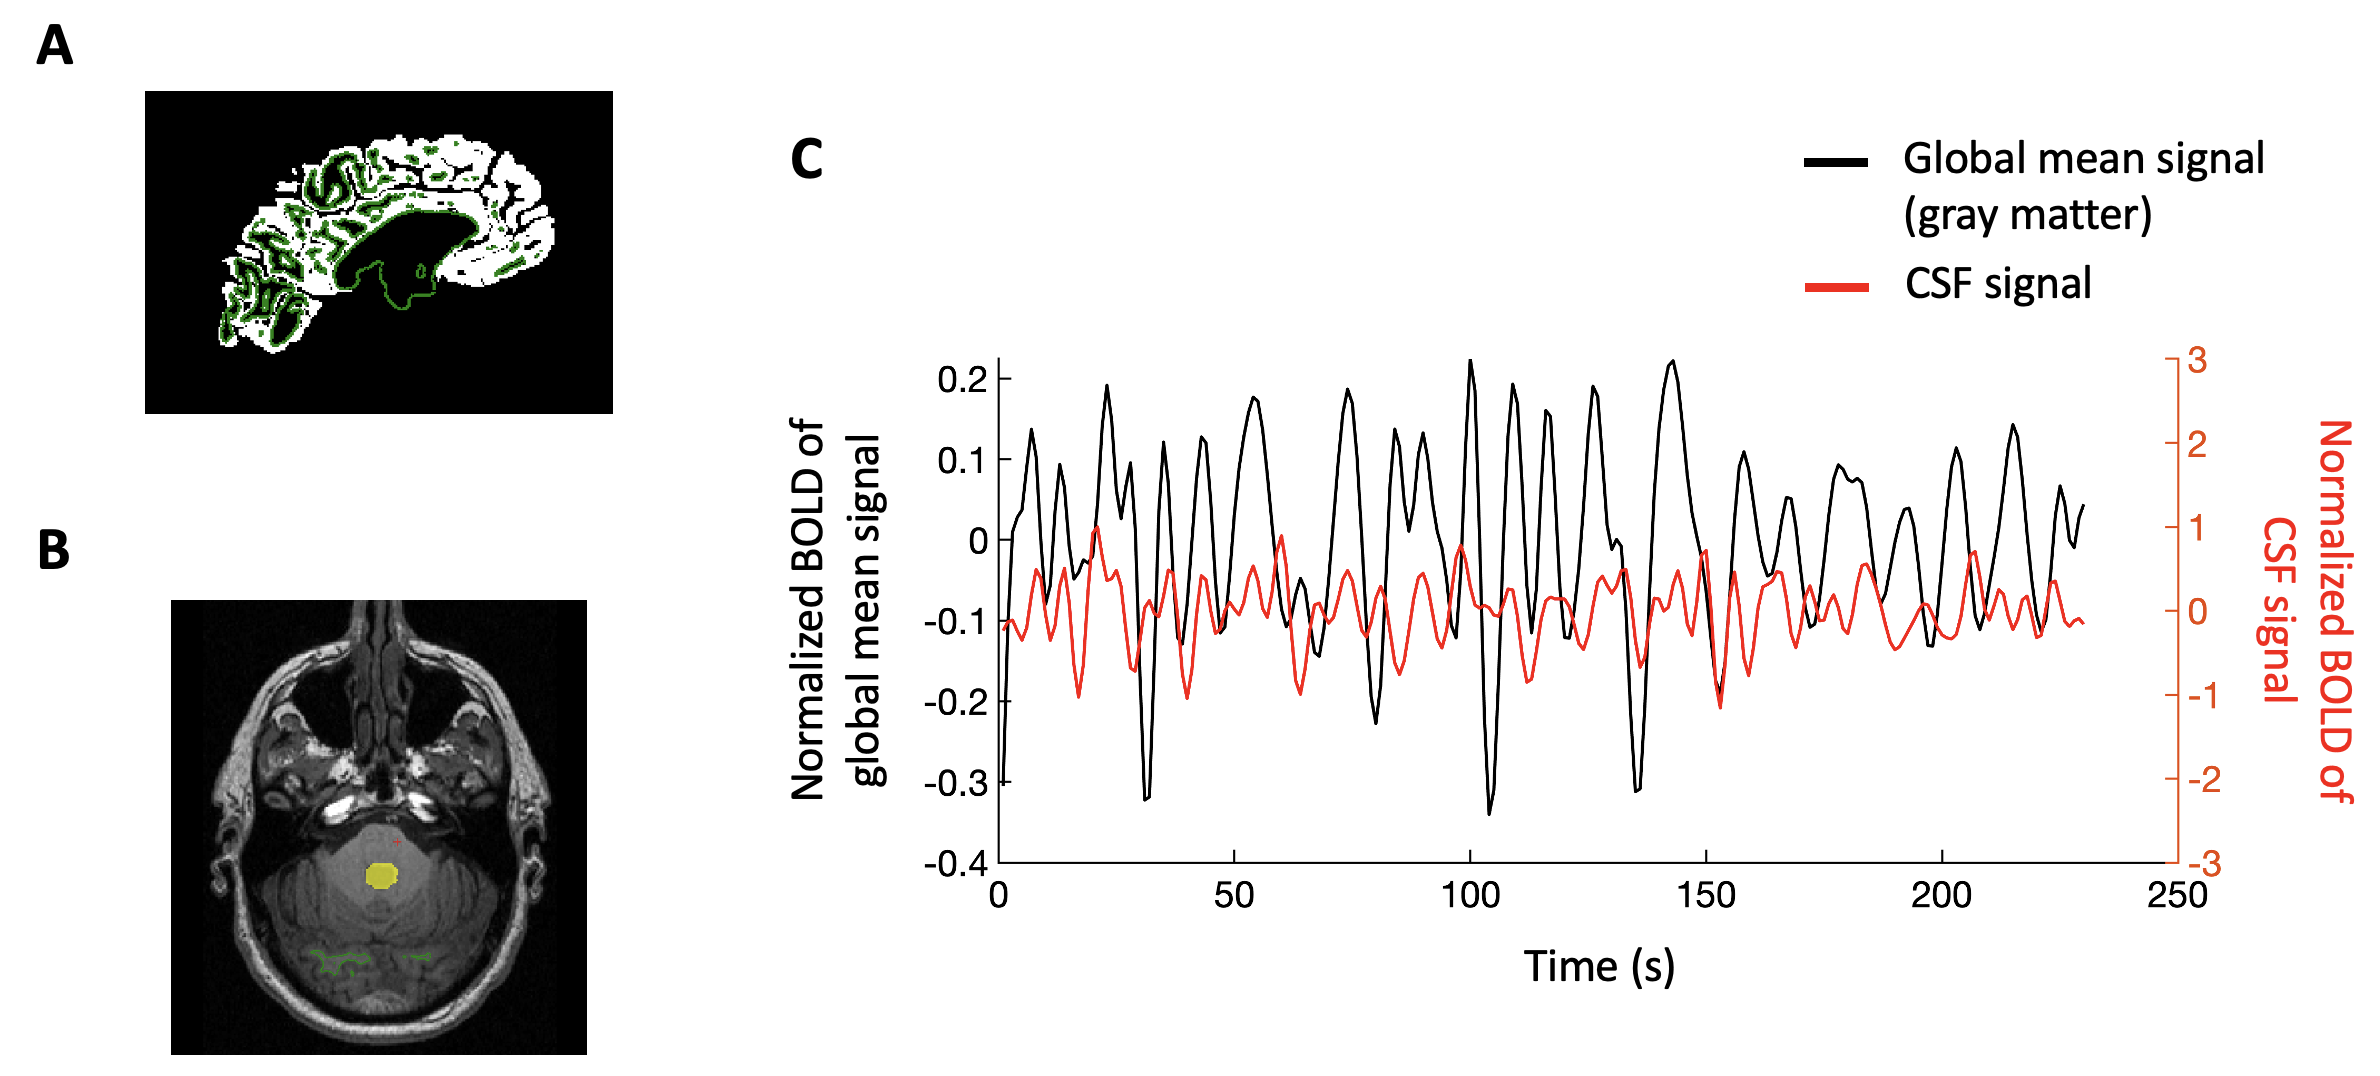
Nineteen early glaucoma patients, nineteen late glaucoma patients, and twenty-one healthy control subjects were scanned inside a 3-Tesla Siemens Allegra MRI scanner. For anatomical localization, we acquired high-resolution T1-weighted MR images using a multi-echo magnetization-prepared rapid gradient echo sequence (voxel size= 1×1×1 mm3). Then we obtained resting-state functional MR images of the whole brain for eight minutes using a gradient-echo echo-planar imaging sequence (TR/TE=2000/26 ms; voxel size=2x2x3 mm3).We analyzed the MRI data using Freesurfer software. For the resting-state fMRI data, we performed motion correction, spatial smoothing (FWHM=4mm), temporal filtering (0.01-0.1Hz) and removal of linear and quadratic trends. Then we discarded the first and the last 5 volumes to avoid magnetization noises and normalized the signals at each voxel. The gray matter mask was obtained individually using automated segmentation. The CSF mask was manually delineated from the bottom slice of fMRI images at the fourth ventricle. Then we extracted the BOLD signals from the gray matter mask and the CSF mask and averaged them across the voxels. The averaged BOLD signals from the gray matter mask and the CSF flow were then labeled as the global mean signal and the CSF signal, respectively3,4.
Results
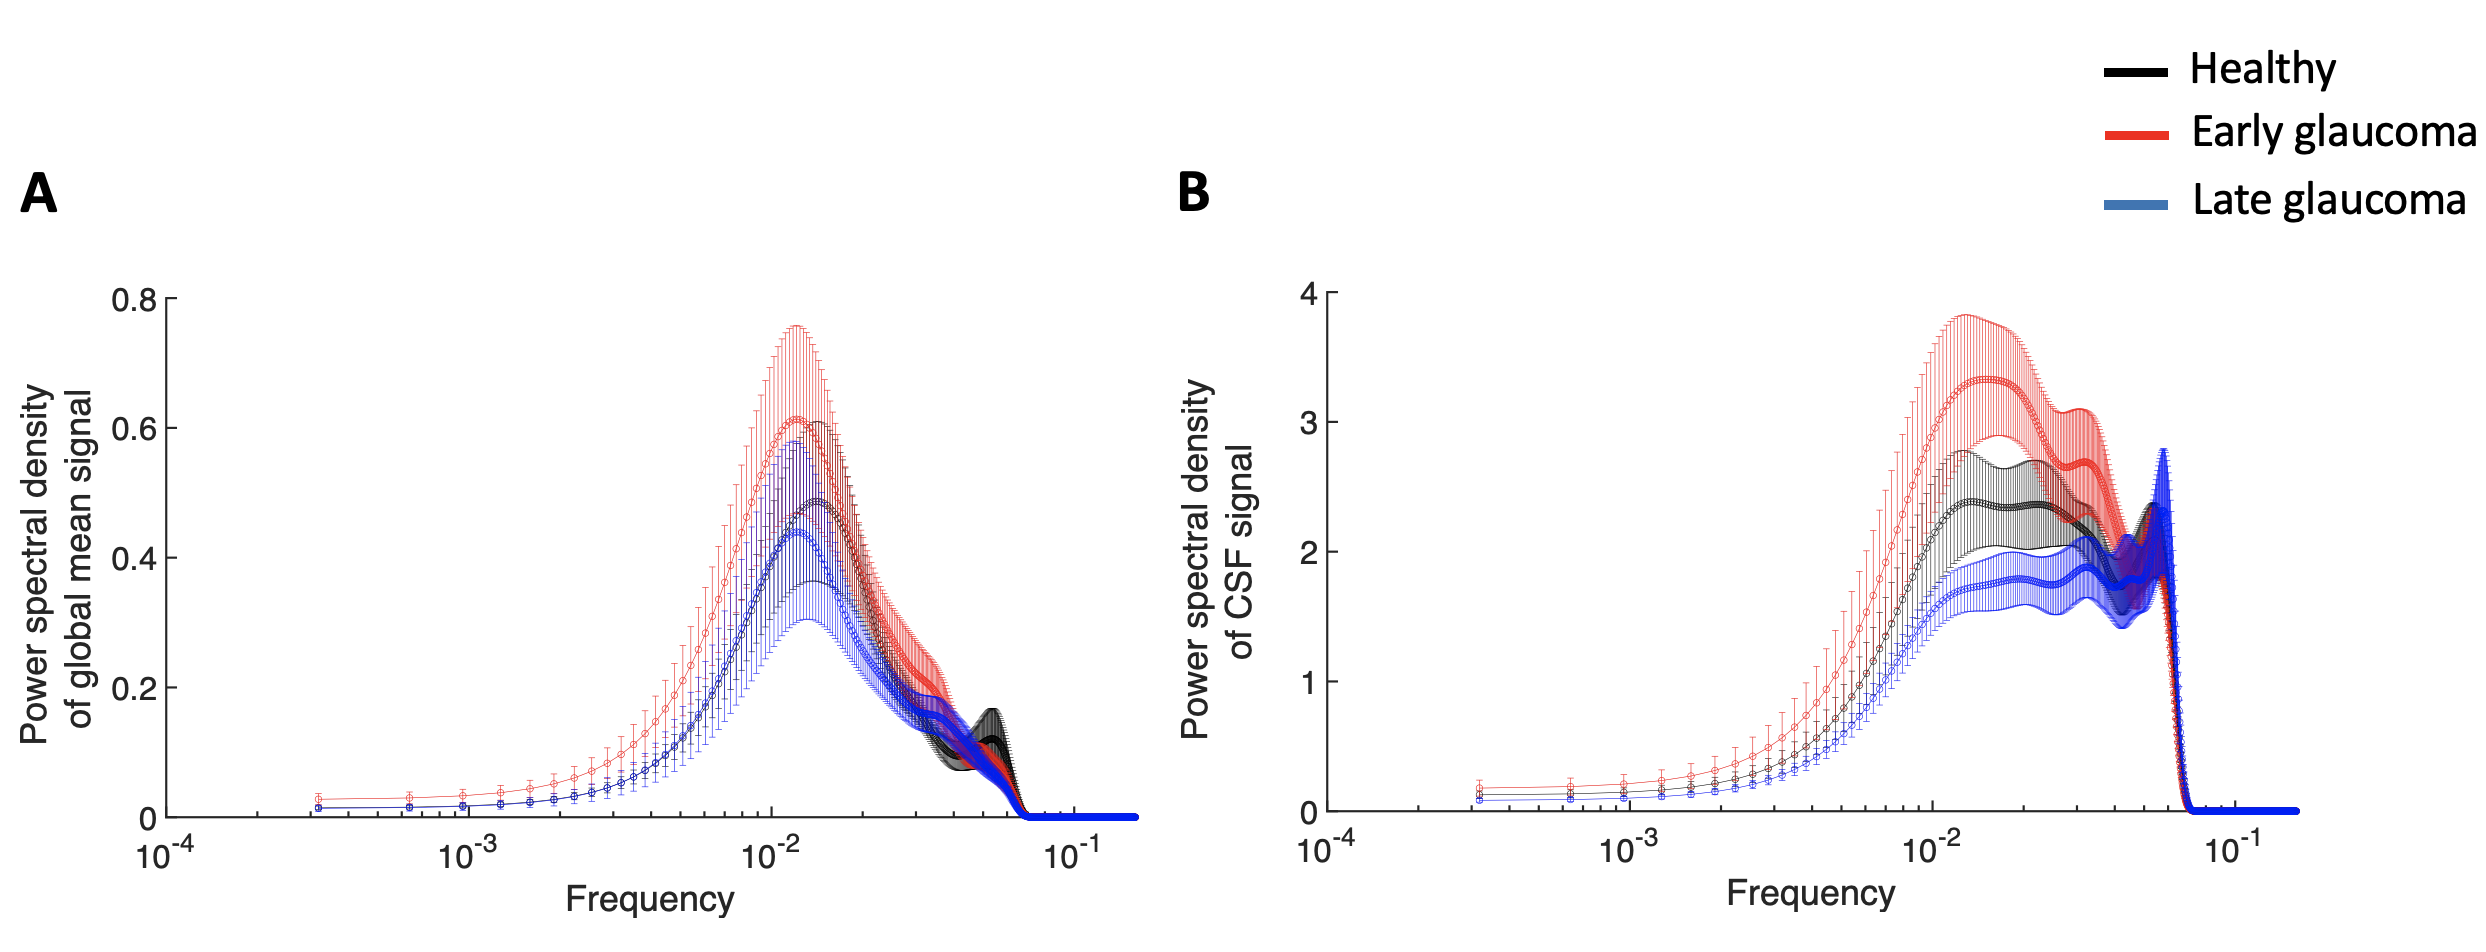
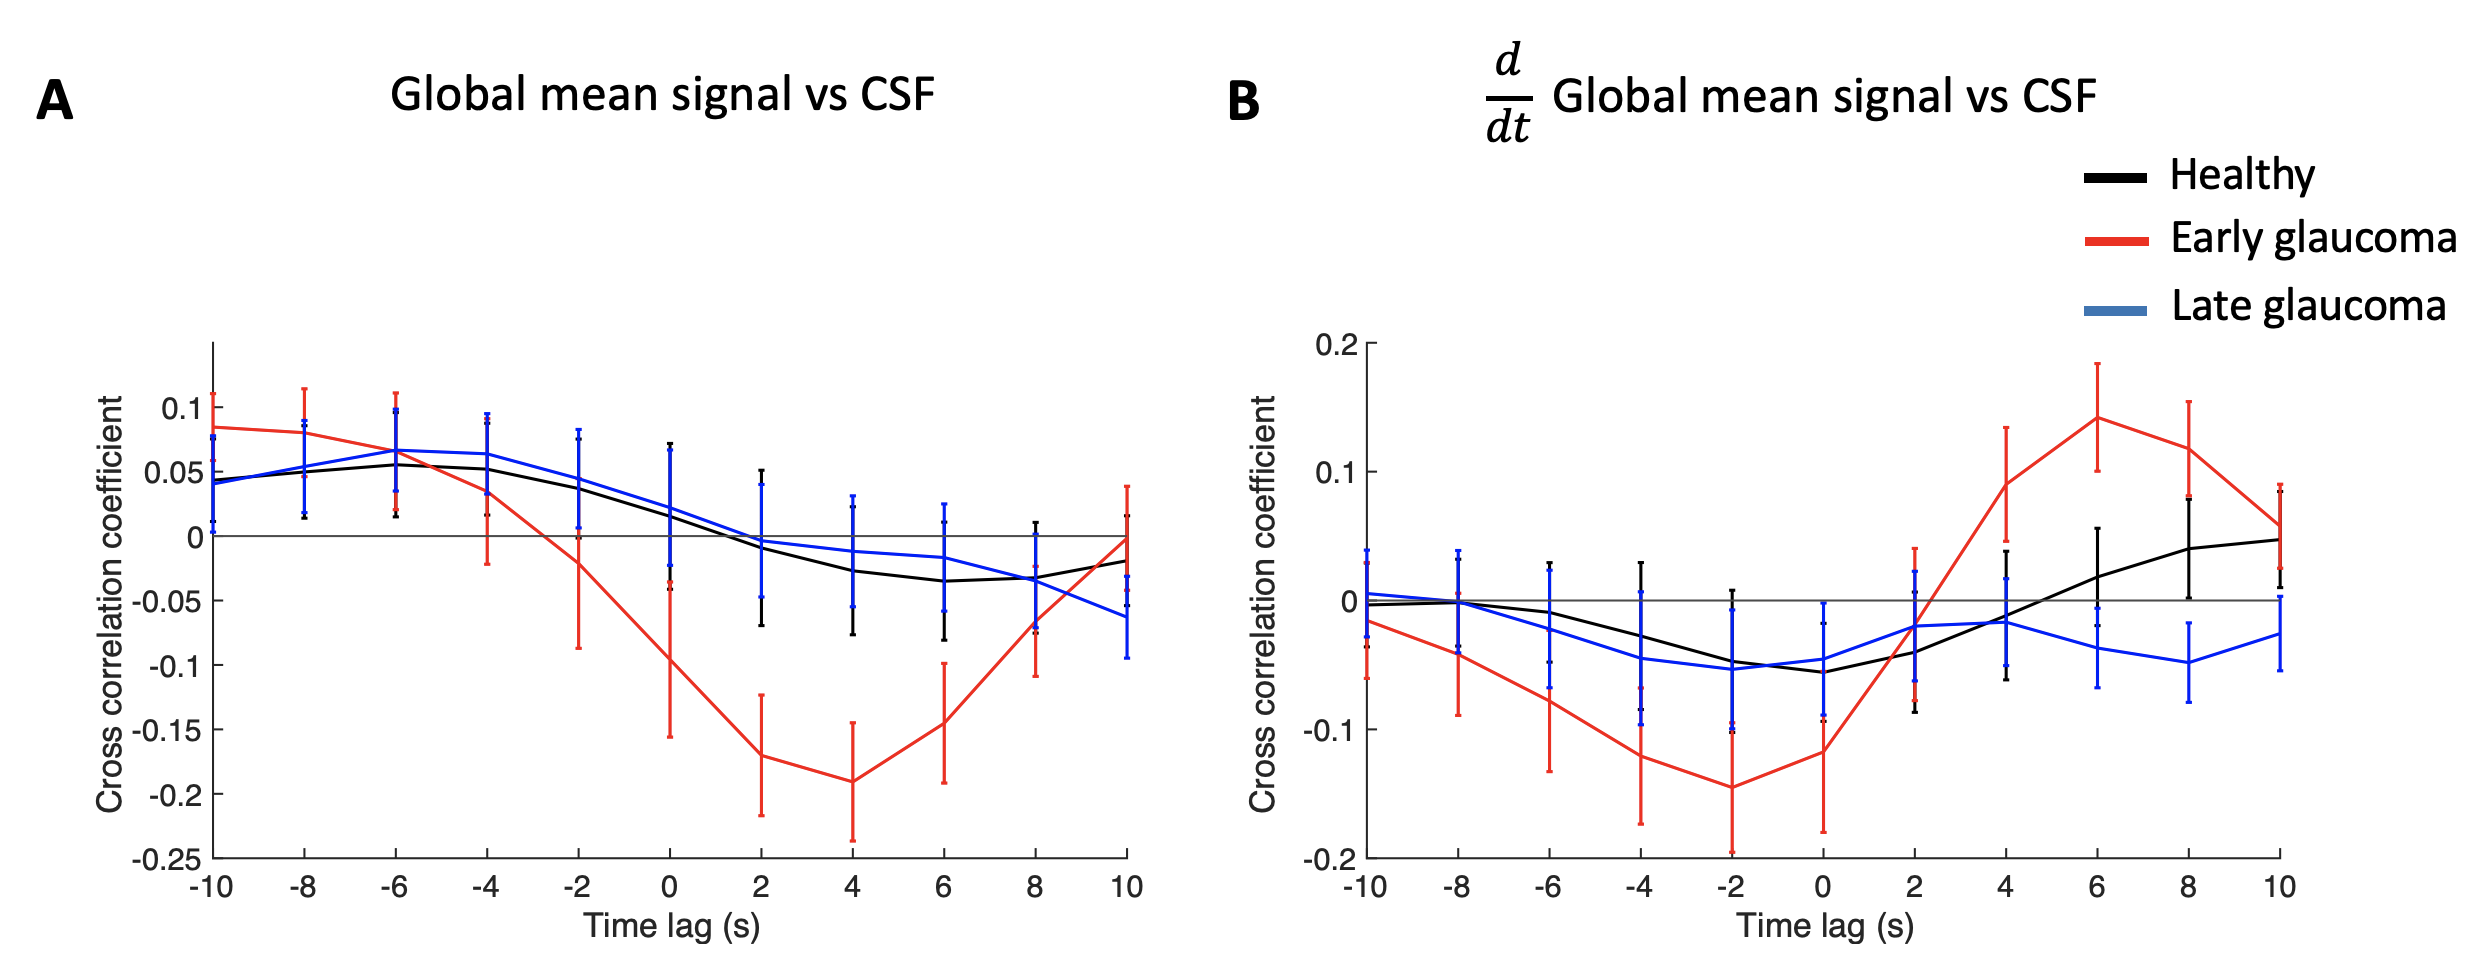
We first examined if the power of the low frequency in the global mean signal and the CSF signal is different between glaucoma and healthy groups. We observed that the low frequency of 0.01-0.03Hz in the CSF signal was significantly different across groups (two-way mixed ANOVA; main effect of group, P=0.011; Figure 2A) whereas that in the global mean signal did not reach significance (two-way mixed ANOVA; main effect of group, P=0.399; Figure 2B). Specifically, early glaucoma patients presented significantly greater power in the CSF signal compared to late glaucoma patients (Bonferroni-adjusted P=0.008).To further investigate the CSF-BOLD coupling, we calculated the cross-correlation coefficients between the CSF signal and global brain activity across different time lags. Following a recent literature4, the negative peak at the 4-second lag was used to represent the strength of the coupling. The results showed that early glaucoma patients present the greatest strength of the coupling (i.e. most negative peak) compared to the late glaucoma patients (One-way ANOVA; main effect of group, P=0.016; early vs late glaucoma, Bonferroni-adjusted P=0.030; Figure 3A) and the healthy controls (early glaucoma vs healthy controls, Bonferroni-adjusted P=0.046; Figure 3A). We also computed the cross-correlation coefficient between the derivative of the global brain activity and the CSF signal. Consistent with a recent study in healthy individuals3, a strong negative correlation was observed at the -2-seconds lag. However, the values did not differ significantly across glaucoma and healthy groups (One-way ANOVA; main effect of group, P=0.328; Figure 3B).
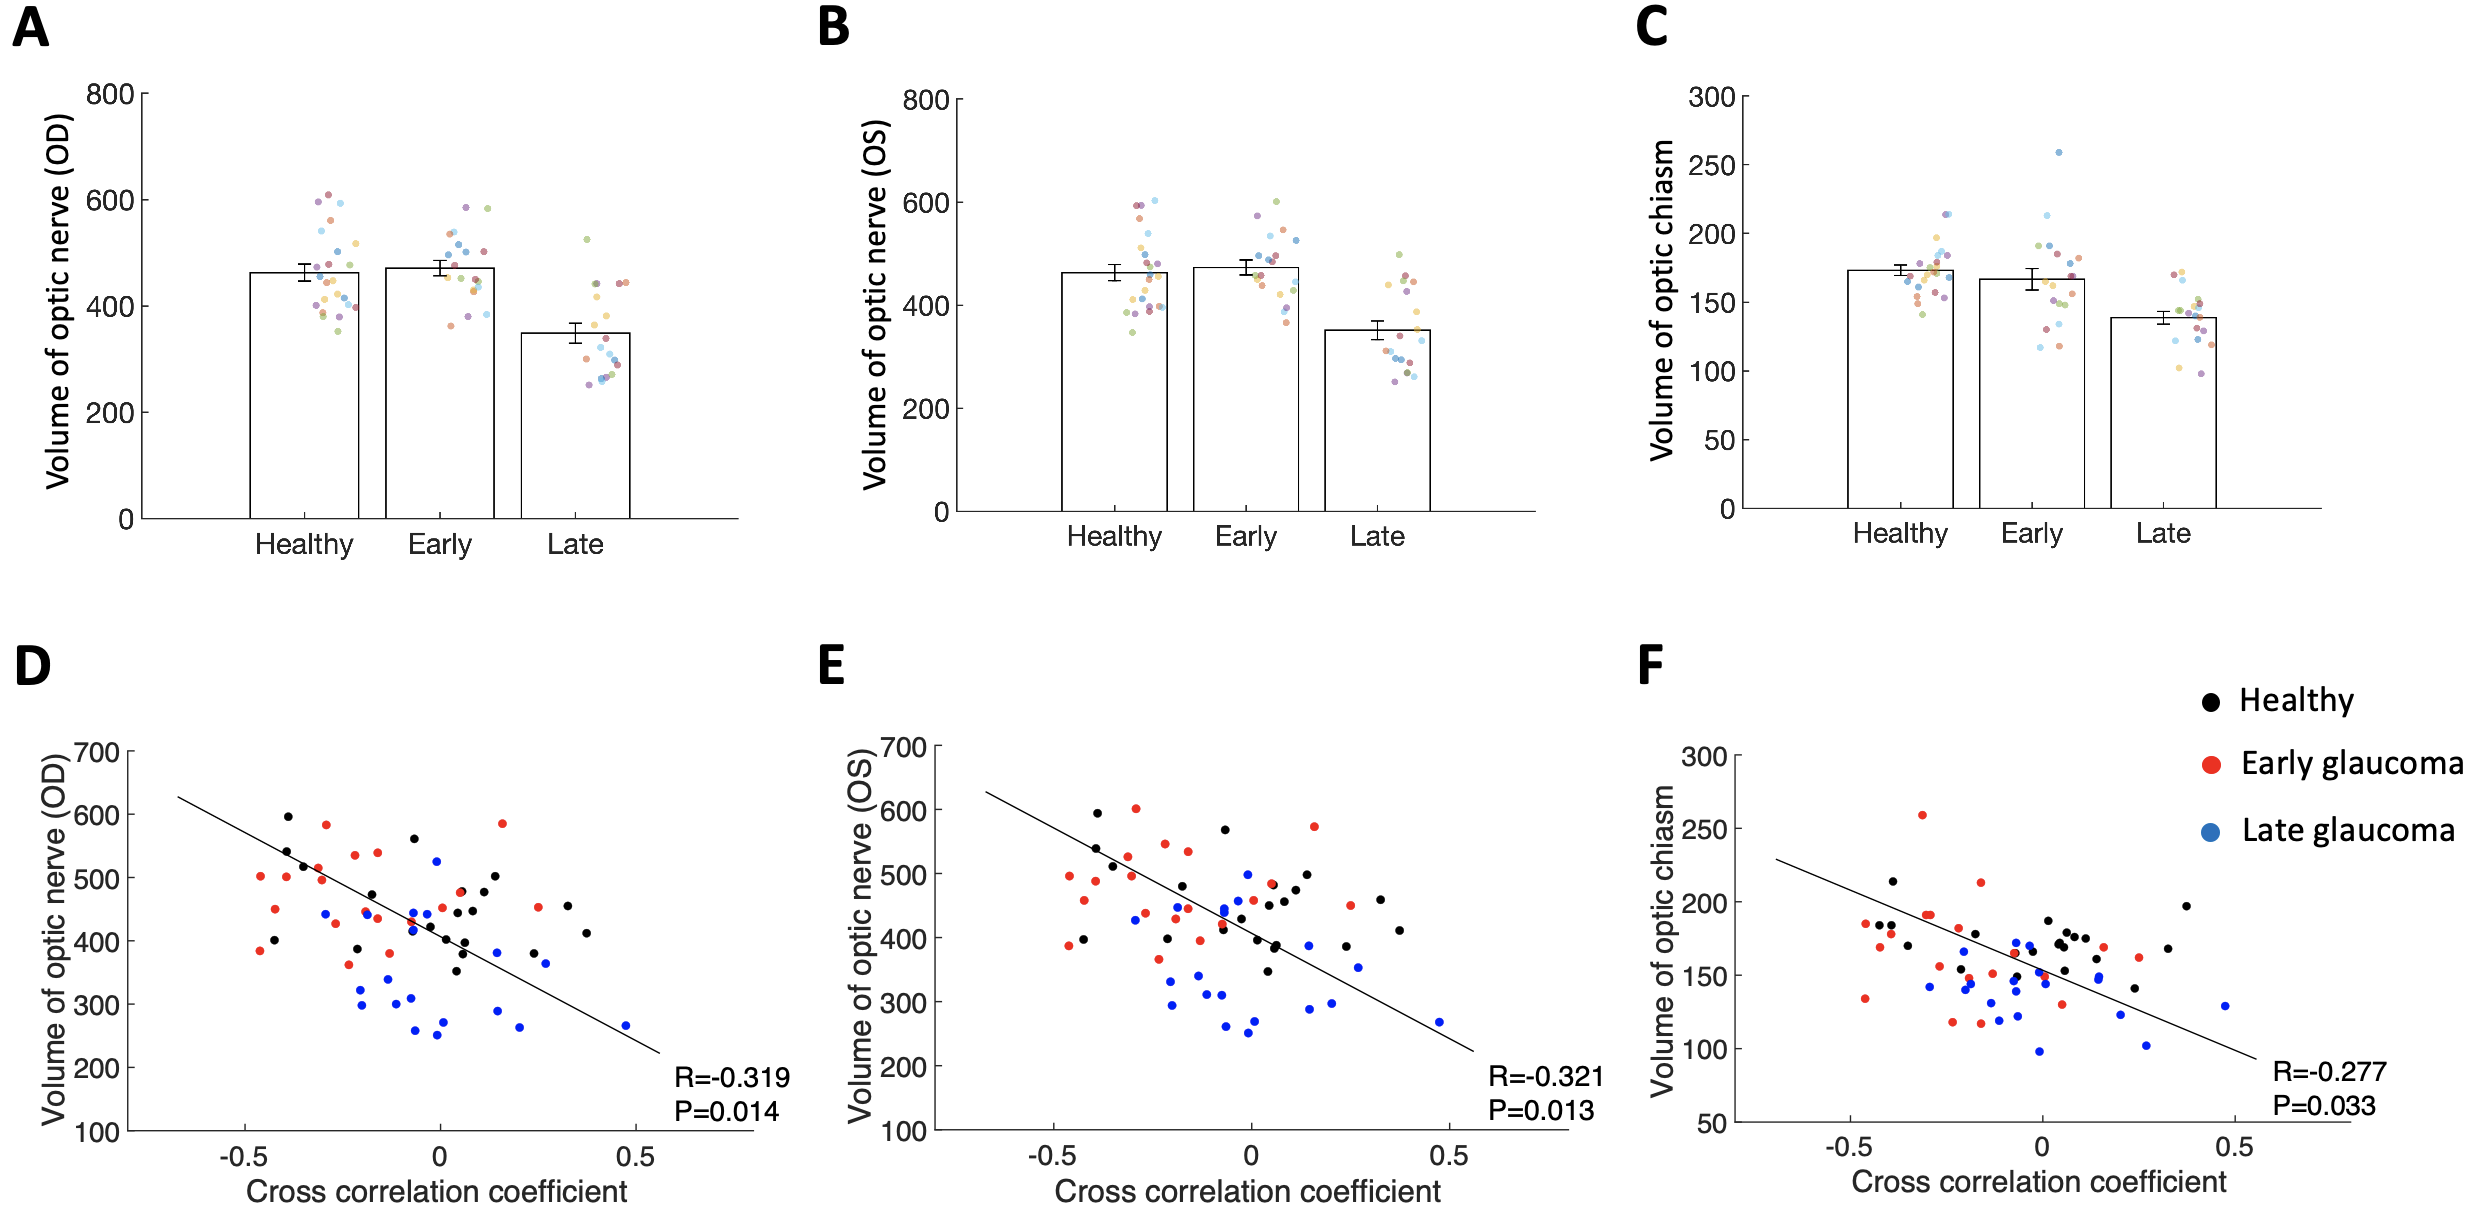
We then further examined whether the strength of the CSF-BOLD coupling (negative peak at the 4-second lag) is associated with the structural volumes along the visual pathway. The volumes of optic nerve and optic chiasm were significantly reduced in the late glaucoma patients compared to healthy controls and early glaucoma patients (one-way ANOVAs; main effect of group, P<0.001; late glaucoma vs healthy controls, Bonferroni-adjusted P<0.01; late vs early glaucoma, Bonferroni-adjusted P<0.01; Figure 4A-C). These structural biomarkers were observed to be negatively correlated with the coupling strength (optic nerve on the right side (OD): Pearson's, R=-0.319, P=0.014, Figure 4D; optic nerve on the left side (OS): R=-0.321, P=0.013, Figure 4E; optic chiasm: R=-0.277, P=0.033, Figure 4F). In other words, weaker coupling strength was associated with the volume loss of the optic nerve and optic chiasm.
Discussion
This study demonstrated that glaucoma involves alterations in CSF flow and its coupling with global brain activity. Early glaucoma patients presented greater power in the low frequency of CSF flow and altered CSF-BOLD coupling compared to late glaucoma patients. These CSF-related changes in early glaucoma patients are in contrast with the observation that the volume of optic nerve and optic chiasm are relatively maintained in the early stage but reduced in the late stage, indicating early physiological changes before irreversible structural loss in the brains of glaucoma. Future studies should expand the range of severity and include glaucoma suspects and pre-perimetric glaucoma patients to determine how early the CSF-related changes occur in the disease spectrum, what leads to the CSF-related changes, and how they interact with different brain structures along the visual pathways.Conclusion
Our study demonstrated that the CSF dynamics as well as its coupling with the global brain activity are altered in early glaucoma patients. This study may open a new line of studies testing the causal effect of CSF on the glaucomatous brain and offering new imaging biomarkers for early detection of glaucoma in the brain.Acknowledgements
This work was supported in part by the National Institutes of Health R01-EY028125 (Bethesda, Maryland); BrightFocus Foundation G2013077, G2016030, G2019103, and G2021001F (Clarksburg, Maryland); and an unrestricted grant from Research to Prevent Blindness to NYU Langone Health Department of Ophthalmology (New York, New York).References
1. Iliff JJ, Wang M, Zeppenfeld DM, Venkataraman A, Plog BA, Liao Y, et al. Cerebral arterial pulsation drives paravascular CSF-interstitial fluid exchange in the murine brain. J Neurosci. 2013;33(46):18190-9.2.
2. Xie L, Kang H, Xu Q, Chen MJ, Liao Y, Thiyagarajan M, et al. Sleep drives metabolite clearance from the adult brain. Science. 2013;342(6156):373-7.3.
3. Yang H-C, Inglis B, Talavage T, Nair VV, Yao J, Fitzgerald B, et al. Coupling brain cerebrovascular oscillations and CSF flow during wakefulness: An fMRI study. bioRxiv. 2021:2021.03.29.437406.4.
4. Han F, Chen J, Belkin-Rosen A, Gu YM, Luo LY, Buxton OM, et al. Reduced coupling between cerebrospinal fluid flow and global brain activity is linked to Alzheimer disease-related pathology. Plos Biology. 2021;19(6).5.
5. Gupta N, Yucel YH. Glaucoma as a neurodegenerative disease. Curr Opin Ophthalmol. 2007;18(2):110-4.
Figures