1212
Sleep and waste clearance: The association of sleep quality with a 7T IVIM imaging derived proxy of interstitial fluid1Department of Radiology & Nuclear Medicine, Maastricht University Medical Center, Maastricht, Netherlands, 2School for Mental Health & Neuroscience, Maastricht University, Maastricht, Netherlands, 3Siemens Healthcare, Erlangen, Germany, 4Department of Psychiatry & Neuropsychology, Maastricht University, Maastricht, Netherlands, 5School for Cardiovascular Disease, Maastricht University, Maastricht, Netherlands, 6Department of Electrical Engineering, Eindhoven University of Technology, Eindhoven, Netherlands
Synopsis
Cerebral clearance is most active during sleep, therefore reduced sleep quality might induce impaired clearance function. Interstitial fluid (ISF) washes waste products from in-between cells through the parenchyma and its volume is found to be regulated by the sleep-wake cycle. Assessment of the ISF-fraction through IVIM can be a potential, non-invasive method to determine sleep-related variations in ISF, without contamination of parenchymal or microvascular diffusion. The current exploratory study investigates the potential of the IVIM-derived ISF-fraction to assess ISF-volume changes in relation to sleep by examining whether these changes are driven by actual hours of sleep or self-reported sleep quality.
Introduction
Recently, spectral decomposition of the intravoxel incoherent motion (IVIM) signal revealed an additional, intermediate, component between the two traditional components (microvascular and parenchymal diffusion).1 The fraction of this component (fint) is argued to reflect interstitial fluid (ISF) within the parenchyma and was suggested to relate to cerebral clearance.1,2 The ISF plays a crucial part in the cerebral clearance system, as it washes the waste products through the parenchyma.3Cerebral clearance is most active during sleep,4,5 therefore reductions in sleep quality might induce impaired clearance function.6 ISF expands during sleep, which facilitates the clearance of waste products from in-between the cells, while the ISF-volume reduces again in awake states.6,7 Previous diffusion studies have observed alterations in general diffusivity measures dependent on sleeping patterns and support the role of underlying ISF-volume on altered clearance.8-10 Decreased diffusivity measures (i.e., axial, radial, and mean diffusivity) were found after sleep deprivation8,9 and a lower apparent diffusion coefficient was found in awake states as compared to sleep.10 However, previous studies have neither examined the effects of long-term subjective sleep deprivation on cerebral diffusivity, nor have they investigated alterations in ISF-volume by specifically isolating the ISF diffusion signal from parenchymal and microvascular diffusivity.
Therefore, the current exploratory study investigates the potential of fint as a marker to non-invasively assess ISF-volume changes in relation to sleep by examining whether these changes are associated to the actual hours of sleep or self-reported sleep quality.
Methods
MRI acquisition: Twenty healthy elderly subjects underwent high-field MRI (7T research system, Siemens Healthcare, Erlangen, Germany) using a 32-element channel phased-array head coil. Diffusion MR images (acquired with a prototype sequence) and anatomical T1-weighted were acquired for all subjects (Table 2).Image analysis: Diffusion Trace images were calculated and corrected for susceptibility induced distortions (topup, FSL version 6.0.1),11 motion and eddy currents (ExploreDTI version 4.8.4).12 Hereafter, images were smoothed with a 3mm FWHM Gaussian kernel (fslmaths, FSL).13
Anatomical T1-weighted images were automatically segmented into gray matter (GM) and white matter (WM) using Freesurfer (version 5.1.0). Resulting masks were coregistered to IVIM image space (FLIRT, FSL).14
Spectral analysis using non-negative least squares (NNLS) was conducted to analyse the IVIM data in a voxel-wise manner.1 The intermediate diffusion component was identified as 1.5*10-3<Diffusivity<4.0*10-3 mm2/s (Figure 1), and the contribution of the intermediate component to the total signal was determined by quantifying the ISF-volume fraction (fint), while correcting for T1- and T2-relaxation effects.1 To solve the NNLS, 80 basis functions were used, logarithmically spaced between .1*10-3 and 200*10-3mm2/s. Additionally, a regularisation smoothing constraint was added, allowing a misfit between 2% and 2.5%. The median value of fint was extracted for WM and GM.
Sleep questionnaire: Sleep quality over the last month was assessed by using the Pittsburgh Sleep Quality Index (PSQI).15 In addition to the clinically used total PSQI (sum of all 7 components), two specific PSQI components were examined: Subjective sleep quality (PSQI 1) and Sleep duration (PSQI 3).
Statistics: Pearson correlations were computed between the PSQI scores and fint for WM and GM (IBM SPSS statistics version 25). To check for potential confounding influences, the analysis was repeated while adjusting for age and time of MRI-acquisition (in minutes after the previous midnight) using partial correlations.
Results
The sample characteristics and descriptive statistics of the PSQI and IVIM measures are summarized in Table 1.A significant negative association is found between PSQI 1 (subjective sleep quality) and WM fint (R=-.454, p=.045), where a worse reported sleep quality relates to lower WM fint (Figure 2) (Table 3). After adjusting for age and time of MRI-acquisition, this association remains to show a trend towards significance (R=-.437, p=.061). No other significant associations were found (Table 3).
Discussion
The current explorative study identified a lower IVIM-derived proxy of ISF-volume (fint) in the WM of subjects who reported a subjective feeling of long-term sleep deprivation. This association was effectively independent of age and the time of MRI-acquisition. A reduction in ISF volume leaves less space for waste products to be cleared from in-between the cells. Thereby, the findings of this study are supportive of an association between sleep function and cerebral clearance.Our findings are in line with previous studies that show reduced general diffusivity measures after sleep deprivation.8,9 However, by isolating ISF from contamination of blood and parenchymal diffusivity, the current study was able to specifically assess ISF-volume alterations in relation to sleep deprivation measurements.
Interestingly, only the self-reported subjective sleep quality and not the actual hours of sleep, was found to be associated to the ISF-fraction. In contrast to the hours of sleep, the sleep quality represents sleep disturbances while accounting for intra-individual variations in need for sleep. The need to correct for intra-individual differences in sleep requirements is thereby further highlighted.16-18 Furthermore, the total PSQI score does not seem sensitive enough to pick up intra-individual sleep variation in relation to ISF-volume.
Our findings highlight the potential of the IVIM-derived ISF-fraction as a non-invasive method to measure ISF alterations related to sleep disturbances. More data is currently being acquired, which will allow for more detailed investigation of the effects of potential confounding factors on the association between self-reported sleep and the ISF-volume.
Acknowledgements
This research was supported by Alzheimer Nederland (research grant WE.03-2018-02).References
1. Wong S, Backes W, Drenthen G, et al. Spectral Diffusion Analysis of Intravoxel Incoherent Motion MRI in Cerebral Small Vessel Disease. Journal of Magnetic Resonance Imaging. 2019.
2. van der Thiel MM, Freeze WM, Verheggen IC, et al. Associations of increased interstitial fluid with vascular and neurodegenerative abnormalities in a memory clinic sample. Neurobiology of Aging. 2021;106:257-267.
3. Abbott NJ. Evidence for bulk flow of brain interstitial fluid: significance for physiology and pathology. Neurochemistry International. 2004;45(4):545-552.
4. Jessen NA, Munk ASF, Lundgaard I, Nedergaard M. The glymphatic system: a beginner’s guide. Neurochemical research. 2015;40(12):2583-2599.
5. Reddy OC, van der Werf YD. The Sleeping Brain: Harnessing the Power of the Glymphatic System through Lifestyle Choices. Brain Sciences. 2020;10(11):868.
6. Mendelsohn AR, Larrick JW. Sleep facilitates clearance of metabolites from the brain: glymphatic function in aging and neurodegenerative diseases. Rejuvenation research. 2013;16(6):518-523.
7. Xie L, Kang H, Xu Q, et al. Sleep Drives Metabolite Clearance from the Adult Brain. Science. 2013;342(6156):373-377.
8. Elvsåshagen T, Norbom LB, Pedersen PØ, et al. Widespread Changes in White Matter Microstructure after a Day of Waking and Sleep Deprivation. PLOS ONE. 2015;10(5):e0127351.
9. Bernardi G, Cecchetti L, Siclari F, et al. Sleep reverts changes in human gray and white matter caused by wake-dependent training. NeuroImage. 2016;129:367-377.
10. Demiral ŞB, Tomasi D, Sarlls J, et al. Apparent diffusion coefficient changes in human brain during sleep–Does it inform on the existence of a glymphatic system? Neuroimage. 2019;185:263-273.
11. Andersson JL, Skare S, Ashburner J. How to correct susceptibility distortions in spin-echo echo-planar images: application to diffusion tensor imaging. Neuroimage. 2003;20(2):870-888.
12. Leemans A, Jeurissen B, Sijbers J, Jones D. ExploreDTI: a graphical toolbox for processing, analyzing, and visualizing diffusion MR data. Paper presented at: Proc Intl Soc Mag Reson Med2009.
13. Jenkinson M, Beckmann CF, Behrens TE, Woolrich MW, Smith SM. FSL. Neuroimage. 2012;62(2):782-790.
14. Jenkinson M, Bannister P, Brady M, Smith S. Improved optimization for the robust and accurate linear registration and motion correction of brain images. Neuroimage. 2002;17(2):825-841.
15. Buysse DJ, Reynolds III CF, Monk TH, Berman SR, Kupfer DJ. The Pittsburgh Sleep Quality Index: a new instrument for psychiatric practice and research. Psychiatry research. 1989;28(2):193-213.
16. Mercer PW, Merritt SL, Cowell JM. Differences in reported sleep need among adolescents. Journal of Adolescent Health. 1998;23(5):259-263.
17. Ursin R, Bjorvatn B, Holsten F. Sleep Duration, Subjective Sleep Need, and Sleep Habits of 40- to 45-Year-Olds in the Hordaland Health Study. Sleep. 2005;28(10):1260-1269.
18. Landry G, Best J, Liu-Ambrose T. Measuring sleep quality in older adults: a comparison using subjective and objective methods. Frontiers in Aging Neuroscience. 2015;7(166).
Figures
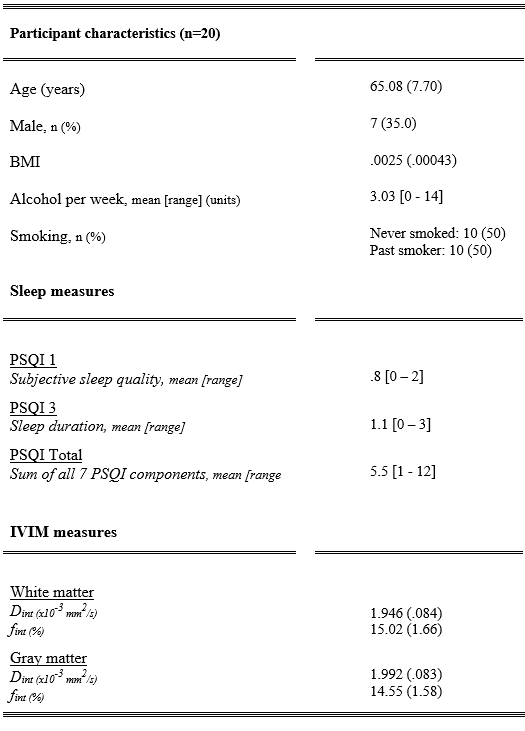
Abbreviations: IVIM = intravoxel incoherent motion, Dint = interstitial fluid diffusion, fint = interstitial fluid fraction, PSQI = Pittsburgh Sleep Quality Index, BMI = Body mass index.
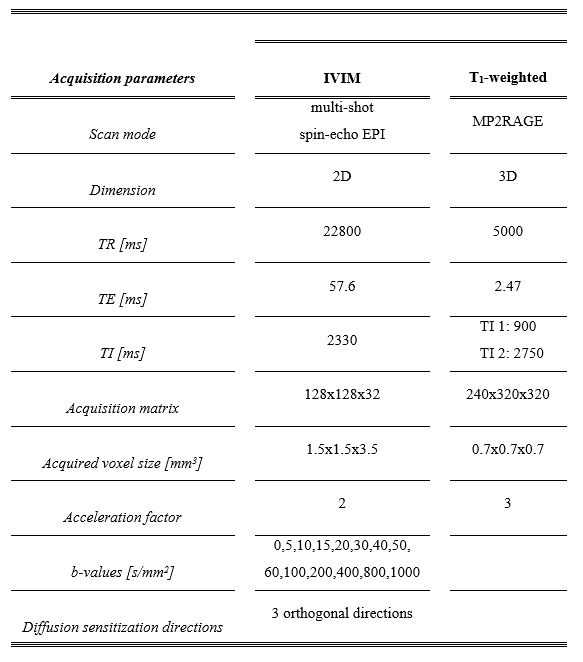
Abbreviations: IVIM = intravoxel incoherent motion; TR = repetition time; TE = echo time; TI = inversion time; EPI = echo planar imaging.
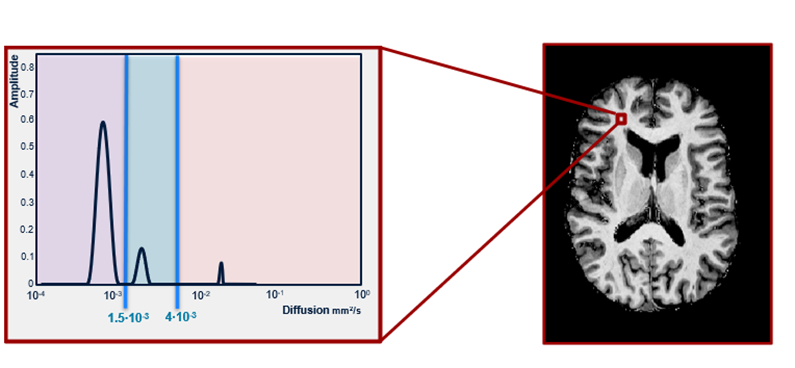
purple = parenchymal diffusion range, blue = intermediate diffusion range, pink = microvascular pseudodiffusion range.
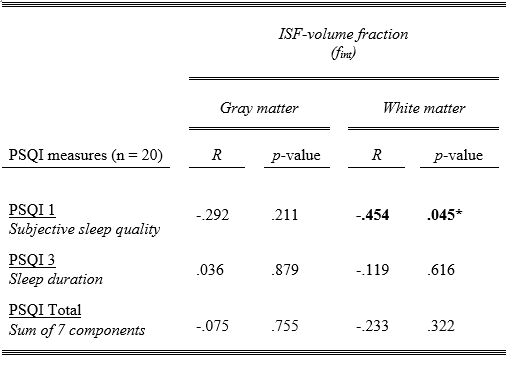
Abbreviations: fint = interstitial fluid fraction, PSQI = Pittsburgh Sleep Quality Index, R = Pearson correlation.
* p < 0.05.
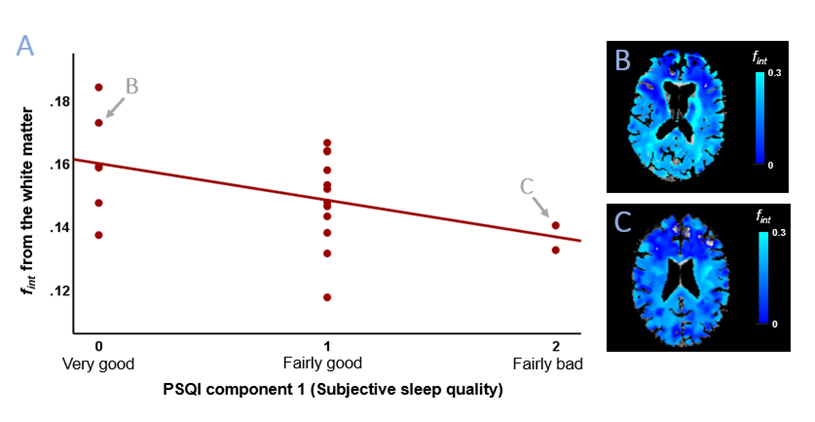
Figure 2. Scatterplot of fint from the white matter with PSQI component 1 scores (subjective sleep quality during the past month) (A). A least-square linear regression line is added for visualization. Arrows point to the participants used to present exemplary fint maps of the whole parenchyma overlaid on the anatomical T1-weighted image in native IVIM space, i.e., a subject with a low PSQI 1 score and high white matter fint (B) and a subject with a high PSQI 1 score and low white matter fint (C).
Abbreviations: fint = interstitial fluid fraction, PSQI = Pittsburgh Sleep Quality Index.