1211
In vivo CSF Flow During Central Sensitization Using Fourier Velocity Encoded MRI at 21.1 T
Dayna L. Richter1,2, Samuel W. Holder1,2, and Samuel C. Grant1,2
1National High Magnetic Field Laboratory, Florida State University, Tallahassee, FL, United States, 2Chemical & Biomedical Engineering, FAMU-FSU College of Engineering, Tallahassee, FL, United States
1National High Magnetic Field Laboratory, Florida State University, Tallahassee, FL, United States, 2Chemical & Biomedical Engineering, FAMU-FSU College of Engineering, Tallahassee, FL, United States
Synopsis
Cerebrospinal fluid (CSF) flow was evaluated temporally in a preclinical migraine model at 21.1 T. As elevated sodium levels are implicated in the progression of migraine, evaluating how sodium is transported in the ventricular system and brain should provide insight on bulk sodium accumulation around, among and within anatomical regions implicated in migraine. A series of Fourier Velocity Encoding MRI was acquired over 2 h post-nitroglycerin injection to evaluate CSF flow during the progression of central sensitization.
Introduction
Increased sodium levels in cerebrospinal fluid (CSF) due to alterations in Na+/K+-ATPase activity in the choroid plexuses is a potential mechanism of hyperexcitability in disorders such as migraine.1 CSF flow is influenced by production and transport at the choroid plexus, and as such, flow may be affected by alterations in choroid plexus activity. The goal of this study is to characterize the onset and progression of acute nitroglycerin (NTG)-triggered central sensitization by mapping CSF flow in the ventricular system of the male Sprague-Dawley rat model.In vivo characterization of CSF flow was performed at 21.1 T using 1H Fourier Velocity Encoding (FVE) MRI to monitor velocity distributions during the progression of central sensitization.2 These methods permit for the acute characterization of CSF velocity over a timeframe encompassing the initial trigger as well as the progression of sensitization leading to nociception, allowing for visualization of a potential transport mechanism responsible for sodium accumulation within the CSF-containing neural structures.
Methods
Animal Model: Male Sprague Dawley rats (220-250 g) were assigned to an NTG group (n=5) or a saline control group (n=5). The animals were anesthetized using 3-5% isoflurane for the insertion of an intraperitoneal (IP) infusion line before being loaded into the vertical magnet. Animals were maintained using 2-3% isoflurane. Using the IP line, the NTG group was administered 10 mg/kg bodyweight while the control group was given an equivalent volume of saline.MR Acquisitions: The ultra-wide bore 21.1-T, 900-MHz vertical magnet at the US National High Magnetic Field Laboratory was used for in vivo imaging. Once in the scanner, baseline FVE MRI scans were acquired. Following the infusion at t=0, the progression of central sensitization was captured by a series of repeated 10-min FVE scans acquired every 20 min out to 2 h post-NTG. Whole-brain multi-slice FVE images were acquired over the read, phase and slice directions at a spatial resolution of 0.2 x 0.2 x 0.8 mm3 using 16 flow encoding steps ranging between -240 and +240 cm/s. This setup resulted in a flow resolution of 30 cm/s, which covers the range of CSF and arterial flow.
Data Processing & Analysis: Data was Fourier transformed in three dimensions, two spatial spatial (coronal orientation) and one flow to generate multi-slice flow maps (Figure 1) over the entire brain. Statistical analysis was done using JMP Pro 16 using a mixed model and an AR repeated covariance structure. Statistical significance was reported at p<0.05.
Results and Discussion
Figure 1 represents an single representative slice of the FVE dataset displaying a velocity-encoded intensity image including the fourth ventricle.Extracerebral CSF flow intensities were evaluated in the positive and negative z-directions over the course of 2 h during NTG-triggered central sensitization. Figure 2 shows some instability of CSF flow in the extracerebral space with an initial drop in flow, a recovery, and another drop during NTG-triggered central sensitization. This interesting trend is maintained over several trials.
Figure 2 also shows that the CSF flow in the extracerebral space decreases steadily with time for 2 h post saline injection. This trend may be due to the vertical orientation of the rat or time under isoflurane anesthesia. Regardless, the saline control stands in stark and significant contrast to the NTG CSF flow distribution,
Previous work done by Abad et al. found increased sodium in certain ventricular and ventricular-related regions such as the brainstem, extracerebral CSF, cisterna magna and cerebellum using sodium CSI in the same acute preclinical NTG migraine model.3 The current work focuses on the ventricular system looking at flow changes in the lateral, third and fourth ventricles, cerebral aqueduct and cisterna magna allowing the visualization of potential accumulation points of sodium due to flow in ventricular anatomical regions.
Conclusions
NTG-triggered central sensitization resulted in a CSF flow instability in the extracerebral space, while the saline control showed a sustained decrease in extracerebral CSF flow.This study is aimed at evaluating CSF flow to provide insight on how sodium-containing CSF may fluctuate during a migraine. These findings support the possibility that CSF flow is altered initially with acutely triggered central sensitization, which may reflect activity at the choroid plexuses with respect to CSF production and sodium transport.
Such data should inform modeling efforts targeting sodium accumulation driven by CSF flow related to the hyperexcitability of neuroanatomical structures such as the brainstem, trigeminal complex, and thalamus implicit in the progression of migraine.
Acknowledgements
This work is supported by the US NIH (RO1-NS072497) and conducted at the National High Magnetic Field Laboratory, which is funded by the National Science Foundation (DMR-1644779) and the State of Florida. This work was conducted in accordance with Huntington Medical Research Institute and Florida State University’s Animal Care and Use Committees.References
- Harrington MG, Fonteh AN, Cowan RP, et al. Cerebrospinal fluid sodium increases in migraine. Headache. 2006;46(7):1128-1135.
- Rispoli VC, Carvalho JLA, Miosso CJ, Soares FA. Fourier Velocity Encoded MRI: Acceleration and Velocity Map Estimation. In: High-Resolution Neuroimaging - Basic Physical Principles and Clinical Applications. InTech; 2018.
- Abad N, Rosenberg JT, Hike DC, Harrington MG, Grant SC. Dynamic sodium imaging at ultra-high field reveals progression in a preclinical migraine model. Pain. 2018;159(10):2058-2065.
Figures
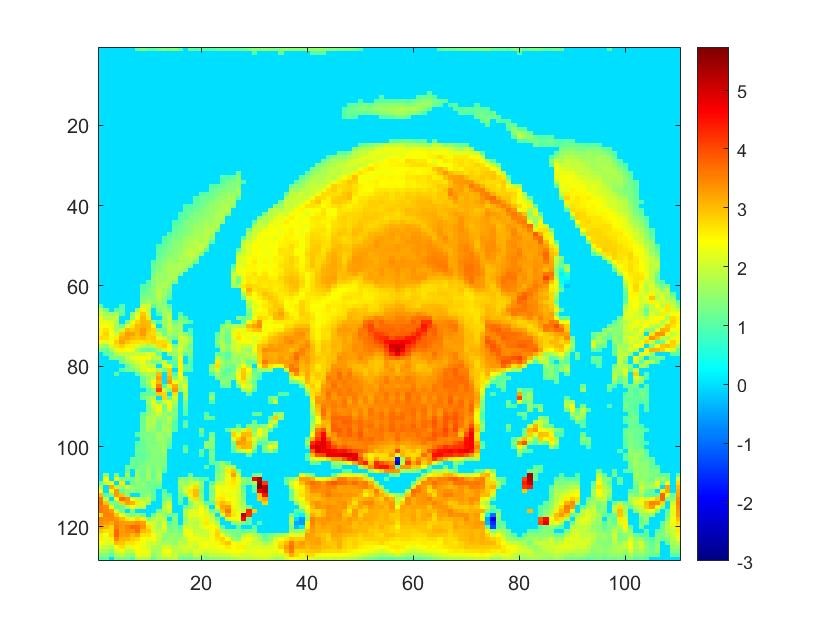
Figure 1. Representative velocity (cm/s) image acquired using Fourier Velocity
Encoding MRI. Slice includes the fourth ventricle and extracerebral CSF as particular regions of interest.
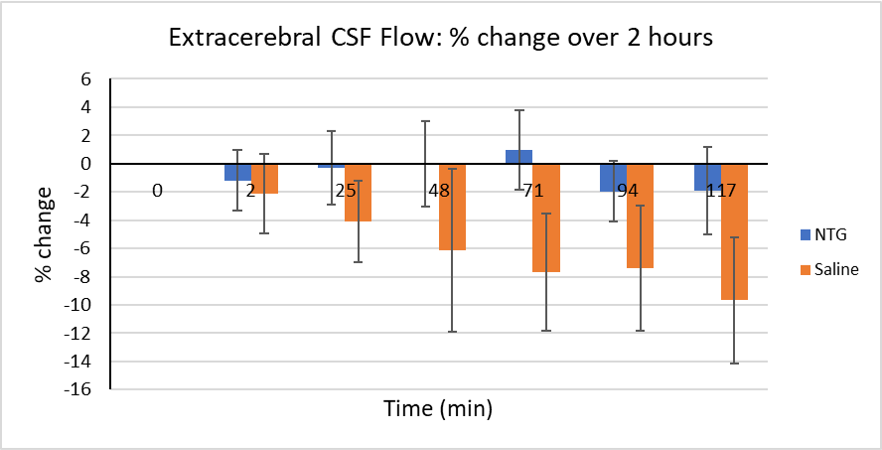
Figure 2. Extracerebral
CSF flow percent change over 2 h following in situ injection with either NTG (to trigger central sensitization) or saline (as a control). Significance is designated at the p<0.05 level.
DOI: https://doi.org/10.58530/2022/1211