1209
Using diffusion kurtosis imaging to measure glymphatic system related changes during human sleep1BSMS, University of Sussex, Brighton, United Kingdom, 2Cardiff University, Cardiff, United Kingdom
Synopsis
Glymphatic clearance has been associated with an increase in interstitial volume fraction during sleep. Higher order diffusion weighted MRI images were acquired of awake and sleeping participants to investigate glymphatic system related changes. Sleep was associated with a significant decrease in kurtosis measures. Clusters with significant decrease in radial kurtosis were located in default mode network areas, occipital cortex, thalamus, midbrain and temporal lobe. Decrease in kurtosis is in line with the glymphatic system hypothesis, as diffusion becomes more Gaussian when it is less restricted, which expected with the increase in interstitial space volume.
Introduction
The brain lacks conventional lymphatic vessels. However, it has its own unique waste clearance system, the glymphatic system1, 2 which utilizes cerebrospinal fluid (CSF) influx to perivascular space and the exchange of CSF with interstitial fluid to clear toxic metabolites and proteins associated with neurodegeneration1, 3, 4, 5. Injection studies in rodents indicate that the glymphatic system is active during slow wave sleep6, 7. Glymphatic clearance has been associated with an expansion of the interstitial space during sleep6, 8. Studying the glymphatic system is important for improving our understanding of basic central nervous system physiology, how misfolded proteins are cleared, how systemic and brain immune system communicate and further our understanding of the need for sleep. We need non-invasive techniques to gain better understanding of this system in humans. However, imaging the glymphatic system is not straight-forward, as reflected by the limited number of published articles. To our knowledge, only one published study to date has used diffusion weighted MRI to quantify glymphatic system related changes during sleep in humans9. This study utilized a range of b-values (<1000 s/mm2) along 3 orthogonal directions and estimated “fast” and “slow” apparent diffusion coefficient (ADC). However, ADC measures alone may be too simplistic to uncover glymphatic system related microstructural changes. Higher order diffusion models, such as diffusion kurtosis imaging, allow the assessment of non-Gaussian diffusion, which may be more sensitive to changes in interstitial volume associated with sleep. Specifically, we hypothesised that a change in the relative volume fractions of intra- and extra-cellular diffusion would affect diffusion kurtosis.Methods
21 young healthy participants (6 females, 22.3 ± 3.2 years) were scanned in two separate sessions. In one session they were asked to arrive at the imaging centre after a full night’s sleep. In the other, they were asked to remain awake for the entire night and received 10mg Zolpidem 30 minutes before the scan to increase the probability of sleep in the scanner. All scans took place between 09:30AM and 10:30AM.Compliance with sleep deprivation was determined by wearable sleep sensor recording over the 24-hours prior to scanning. Subjective sleepiness was assessed using the Karolinska Sleepiness Scale. Sleep during scanning was monitored by a combination of heart/respiration rate measures and button press response.
The MRI session included high-resolution T1-weighted image (MPRAGE), arterial spin labelling (not shown here) and diffusion weighted MRI acquired on Siemens Prisma 3T scanner. Diffusion measurements were taken over 2 shells (b = 800 and 2600 s/mm2), sampled in 32 and 64 directions respectively with a single shot, twice-refocused spin echo and an echo planar readout10. Images were acquired with the following parameters: TR= 4100ms, TE= 87, Flip angle= 90, FOV= 240 x 240mm2, Matrix size= 96x96, Slices= 60, Multiband factor= 2, GRAPPA reduction factor= 2. The diffusion weighted images were corrected for motion and eddy current induced distortions using FMRIB Software Library (FSL, version 6.0.1)11. Diffusion Kurtosis Imaging (DKI) was fitted with the DiffusionKurtosisModel from the DIPY library12 and DKI images registered to the MPRAGE. Normalization parameters obtained from segmentation of MPRAGE were used to warp the DKI images into MNI space. 3D Gaussian smoothing with FWHM= 6mm was applied to the normalized images. DKI images were then compared between sessions using a paired-sample t-test in SPM12.
Results
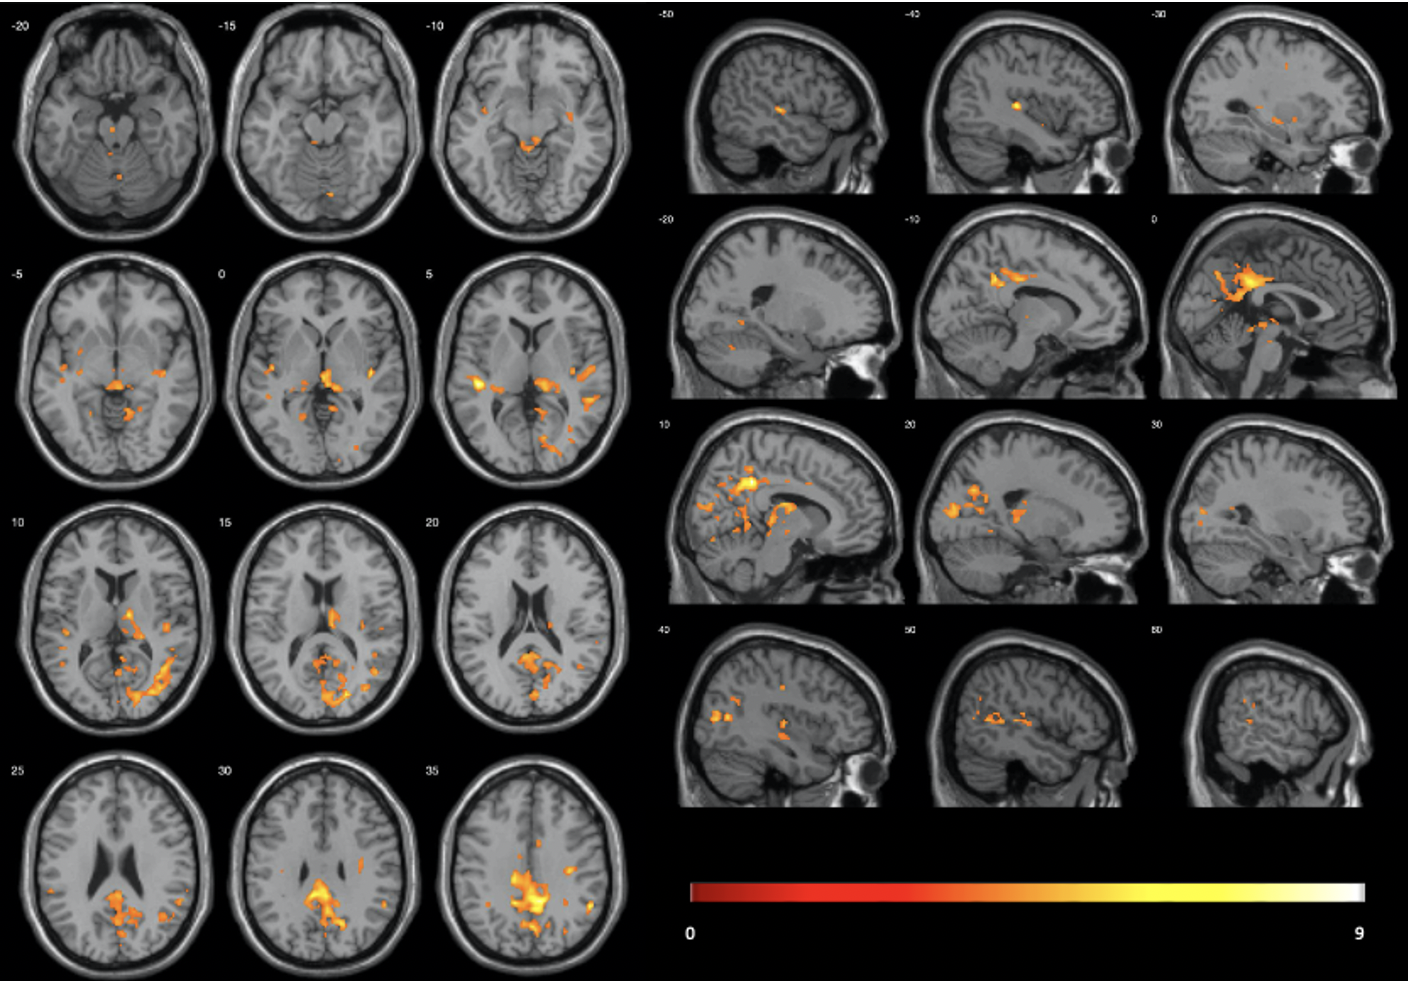
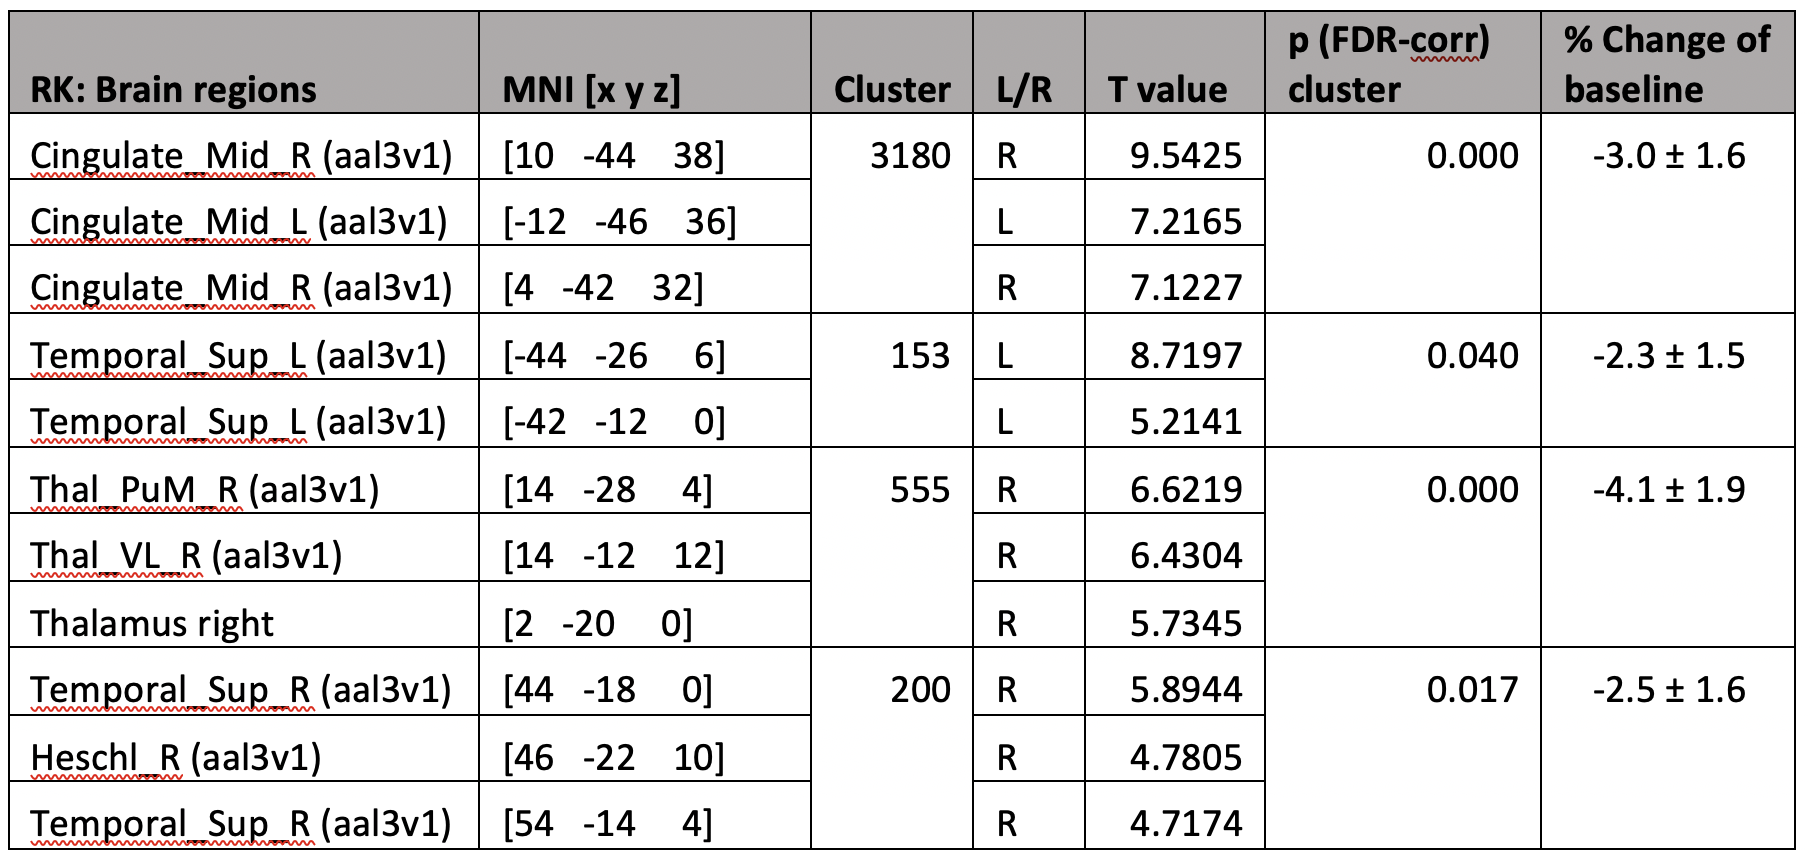
5 participants were excluded from final analysis for not sleeping (N=2) or motion artifacts (N=3). Significant radial kurtosis (RK) clusters and the corresponding percentage change are summarized in Figure 1 and Table 1. The largest cluster (size= 3180 voxels) is centred at bilateral posterior and middle cingulate and extends to precuneus, cuneus, and runs through the right middle occipital cortex touching onto the middle temporal lobe. There is a large cluster (size= 555 voxels) running from the right thalamus through the third ventricle towards the cerebellum and touches onto the midbrain. Two clusters touch onto the superior temporal gyrus bilaterally.The statistical map of MK changes was overlapping with that relative to RK changes, and no significant regional changes were observed in the AK, it is reasonable to conclude that the change in MK is driven by change in RK.
Discussion
Diffusion kurtosis analysis indicated global (not shown here) as well as region-wise reduction in kurtosis during sleep, which was driven by reduction in RK. A decrease in kurtosis might reflect an increase in interstitial space volume fraction, as diffusion becomes more Gaussian when it is less restricted13. A significant decrease in kurtosis was observed in brain regions involved in SWA generation (e.g., brainstem, thalamus) and in areas that are particularly active during wake e.g., regions associated with the default mode network14, 15, 16, 17. Based on these observations, i.e., increased glymphatic clearance in areas extensively used during wake, we speculate that local homeostatic control sleep has evolved to clear metabolites formed during high activity during wake.Conclusion
Modelling kurtosis is a promising technique for imaging glymphatic system related changes during sleep.Acknowledgements
No acknowledgement found.References
1. Iliff, J., Wang, M., Liao, Y., Plogg, B., Peng, W., Gundersen, G., Benveniste, H., Vates, G., Deane, R., Goldman, S., Nagelhus, E. and Nedergaard, M., 2012. A Paravascular Pathway Facilitates CSF Flow Through the Brain Parenchyma and the Clearance of Interstitial Solutes, Including Amyloid. Science Translational Medicine, 4(147).
2. Iliff, J. and Nedergaard, M., 2013. Is There a Cerebral Lymphatic System?. Stroke, 44(6, Supplement 1), pp.S93-S95.
3. Iliff, J., Chen, M., Plog, B., Zeppenfeld, D., Soltero, M., Yang, L., Singh, I., Deane, R. and Nedergaard, M., 2014. Impairment of Glymphatic Pathway Function Promotes Tau Pathology after Traumatic Brain Injury. The Journal of Neuroscience, 34(49), pp.16180-16193.
4. Peng, W., Achariyar, T., Li, B., Liao, Y., Mestre, H., Hitomi, E., Regan, S., Kasper, T., Peng, S., Ding, F., Benveniste, H., Nedergaard, M. and Deane, R., 2016. Suppression of glymphatic fluid transport in a mouse model of Alzheimer's disease. Neurobiology of Disease, 93, pp.215-225.
5. Arbel-Ornath, M., Hudry, E., Eikermann-Haerter, K., Hou, S., Gregory, J., Zhao, L., Betensky, R., Frosch, M., Greenberg, S. and Bacskai, B., 2013. Interstitial fluid drainage is impaired in ischemic stroke and Alzheimer’s disease mouse models. Acta Neuropathologica, 126(3), pp.353-364.
6. Xie, L., Kang, H., Xu, Q., Chen, M., Liao, Y., Thiyagarajan, M., O'Donnell, J., Christensen, D., Nicholson, C., Iliff, J., Takano, T., Deane, R. and Nedergaard, M. (2013). Sleep Drives Metabolite Clearance from the Adult Brain. Science, 342(6156), pp.373-377.
7. Benveniste, H., Lee, H., Ding, F., Sun, Q., Al-Bizri, E., Makaryus, R., Probst, S., Nedergaard, M., Stein, E. and Lu, H. (2017). Anesthesia with Dexmedetomidine and Low-dose Isoflurane Increases Solute Transport via the Glymphatic Pathway in Rat Brain When Compared with High-dose Isoflurane. Anesthesiology, 127(6), pp.976-988.
8. Ding, F., O’Donnell, J., Xu, Q., Kang, N., Goldman, N. and Nedergaard, M., 2016. Changes in the composition of brain interstitial ions control the sleep-wake cycle. Science, 352(6285), pp.550-555.
9. Demiral, Ş., Tomasi, D., Sarlls, J., Lee, H., Wiers, C., Zehra, A., Srivastava, T., Ke, K., Shokri-Kojori, E., Freeman, C., Lindgren, E., Ramirez, V., Miller, G., Bandettini, P., Horovitz, S., Wang, G., Benveniste, H. and Volkow, N. (2019). Apparent diffusion coefficient changes in human brain during sleep – Does it inform on the existence of a glymphatic system?. NeuroImage, 185, pp.263-273.
10. Reese, T., Heid, O., Weisskoff, R. and Wedeen, V., 2003. Reduction of eddy-current-induced distortion in diffusion MRI using a twice-refocused spin echo. Magnetic Resonance in Medicine, 49(1), pp.177-182.
11. Andersson, J., Graham, M., Zsoldos, E. and Sotiropoulos, S., 2016. Incorporating outlier detection and replacement into a non-parametric framework for movement and distortion correction of diffusion MR images. NeuroImage, 141, pp.556-572.
12. Garyfallidis, E., Brett, M., Amirbekian, B., Rokem, A., van der Walt, S., Descoteaux, M. and Nimmo-Smith, I., 2014. Dipy, a library for the analysis of diffusion MRI data. Frontiers in Neuroinformatics, 8.
13. Assaf, Y. and Basser, P., 2005. Composite hindered and restricted model of diffusion (CHARMED) MR imaging of the human brain. NeuroImage, 27(1), pp.48-58.
14. Krout, K., Belzer, R. and Loewy, A., 2002. Brainstem projections to midline and intralaminar thalamic nuclei of the rat. The Journal of Comparative Neurology, 448(1), pp.53-101.
15. Steriade, M., Contreras, D., Curro Dossi, R. and Nunez, A., 1993. The slow (< 1 Hz) oscillation in reticular thalamic and thalamocortical neurons: scenario of sleep rhythm generation in interacting thalamic and neocortical networks. The Journal of Neuroscience, 13(8), pp.3284-3299.
16. Steriade, M., & Amzica, F., 1998. Coalescence of sleep rhythms and their chronology in corticothalamic networks. Sleep research online : SRO, 1(1), pp.1–10.
17. Raichle, M., MacLeod, A., Snyder, A., Powers, W., Gusnard, D. and Shulman, G., 2001. A default mode of brain function. Proceedings of the National Academy of Sciences, 98(2), pp.676-682.
Figures