1208
Simultaneous measurement of dynamic CBF and CSF signal changes with pseudo-continuous arterial spin labeling1Department of Bio and Brain Engineering, Korea Advanced Institute of Science and Technology, Daejeon, Korea, Republic of
Synopsis
To measure CBF and CSF signals simultaneously, we proposed a new 2D EPI-based pCASL with overlapping portion of the labeling plane and imaging region. Our results showed that signal difference between label and control scans in the overlapping portion were higher in CSF than in other tissues. In addition, the pCASL-based CSF signals were negatively correlated with CBF, which was more significant than correlations of CBF with other tissues or baseline raw CSF signals. Based on the results, pCASL can be used for simultaneous measurement of dynamic CBF and CSF signal changes with our technique, which warrants further investigation.
Introduction
Previous studies revealed that the interaction between brain activations and cerebrospinal fluid (CSF) flow is important for maintaining a healthy brain1. Recently, there are trials of using EPI-based fMRI to find relationships between brain activation and CSF movement by comparing global blood oxygen level dependent (BOLD) signals with CSF signals extracted from the ventricle2. BOLD, however, is an indirect and mixed signal, so its biological meaning is hard to explain. On the other hand, cerebral blood flow (CBF) is a direct indicator, can be dynamically measured with MRI noninvasively, and has not been investigated in terms of correlation with CSF movement. In this study, CBF and CSF signals are measured simultaneously and dynamically with pseudo-continuous arterial spin labeling (pCASL) for the first time to our knowledge.Method
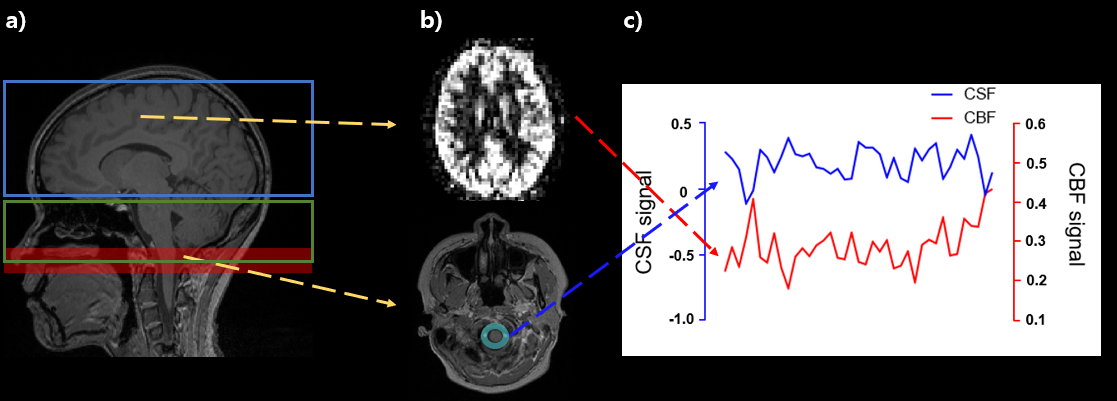
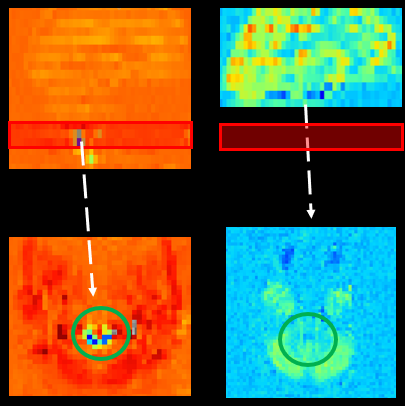
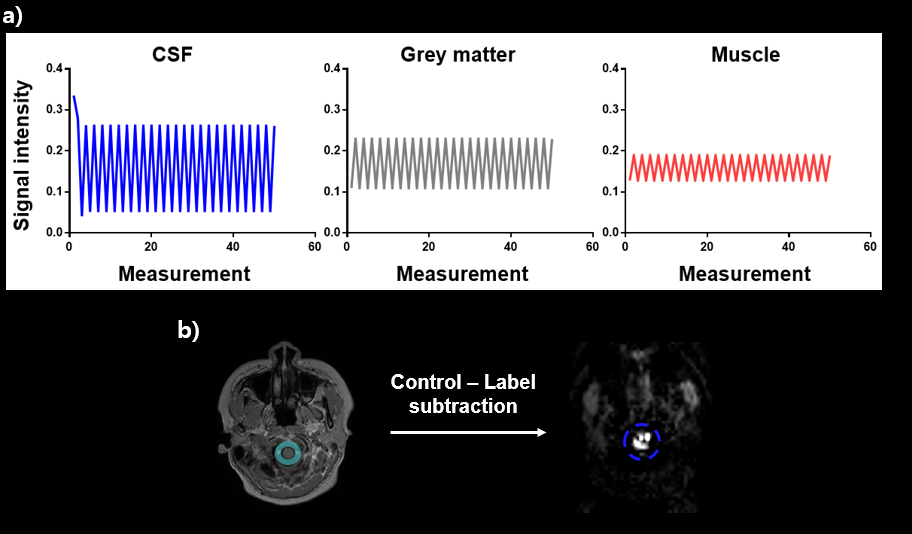
Simulation : We simulated the proposed CSF signal using a discrete-time solution of the Bloch equation, which consists of the RF pulse rotation matrices and exponential decay of the magnetization, following pCASL RF events with background suppresion3. CSF signals was assumed to pulsate repeatedly in the labeling plane. Gray matter (GM) and muscle signals were also simulated with different T1/T2 for comparison (CSF, T1=3817ms, T2=2030ms; GM, T1=1820ms, T2=99ms; muscle,T1=1412ms, T2=50ms).Experiment : We scanned 8 participants (age : 21~27) on a Siemens Verio 3T MRI. For pCASL scan, we used 1.5s post-labeling delay(PLD), 1.8s labeling duration, 70mm label plane offset (inferior border of cerebellum4), and background suppression. Also for pCASL, we scanned the cortical part of the brain first (13 slices) and then scanned the ventricle part (6 slices) later for effective measurement of blood perfusion signals (Fig 1,a). To check the labeling effects on CSF signals, we scanned pCASL with label positions on the inside/outside of imaging FOV for one participant (Fig 2). All the other 7 participants were scanned at one labeling position. pCASL scan was performed dynamically with 40 measurements. M0 equilibrium images were acquired with 10 measurements.
Analysis : We subtracted label images from control images, which were normalized with the M0 images. For some subjects, the pCASL-based CSF signals showed negative values, presumably related to different z distance of the label plane from the isocenter5, and thus the signal polarity was reversed in those cases. The correlation between the pCASL-based CSF and CBF signals was evaluated with Pearson correlation coefficient, and compared with correlations between CBF and other signals such as signals from other tissues, raw CSF signals from the edge slice, and raw CSF signals from the fourth ventricle.
Result
Simulation : Our simulation results show that signal differences between label and control periods in CSF (0.264) were much bigger than those in GM (0.061) and muscle (0.12) (Fig 3, a).Label plane position : CSF signals from pCASL with different label plane positions (n=1) qualitatively revealed signal characteristics on the slices placed in a label plane. When the label plane was positioned inside imaging FOV, CSF signal changes were clearly detected in the overlapping slice and no significant CSF signal changes were found when the label plane was on the outside of FOV (Fig 2).
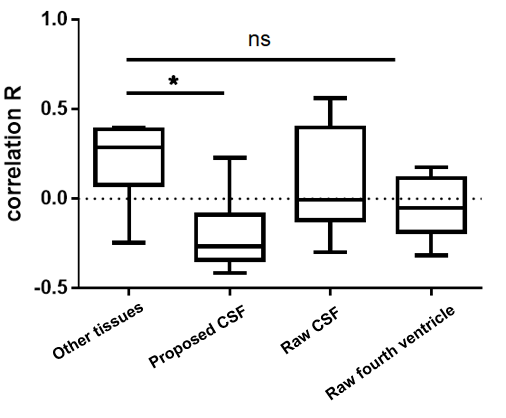
Correlation between CSF and CBF : The correlation coefficients between CSF and CBF signals were negative in 6 subjects out of 7 (M = -0.19086). The four different correlation coefficients (CSF - CBF, other tissues - CBF, raw CSF in the edge slice - CBF, and raw CSF from the fourth ventricle - CBF) showed significantly different values (p <.01, Friedman test). Multiple comparisons show that the correlation of CSF - CBF was significantly higher than that of other tissues - CBF (p<.01, Dunn’s multiple comparisons tests), but those of raw CSF signals (raw CSF signals in the edge slice and in the fourth ventricle) were not significantly different from that of other tissues - CBF (Fig 4).
Discussion
The results from the different label plane positions corresponded to our simulation results. The existence of the pCASL-based CSF signals only in the case of overlapping between the label plane and imaging FOV indicates that the detected CSF signal changes are related to CSF volume or T1 recovery rather than CSF flow. Also the stronger correlation of CSF - CBF than the other three correlations supports that the CSF signals from the baseline EPI are not a good indicator and that the proposed CSF signals from the subtraction between label-control scans of pCASL are a useful indicator. Overall, these results demonstrate that CSF signals can be extracted simultaneously with CBF signals using pCASL.Monro-Kellie doctrine demonstrated that the net summation of brain volume, CSF, and intracerebral blood are maintained at a constant value6. Our pCASL-based CSF signal showed negative correlations with the CBF signal, suggesting that increase in CBF results in decreases in CSF or vice versa, consistent with the doctrine.
Conclusion
In this study, we simulated CSF signal changes in pCASL sequence and established a novel technique that can simultaneously measure CSF and CBF signals. In addition, we also firstly studied the relationship between CBF and CSF signals with pCASL dynamically during the resting state and found negative correlations between CBF and CSF, which was consistent with Monro-Kellie doctrine.Acknowledgements
No acknowledgement found.References
[1] Han F, Chen J, Belkin-Rosen A, Gu Y, Luo L, et al. “Reduced coupling between cerebrospinal fluid flow and global brain activity is linked to Alzheimer disease–related pathology.” PLOS Biology 19(6) (2021): e3001233. https://doi.org/10.1371/journal.pbio.3001233
[2] Fultz, Nina E et al. “Coupled electrophysiological, hemodynamic, and cerebrospinal fluid oscillations in human sleep.” Science (New York, N.Y.) vol. 366,6465 (2019): 628-631. doi:10.1126/science.aax5440
[3] Benoit-Cattin, Hugues, et al. "The SIMRI project: a versatile and interactive MRI simulator." Journal of Magnetic Resonance 173.1 (2005): 97-115.
[4] Alsop DC, Detre JA, et al. “Recommended implementation of arterial spin-labeled perfusion MRI for clinical applications: A consensus of the ISMRM perfusion study group and the European consortium for ASL in dementia.” Magn Reson Med. 73(1) (2015): 102-16.
[5] Wu WC, Fernández-Seara M, Detre JA, Wehrli FW, Wang J. “A theoretical and experimental investigation of the tagging efficiency of pseudocontinuous arterial spin labeling.” Magn Reson Med. 58(5) (2007): 1020-7.
[6] Kellie G. “Appearances observed in the dissection of two individuals; death from cold and congestion of the brain.” Trans Med-Chir Soc Edinburgh. (1824): 1-84.
Figures