1207
Assessment of Choroid Plexus Perfusion and the Blood-CSF Barrier with Multi Post Label Delay Arterial Spin Labeling MRI and Vasodilation1Biomedical Engineering, University of California, Davis, Davis, CA, United States, 2Radiology, Stanford University, Palo Alto, CA, United States, 3Neurology, University of California, Davis, Davis, CA, United States
Synopsis
The choroid plexus contributes to the production of cerebrospinal fluid (CSF), maintains electrolyte and metabolic balance, and plays important immunological roles. Here, we sought to determine whether multi-post label delay (PLD) arterial spin labeling (ASL) MRI could robustly measure cerebral blood flow (CBF) in the choroid plexus and its response to a vasodilatory challenge. We saw choroid plexus perfusion increase by 30 ml/100g/min (p=0.0003) with acetazolamide. We also calculated the ratio of the choroid plexus to anterior ventricle ASL signal (rCV) as a clinically useful biomarker of blood-CSF passage and observed an average increase of 0.529 in rCV post vasodilation.
Introduction
Cerebrospinal fluid (CSF) plays important roles in protecting the brain from trauma as well as in transporting and regulating molecules essential for neuronal metabolism. It is produced by the choroid plexus, which is present in each of the ventricles but most significantly in the posterior lateral ventricles. Recently, there has been interest in using non-invasive methods to assess the integrity of the choroid plexus’s blood-CSF-barrier as numerous studies have suggested that dysfunction of this brain clearance structure could be responsible for the accumulation of pathognomonic proteins in neurodegenerative disorders such as Alzheimer’s Disease (AD) [1-4].Past work have implemented multi-post label delay (PLD) arterial spin labeling (ASL) MRI with an ultralong time echo (TE) to isolate the CSF signal for functional assessment of the choroid plexus [5] as well as manual region of interest (ROI) segmentation to measure its blood flow [6]. Our study builds upon these publications by measuring the change in cerebral blood flow (CBF) and the ratio of the choroid plexus to anterior ventricle ASL signal (rCV) as induced by a vasodilatory challenge.
Methods
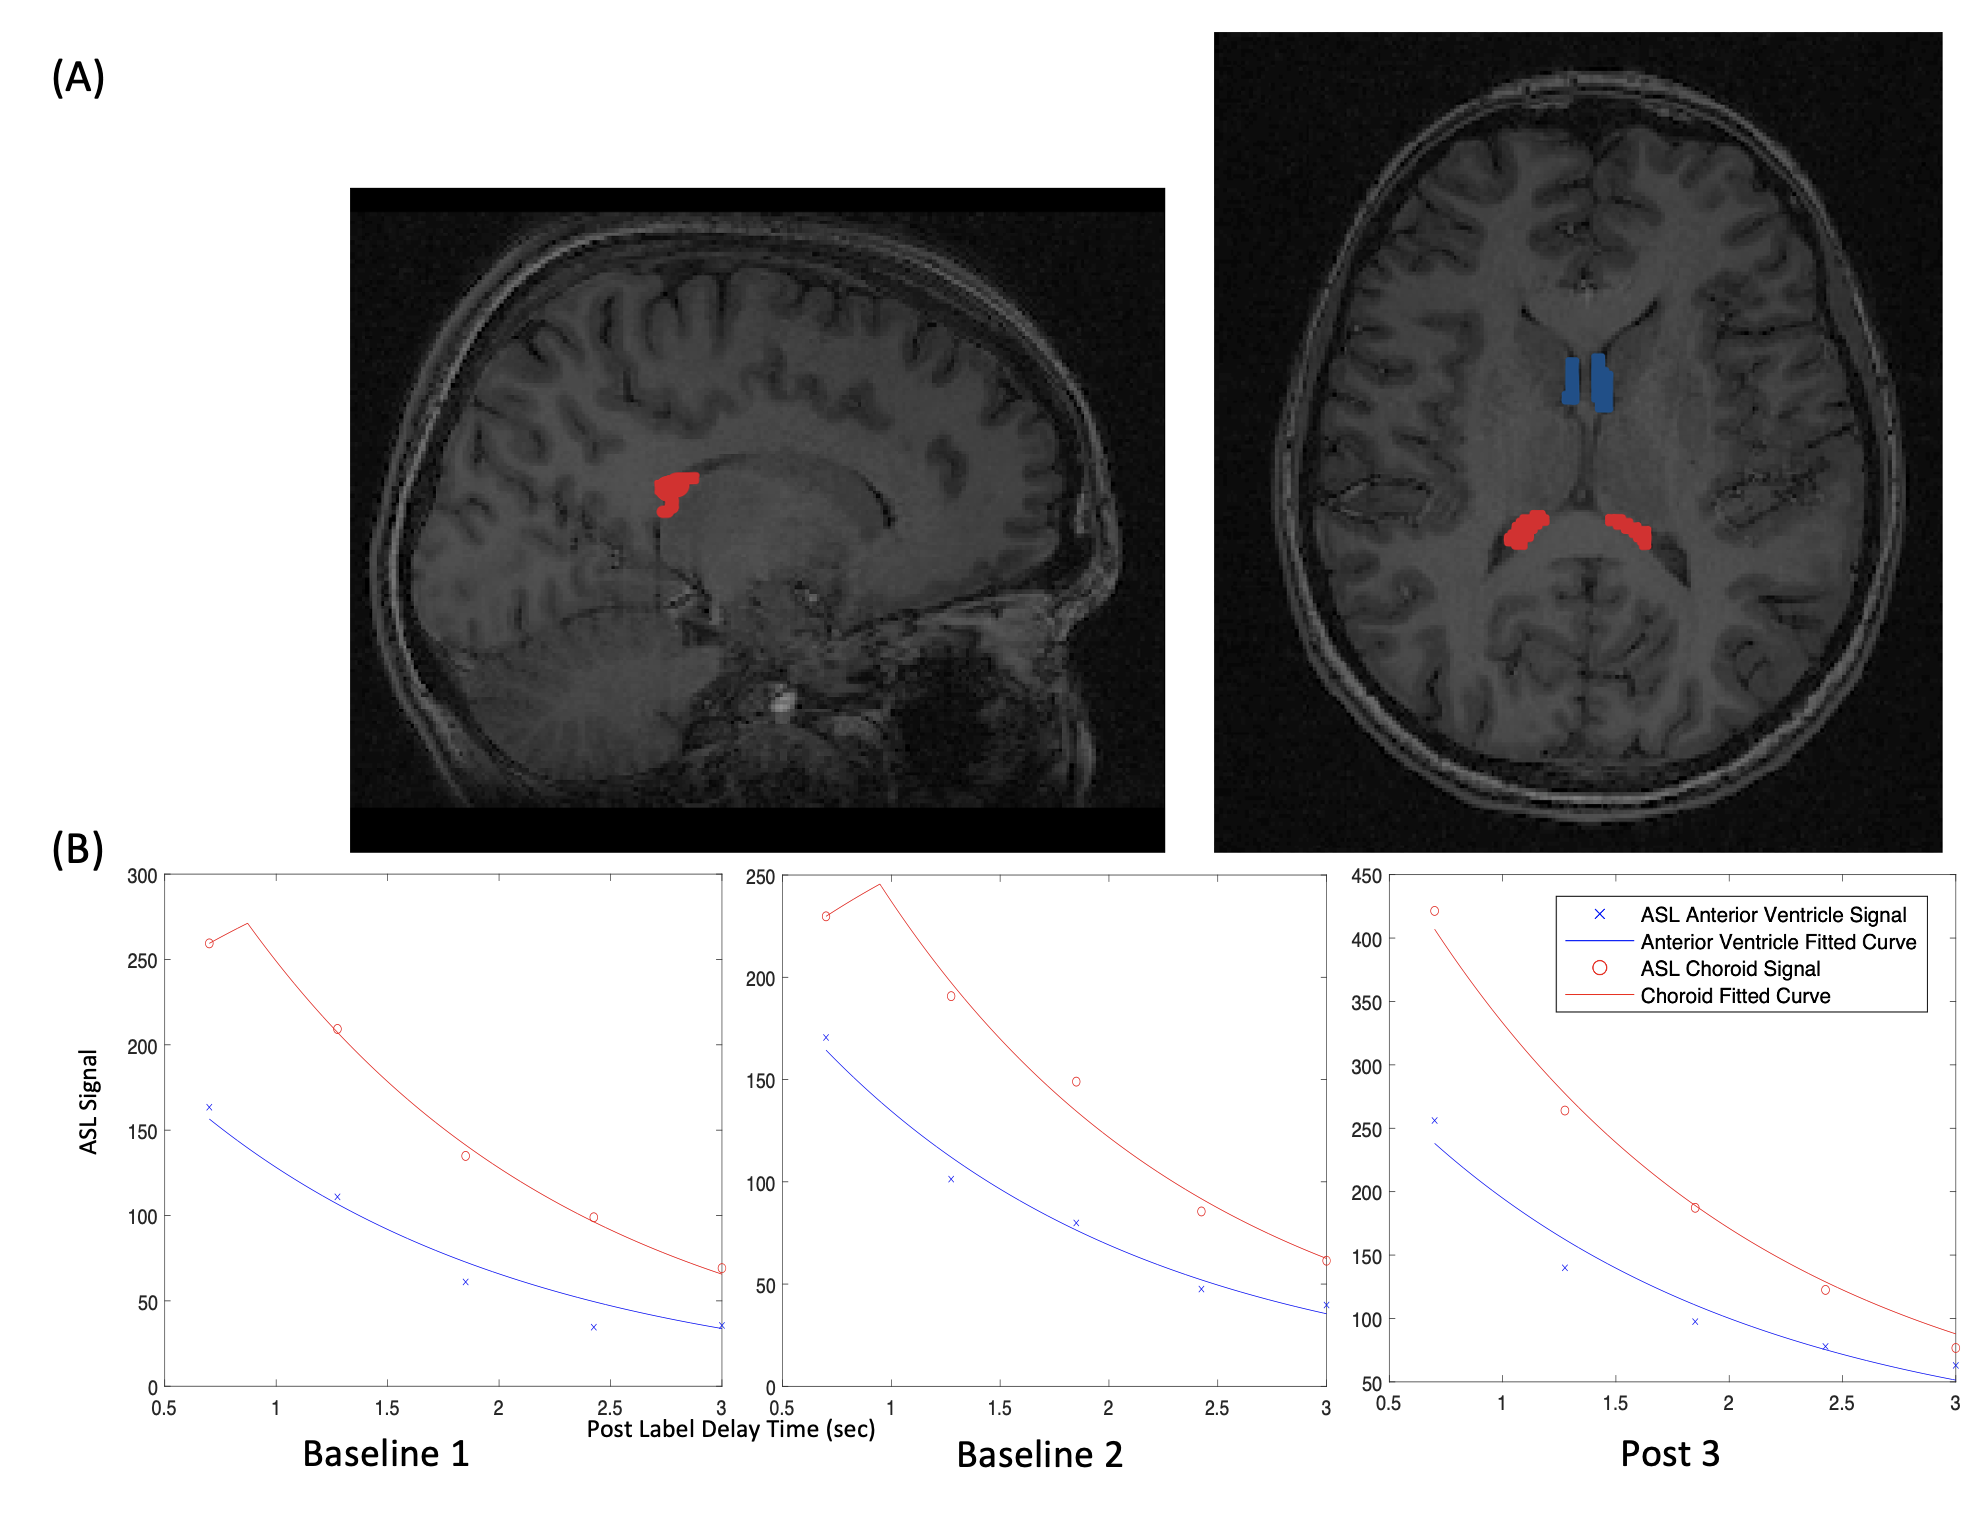
We retrospectively investigated multi-PLD ASL scans of twelve healthy adult volunteers (age 22-53, 5 females) acquired with a standard TE of 10.7 milliseconds. All scans used pseudo-continuous labeling and had a 3-dimensional (3D) fast spin echo readout with stack-of-spirals trajectory. Multi-PLD ASL scans were 4 minutes and 46 seconds long with an in-plane resolution of 5.8mmx5.8mm and slice thickness of 4.0mm. The labeling duration (LD) was 2 seconds and five equally spaced post PLD times were acquired between 0.7 and 3.0 seconds. Each scan consisted of three runs: two at baseline and one 15 minutes after vasodilation with intravenous acetazolamide (15mg/kg dose, up to 1g). All images were acquired on a simultaneous time-of-flight enabled 3.0 Tesla PET/MRI system (Signa, GE Healthcare, Waukesha, WI).For analysis, we used FSLeyes (Analysis Group, Oxford, UK) to manually segment a mask on structural T1 images that consists of a bilateral 3D ROI of the choroid plexus in the posterior lateral ventricles and a bilateral 3D slice ROI of the anterior ventricular space (Figure 1A). The latter characterizes the labeled signal that has crossed the blood-CSF-barrier and serves as the denominator in the rCV. FSL FLIRT was used to linearly register all ASL scans to their corresponding T1 structural images. Next, using MatLab (MathWorks Inc., Natick, MA), this mask is overlapped with the multi-PLD ASL scans and the raw ASL signal for the two ROIs is averaged at each PLD. Additionally, we fit an established ASL kinetic model [7] to each set of five raw multi-PLD time points using the fminsearch function and plotted the fitted curve alongside its corresponding raw ASL points (Figure 1B).
Results
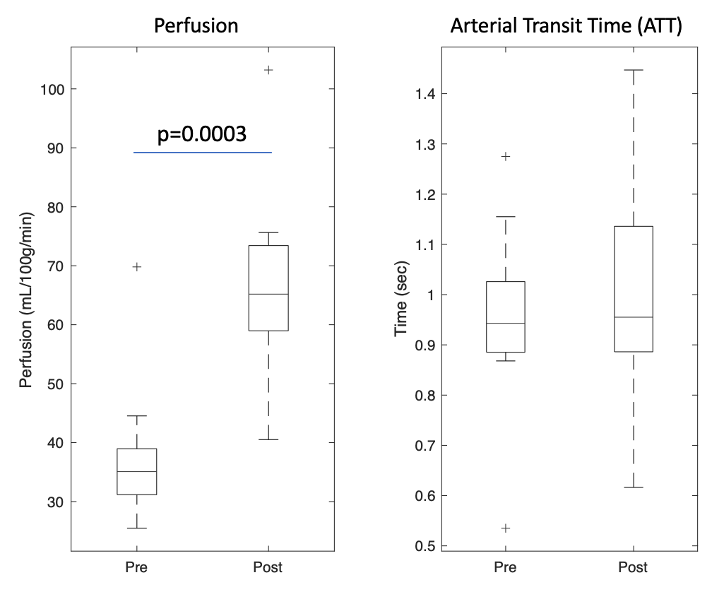
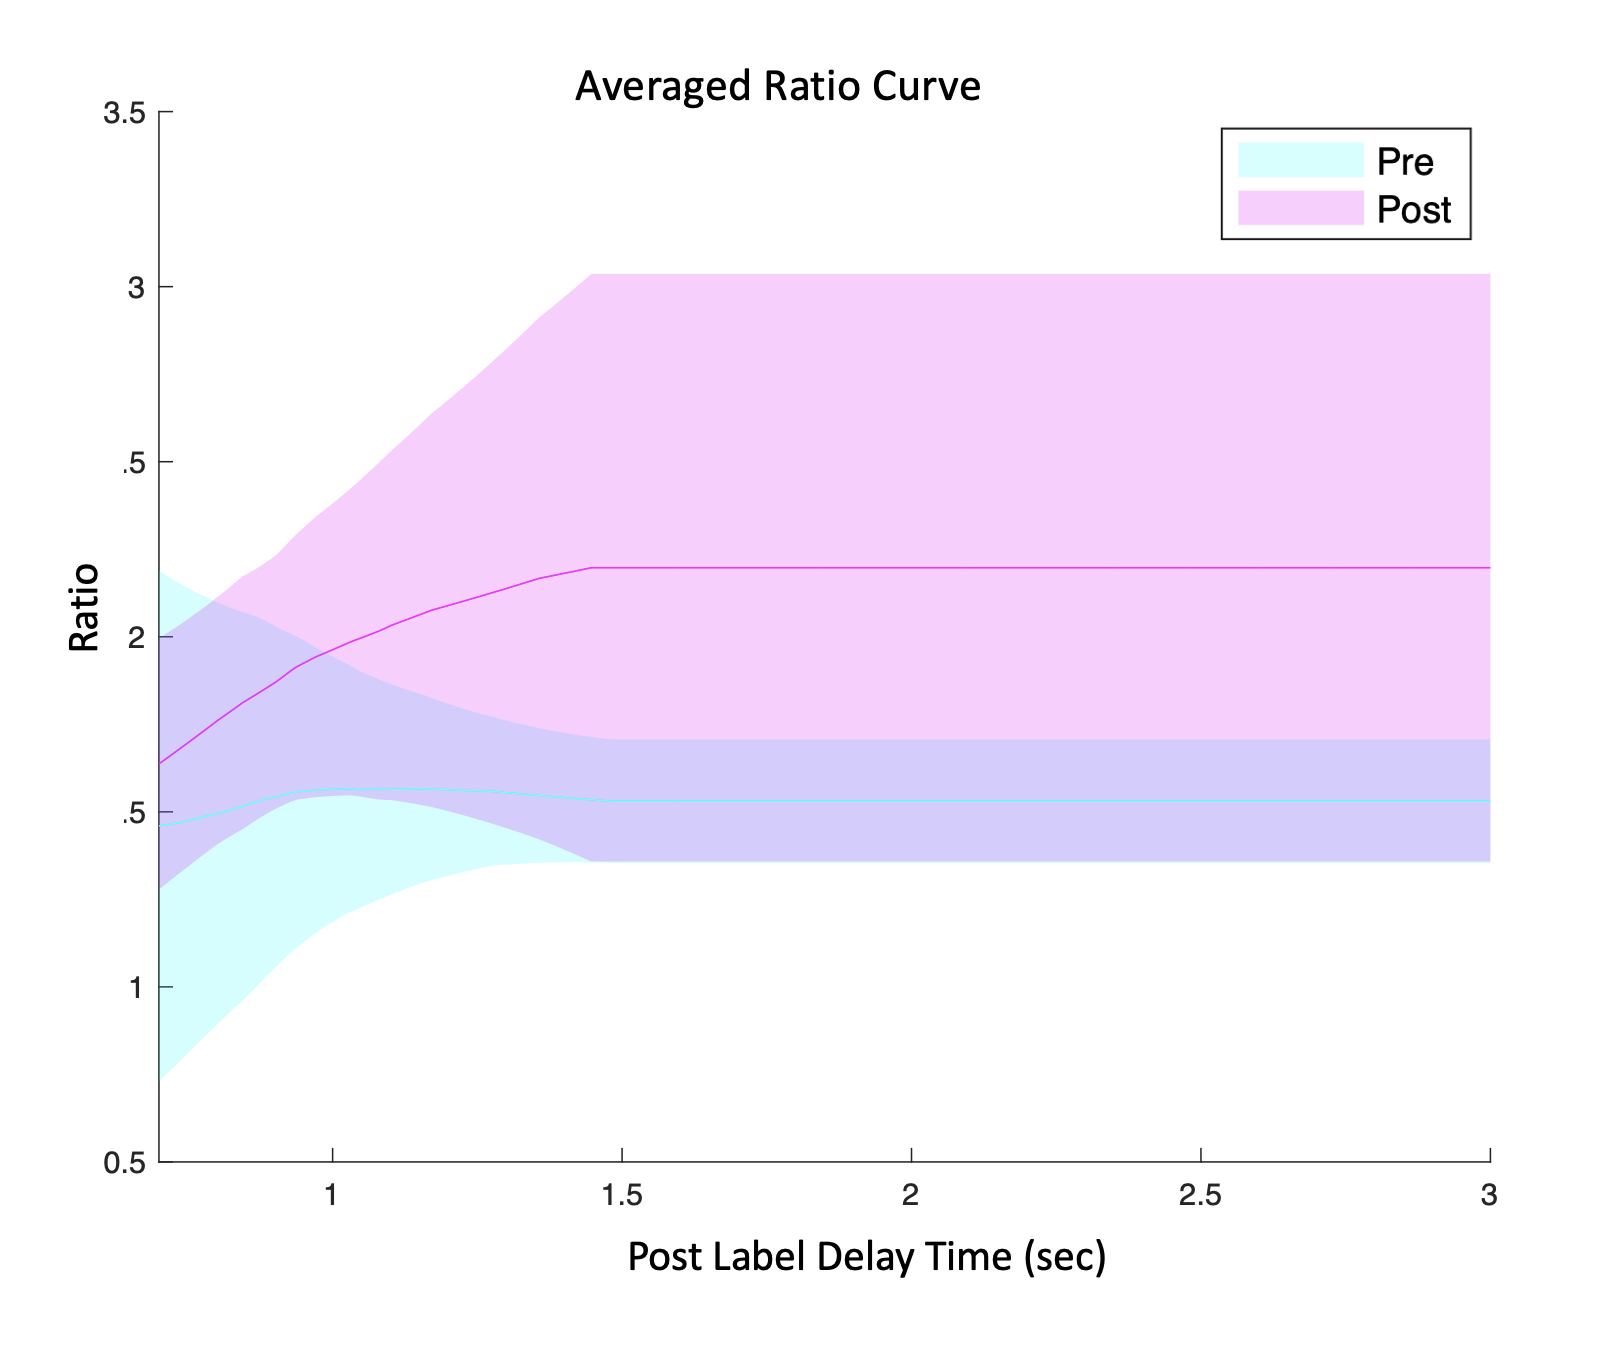
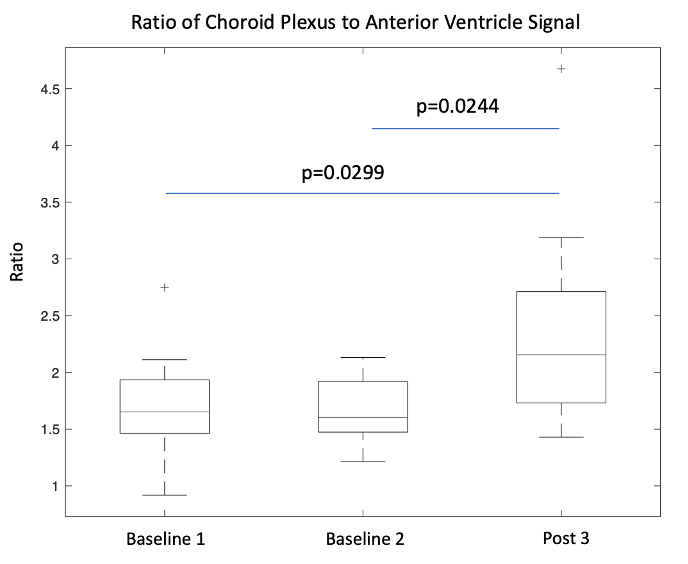
Our fitted model shows an increase in choroid plexus perfusion by 30 ml/100g/min (p=0.0003) with vasodilation (Figure 2) while arterial transit time (ATT) was not statistically different. Regarding ratio, Figure 4 shows two fitted rCV curves for pre- and post-vasodilation with each curve representing the average of all twelve individuals. These curves suggest that the difference in rCV between vasodilatory states increases with time and stabilizes at a PLD of 1.5 seconds. This observation has implications in setting PLD times for future ASL scans if robust rCV measurements are of interest.Figure 5 contains a boxplot of rCVs calculated by dividing the raw ASL signal for the two ROIs (per PLD) and averaging the ratios over the five PLDs for each run. Linear mixed-effect in R (with subject as a random effect) shows that the two baseline runs are lower in magnitude than the post-vasodilation run in rCV by 0.504 (p=0.0299) and 0.553 (p=0.0244).
Discussion
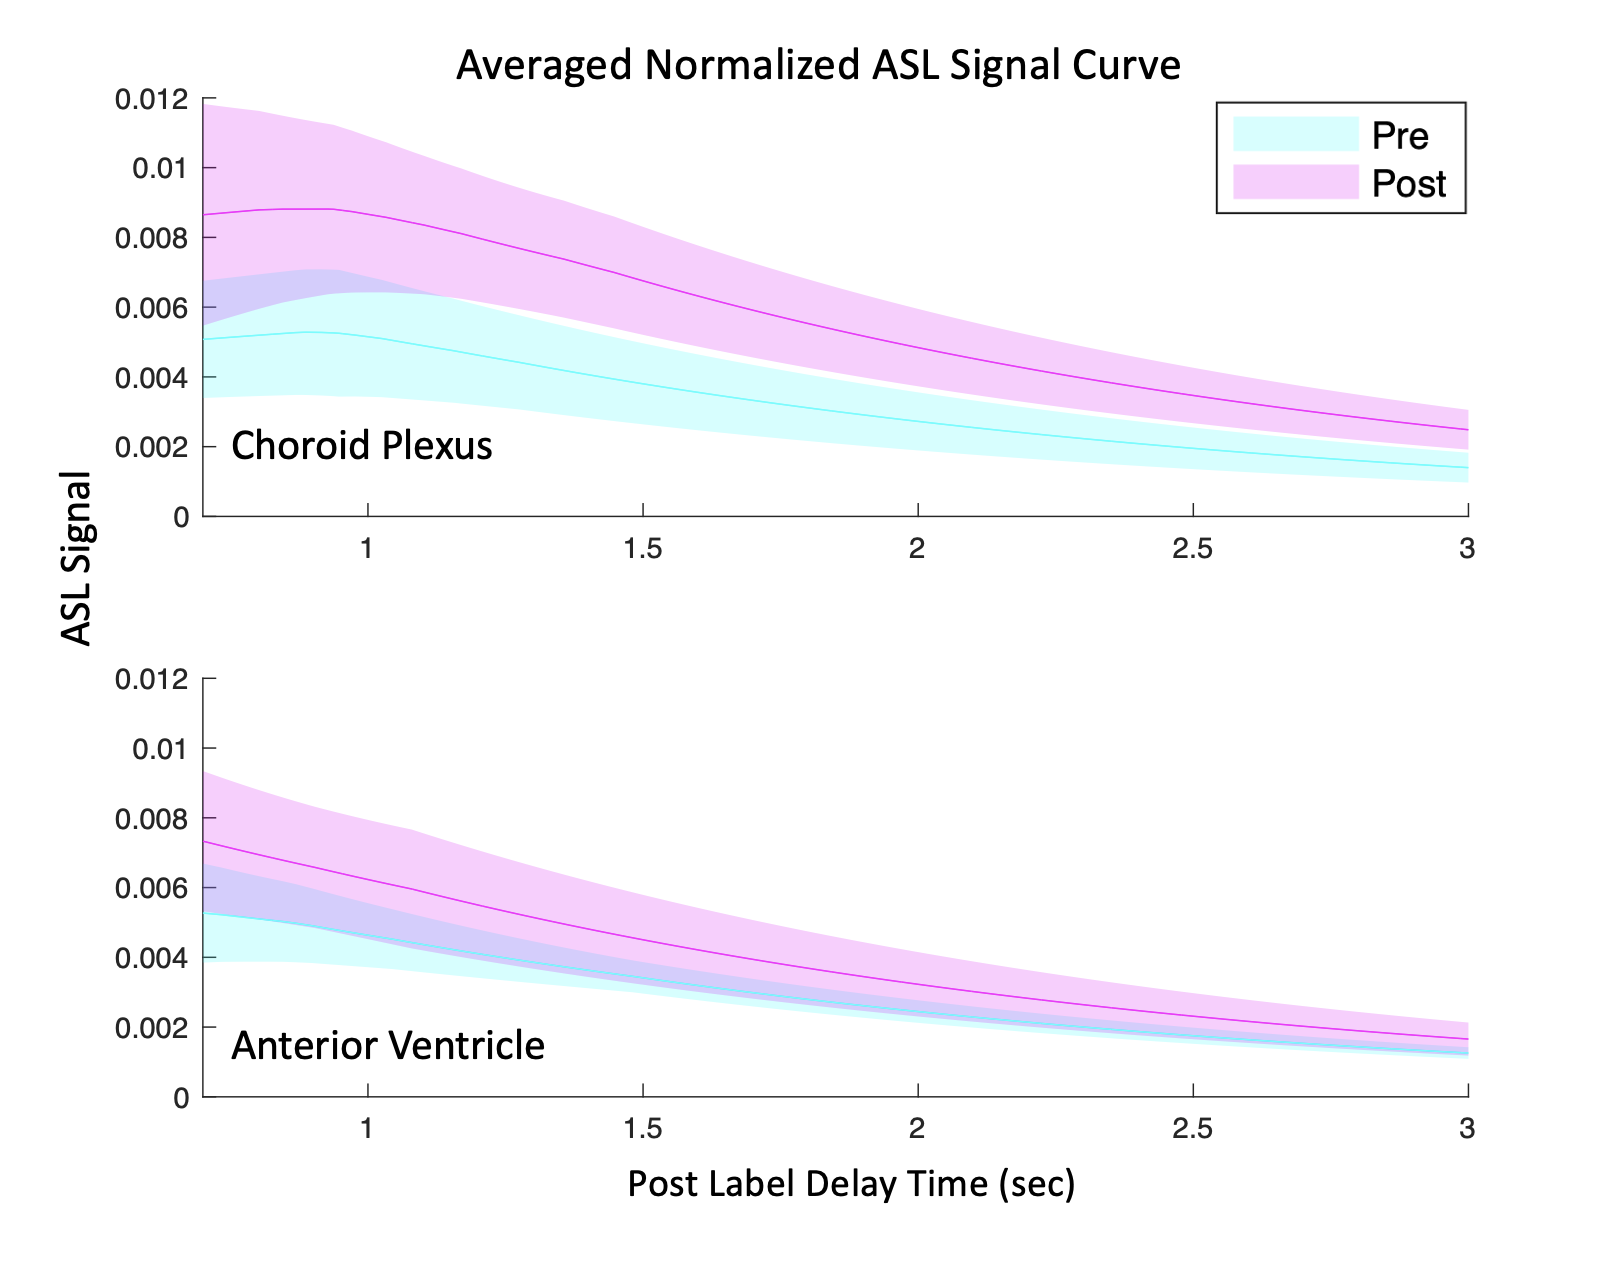
The magnitude of our choroid plexus perfusion (Figure 2) is consistent with a past reported value of 39.5±10.1ml/100g/min [6]. The lack of change in ATT post-vasodilatory could be because of variability of the ASL kinetic curve fitting or because we don’t have short enough PLDs to capture early arrivals. Nevertheless, we expect to see a slightly decrease in ATT post-vasodilation.The observation that rCV increases with vasodilation implies that water permeability across the blood-CSF barrier does not increase proportionally with perfusion. Figure 3 supports this reasoning by showing the ASL signal increase in the choroid plexus with vasodilation is much more dramatic than the increase for the anterior ventricles. A higher rCV vasodilation response is expected in healthy individuals because it suggests that the blood-CSF-barrier is intact (i.e., not leaky) and can prevent too much of the additional tagged water molecules, as a result of the increase in perfusion, from reaching the ventricular space.
Future work will include validating our ASL results with the simultaneously acquired [15O]-water PET data. In addition to examining the blood-CSF-barrier, we plan to explore models measuring water permeability across the blood-brain barrier (BBB).
Acknowledgements
This study was supported by NIH R00-NS102884 and NIH R01-EB025220.References
1. Da Mesquita, S., et al., Functional aspects of meningeal lymphatics in ageing and Alzheimer's disease. Nature, 2018. 560(7717): p. 185-191.
2. de Leon, M.J., et al., Cerebrospinal Fluid Clearance in Alzheimer Disease Measured with Dynamic PET. J Nucl Med, 2017. 58(9): p. 1471-1476.
3. Serot, J.M., J. Zmudka, and P. Jouanny, A possible role for CSF turnover and choroid plexus in the pathogenesis of late onset Alzheimer's disease. J Alzheimers Dis, 2012. 30(1): p. 17-26.
4. Tarasoff-Conway, J.M., et al., Clearance systems in the brain-implications for Alzheimer disease. Nat Rev Neurol, 2015. 11(8): p. 457-70.
5. Evans, P.G., et al., Non-Invasive MRI of Blood-Cerebrospinal Fluid Barrier Function. Nat Commun, 2020. 11(1): p. 2081.
6. Zhao, L., et al., Non-invasive measurement of choroid plexus apparent blood flow with arterial spin labeling. Fluids Barriers CNS, 2020. 17(1): p. 58.
7. Dai, W., et al., Reduced resolution transit delay prescan for quantitative continuous arterial spin labeling perfusion imaging.Magn Reson Med, 2012. 67(5): p. 1252-65.
Figures