1205
Cerebrospinal fluid-tissue exchange revealed by phase alternate labeling with null recovery MRI1F.M. Kirby Research Center for Functional Brain Imaging, Kennedy Krieger Research Institute, Baltimore, MD, United States, 2Russell H. Morgan Department of Radiology and Radiological Science, The Johns Hopkins University School of Medicine, Baltimore, MD, United States
Synopsis
Our understanding of the CSF exchange with surrounding tissues and its correlation with brain function is limited. We presented the first non-invasive MRI methods to quantify this process with two novel T1 and ADC Phase Alternate LAbeling with Null recovery (PALAN) schemes. The CSF signal was nulled, while the partial recovery of other tissues was labeled by alternating the phase of the pulse by using the significantly different T1 and ADC values between CSF and the other tissues. Rapid and major CSF water exchange occurs on the surface of the ventricles.
Introduction
The CSF exchange with the parenchyma and ependymal layers and the correlation with brain function were not well documented. The CSF exchange process may also impact the recently discovered glymphatic system. The T1 and ADC Phase Alternate LAbeling with Null recovery (PALAN) was developed as the first non-invasive methods to quantify water exchanging processes in the brain between CSF and the surrounding brain tissues by using the significant different T1 and ADC values between CSF and other tissues.Method
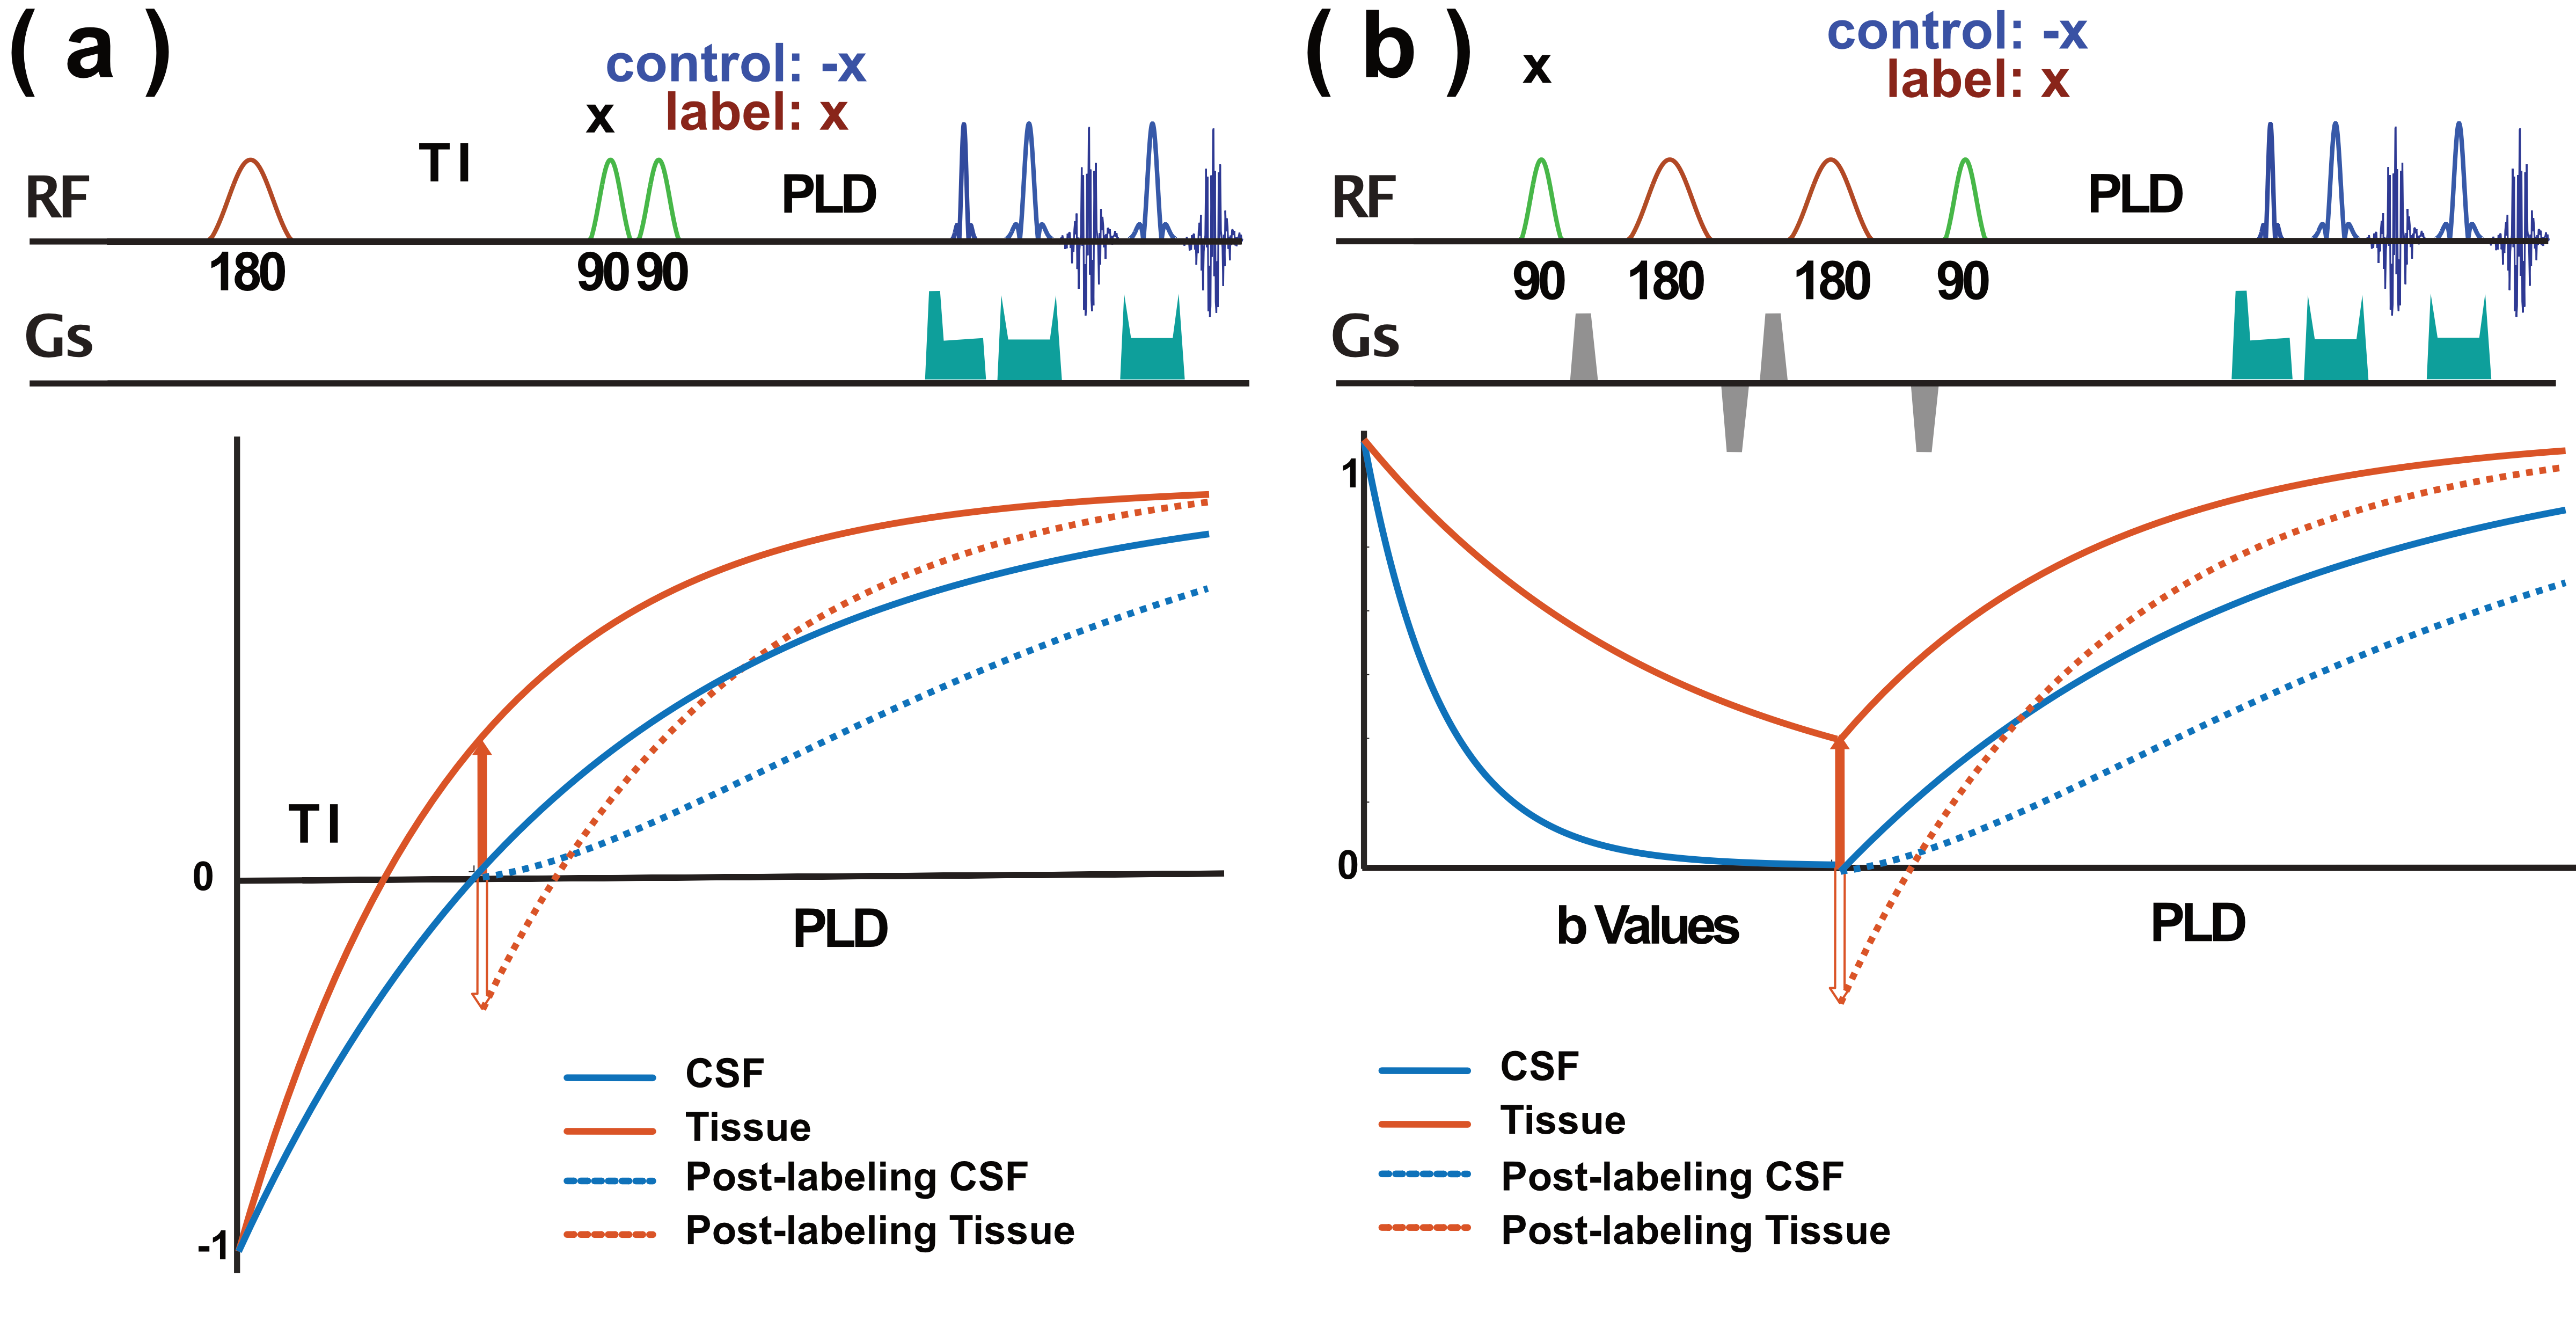
In both T1-PALAN and apparent diffusion coefficient (ADC)-PALAN MRI methods, the cerebrospinal fluid (CSF) signal was nulled, while the partial recovery of other tissues with short T1 (T1-PALAN) or low ADC values (ADC-PALAN) was labeled by alternating the phase of pulses. The water exchange was extracted from the difference between the recovery curves of CSF with and without labeling.(Figure 1) In the T1-PALAN method, one Z-filter composited by two 90-degree pulses (Gaussian pulse with 1.4 ms width) was applied at the TInull, CSF. The phase of the second 90-degree pulse in the Z-filter was alternated by 180-degree, flipping the longitudinal partially recovered tissue magnetization up (control) and down (label). ADC-PALAN applied a twice-refocused pulsed gradient spin echo (PGSE) module to suppress the CSF signal with high b values (2100 s/mm2) and left the recovered parenchyma signal untouched. The phase of the second 90-degree pulse in the PGSE module was alternated by 180-degree to obtain the control and label images.Results
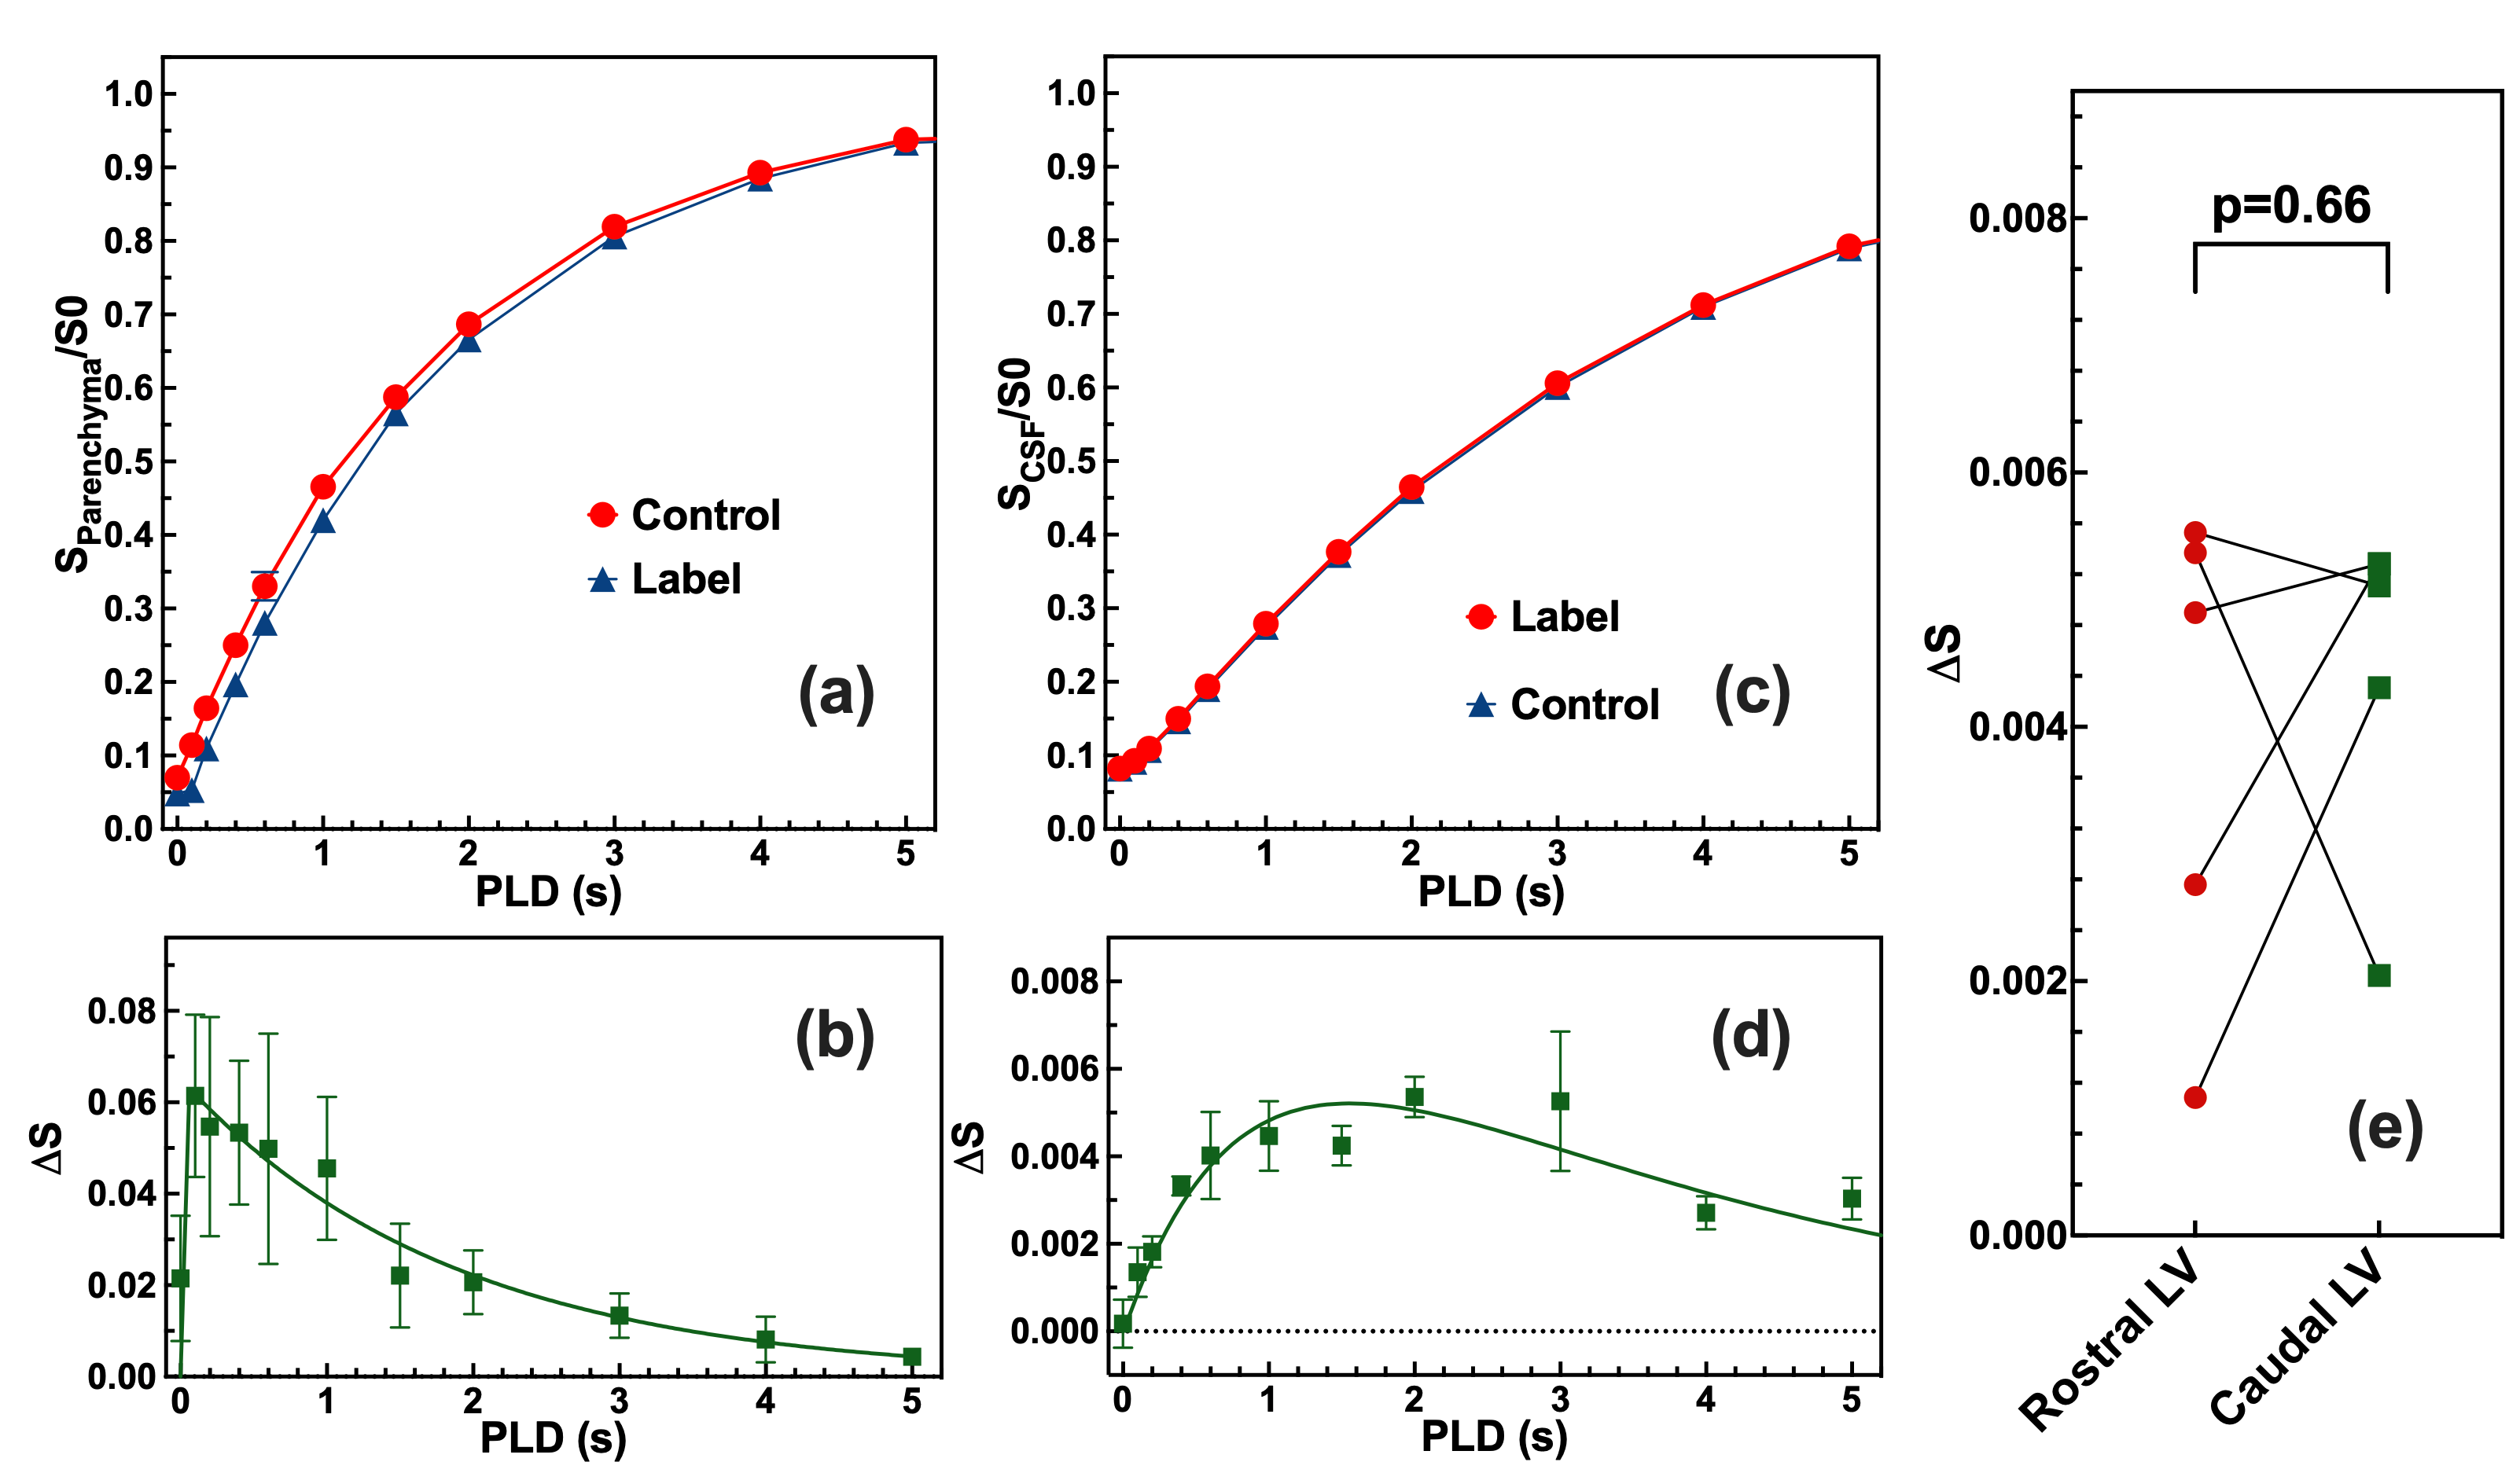
The post-labeling parenchyma signal curve shows a typical inversion recovery curve and the labeling efficiency of α=0.21±0.02 can be extracted. (Figs. 2a&b)The CSF recovery curves show a clear difference between control and label pulses, indicating high water exchange values. (Fig. 2d) The CSF difference curves, i.e., T1-PALAN kinetic curves, show a clear buildup and decay pattern that peaks at PLD=1.5 s. CSF water exchange value was determined as 1153±270 ml/100ml/min, and (water exchange transit time) WTT = 67±56 ms. The T1-PALAN ∆S values for the rostral and caudal LV are 0.015±0.013 and 0.034±0.01 (p=0.022, n=5), respectively (Fig. 2e).Figs. 2g, h, j and k are typical T1-PALAN control images and maps of the brain ventricles. The high-resolution T2weighted maps show the CP in the LV (Figs. 2f and i), and the CP is visible in the caudal LV regions. Across the ventricles, the water exchange rates were not uniform, and most water flowed from the bottoms of the LV, as indicated in Figs. 2h and k with green arrows.
The labeling efficiency of ADC for parenchyma was significantly lower than those of the T1-PALAN method,(Figs. 3a&b) which led to a much-reduced ADC-PALAN signal of 4.2±0.5 (PLD=1.5 s; Fig. 3d) compared to 35±4.5 (PLD=1.5 s) in the T1-PALAN method. ADC-PALAN derived CSF water exchange value was determined as 891±60 ml/100ml/min, and WTT = 13±2 ms. The ADC-PALAN values for the rostral and caudal LV were 3.9±1.9 and 4.4±1.4 (p=0.66, n=5), respectively (Fig.3e).
Discussion
Both T1-PALAN and the ADC-PALAN methods suggested that the water exchange between CSF and other tissues occurs rapidly. The blood signal was fully suppressed by the high b value (2100 s/mm2) in the ADC-PALAN. Therefore, the blood was labeled in ADC-PALAN but not in T1-PALAN. The T1-PALAN values theoretically contained strong signals from the blood through choroid plexus (CP), i.e., blood-cerebrospinal fluid barrier arterial spin labeling1. The higher CSF water exchange value (1153±270 ml/100ml/min) by T1-PALAN than the value measured by the ADC-PALAN (891±60 ml/100ml/min) confirms that T1-PALAN contains signals from the blood. The water exchange between CP and CSF could be as high as 50% in the caudal LV. This water contribution includes the blood flow from CP to the ventricle and the exchange between CSF and CP tissue. The similar CSF water exchange values measured by ADC-PALAN in rostral and caudal LV suggested that the observed CSF water exchange signal mainly came from parenchyma and ependyma, not blood. (Fig. 3e)The short bolus duration measured by both T1- and ADC-PALAN methods suggested that the major water exchange occurs in the surface of the ventricles, i.e., the ependyma layers. The driving force that facilitates the rapid CSF-tissue water exchanging process is unknown. One possible explanation is the pulsatile nature of the CSF flux, which appears to be craniocaudally oriented during cardiac systole and in the reverse direction during diastole2-4.
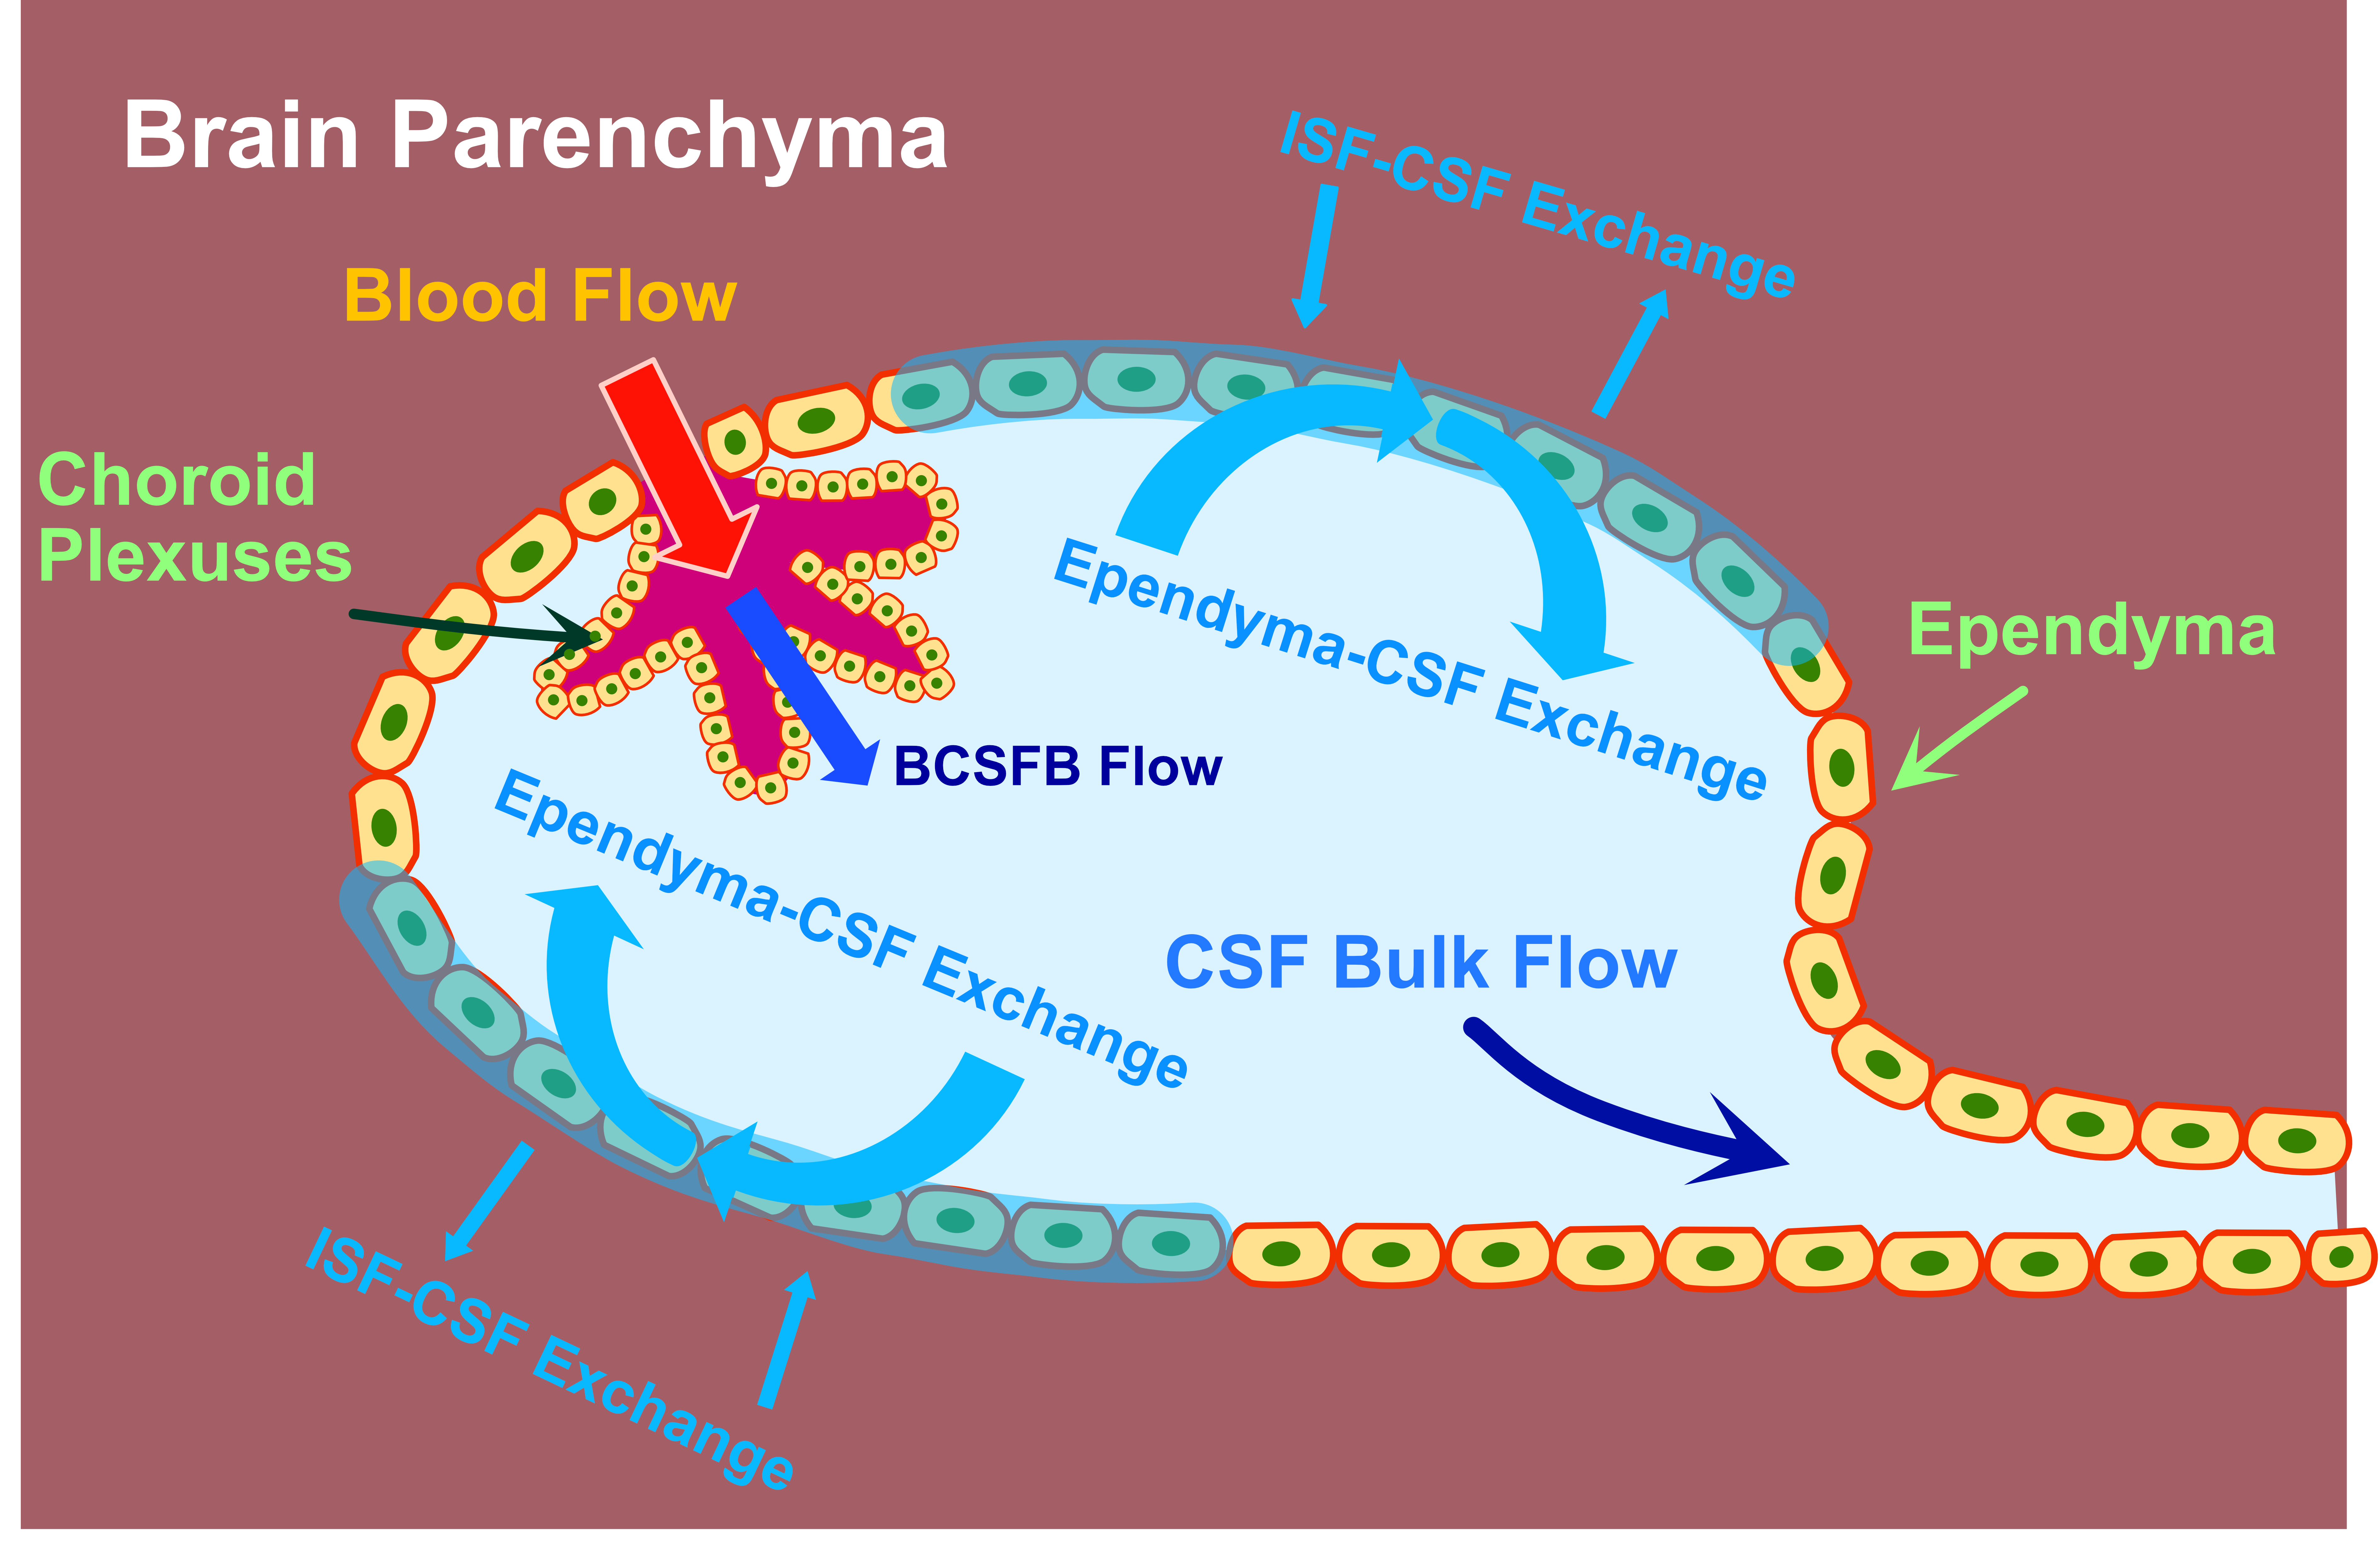
Based on our results and previous research, we proposed a model that explains the phenomenon of CSF rapidly exchanges with the surrounding tissues, mainly with the ependymal layer and the study of the radioactive-labeled substances in CSF, in which the infused tracer crosses the periventricular ependymal layer and can be found in the extracellular space.5-7 The proposed water exchange process are indicated in Fig. 4. No fresh CSF is generated in this process.
Conclusion
In summary, the PALAN MRI methods proposed here provide technically achievable tools to examine the association between CSF water exchange and functional decline in many neurodegeneration diseases. They complement the invasive MRI method with agents and a complete view of the CSF water exchange in the ventricles with the surrounding tissues.Acknowledgements
Grant support from NIH: P41EB031771, R01HL149742, R21AG065794, and R21NS118079.References
1. Evans PG, Sokolska M, Alves A, Harrison IF, Ohene Y, Nahavandi P, Ismail O, Miranda E, Lythgoe MF, Thomas DL, Wells JA. Non-Invasive MRI of Blood-Cerebrospinal Fluid Barrier Function. Nat Commun 2020;11(1):2081.
2. Enzmann DR, Pelc NJ. Normal flow patterns of intracranial and spinal cerebrospinal fluid defined with phase-contrast cine MR imaging. Radiology 1991;178(2):467-474.
3. Nitz WR, Bradley WG, Jr., Watanabe AS, Lee RR, Burgoyne B, O'Sullivan RM, Herbst MD. Flow dynamics of cerebrospinal fluid: assessment with phase-contrast velocity MR imaging performed with retrospective cardiac gating. Radiology 1992;183(2):395-405.
4. Vivas-Buitrago T, Lokossou A, Jusue-Torres I, Pinilla-Monsalve G, Blitz AM, Herzka DA, Robison J, Xu J, Guerrero-Cazares H, Mori S, Quinones-Hinojosa A, Baledent O, Rigamonti D. Aqueductal Cerebrospinal Fluid Stroke Volume Flow in a Rodent Model of Chronic Communicating Hydrocephalus: Establishing a Homogeneous Study Population for Cerebrospinal Fluid Dynamics Exploration. World Neurosurg 2019;128:e1118-e1125.
5. Bowsher D. Pathways of absorption of protein from the cerebrospinal fluid: an autoradiographic study in the cat. Anat Rec 1957;128(1):23-39.
6. Casaca-Carreira J, Temel Y, Hescham SA, Jahanshahi A. Transependymal Cerebrospinal Fluid Flow: Opportunity for Drug Delivery? Mol Neurobiol 2018;55(4):2780-2788.
7. Sahar A, Hochwald GM, Sadik AR, Ransohoff J. Cerebrospinal fluid absorption in animals with experimental obstructive hydrocephalus. Arch Neurol 1969;21(6):638-644.
Figures