1198
Phase-Based B1 Mapping in a 65 mT Single-Sided Prostate MRI Scanner
William A Grissom1, Meredith Sadinski2, Alek Nacev2, and Muller De Matos Gomes2
1Biomedical Engineering, Vanderbilt University, Nashville, TN, United States, 2Promaxo, Oakland, CA, United States
1Biomedical Engineering, Vanderbilt University, Nashville, TN, United States, 2Promaxo, Oakland, CA, United States
Synopsis
B1 mapping is important to characterize non-uniform coil geometries and to optimize imaging sequences and image reconstructions in low-field MRI, but is made challenging by point-of-care single-sided imaging geometries with large frequency bandwidths and B1 ranges. We propose a high-bandwidth phase-based B1 mapping technique based on a CHORUS pulse sequence with alternated frequency sweep polarities, which has a wide (40 kHz) imaging bandwidth and high B1 dynamic range. The sequence was implemented and validated on a 65 mT single-sided prostate MRI scanner in phantom scans with butterfly coil transmit and local multichannel receive.
Introduction
Mapping the strength of the RF transmit (B1) field is essential at high B0 field strengths for bias field correction, quantitative imaging, and parallel transmission. At low B0, B1 fields are much less subject-dependent but B1 mapping is still important to characterize non-uniform coil geometries and to optimize imaging sequences and image reconstructions. However, B1 mapping at low B0 is made more challenging by point-of-care single-sided imaging geometries with large frequency bandwidths and B1 ranges. In this work, we describe a high-bandwidth phase-based B1 mapping technique based on a CHORUS pulse sequence with alternated frequency sweep polarities, which has a wide (40 kHz) imaging bandwidth and high B1 dynamic range. The sequence was implemented and validated on a 65 mT single-sided prostate MRI scanner in phantom scans with a butterfly transmit coil and a local multichannel receive coil (Figure 1).Methods
Pulse Sequence and Phantom Scans: The B1 phase dependence of adiabatic excitation and refocusing pulses has been used to map B1 fields at high B0 [1-3]. However, this dependence holds more broadly for frequency swept pulses, and in this work a multi-slab 3D CHORUS pulse sequence comprising three wide-bandwidth WURST pulses (Figure 2) was used for B1 mapping in a copper sulfate-doped water bottle phantom. The first π WURST (CHORUS) pulse compensates for the quadratic phase of the π/2 pulse and applies its own quadratic phase that is compensated by the second π WURST pulse. Phase encoding in x and y is applied between the two π pulses. A spin echo forms after the second π pulse which is frequency encoded by the magnet’s built-in z-gradient. The echo spacing (ESP) was set to 5.1 ms. The sequence was repeated to acquire B1 maps in 6 6-slice slabs parallel to the face of the magnet, each of thickness 17.8 mm with in-plane phase-encoded matrix size 48 x 48 with resolution 2.33 x 2.33 mm2. Across the six slabs the π/2 pulse durations ranged from 1.7 to 3.0 ms and the π pulse durations ranged from 1.4 to 4.0 ms, which were set based on a separate signal amplitude-based B1 calibration. The pulses all used BW = 40 kHz and a WURST n-factor of 40.Lookup Table Generation: Figure 3 illustrates the lookup table generation procedure. A Bloch simulation of the CHORUS sequence was implemented using Sigpy.RF [4], across a +/- 25 kHz frequency range and excitation pulse B1 amplitudes between 0-100 uT, with 512 points in each dimension. Simulated Mxy values were recorded at the spin echo time and the simulation was repeated with opposite frequency sweep polarities for the WURST pulses. The phase differences between Mxy with positive and negative frequency sweep polarities were calculated and unwrapped along the B1 dimension to obtain a lookup table.
Image Reconstruction and B1 Map Calculation: Using measured B0 and gradient fields, a conjugate gradient image reconstruction was used to reconstruct each slab of images independently across the five receiver channels to a 48 x 48 x 6 grid with resolution 2.33 x 2.33 x 2.8 mm3. Walsh coil combination coefficients were determined from the positive frequency sweep images and were applied to obtain coil-combined positive and negative frequency sweep images. The phase differences between these two image sets were calculated and 3D-unwrapped, and were used along with the frequency offset to calculate the B1 amplitude at each voxel via interpolation from the simulated lookup table.
Results
Figure 3, bottom right shows the calculated lookup table for the first slab which ranged from 0 to 79 radians along B1 and more smoothly across frequency offset, reflecting the sequence’s high B1 sensitivity of 0.78 radians per uT, averaged across B1 and slabs. Figure 4 shows positive frequency sweep images in the first slab closest to the magnet and the raw phase of the coil-combined data for each sub-slice of the slab. The first sub-slice is furthest from the magnet. Figure 5 shows the unwrapped phase difference between the two scans, the B0 field maps that were used with those phase differences to calculate B1, and the calculated B1 maps. The maps are smooth inside the phantom and peak in its middle as expected for the butterfly transmit coil, and the field is strongest in the slice closest to the magnet and transmit coil. They have a mean and peak amplitude of 19.2 uT and 29.5 uT in the prostate region of the phantom, which agree well with the 25.6 uT nominal B1 amplitude of the manually-tuned sequence for this slab.Discussion
A high-bandwidth multi-slab 3D CHORUS pulse sequence was described and validated for B1 mapping of a single-sided prostate MRI scanner at 65 mT. The sequence has a high sensitivity to B1 which ranged from 0 to 30 uT in our scans; this is about 50% higher than the typical B1 ranges of 0 to 20 uT at high B0. The sequence also had a much wider bandwidth (40 kHz) due to the scanner’s built-in z-gradient. The sequence could find broad application in calibrating B1 fields in single-sided and point-of-care low-field MRI scanners.Acknowledgements
This work was supported by NIH R01 EB 030414References
- Park JY, Garwood M. B1 mapping using phase information created by frequency-modulated pulses. In: Proceedings 16th ISMRM, Toronto, Canada, 2008. p. 361.
- K. V. Jordanova, D. G. Nishimura, and A. B. Kerr. B1 estimation using adiabatic refocusing: BEAR. Magn Reson Med, 72(5), 2014.
- Y. Lee, Y. Han, H. Park, H. Watanabe, M. Garwood, and J.-Y. Park. New phase-based B1 mapping method using two-dimensional spin-echo imaging with hyperbolic secant pulses. Magn Reson Med, 73:173–181, 2015.
- J B Martin, F Ong, J I Tamir, M Lustig, and W A Grissom. SigPy.RF: Comprehensive Open-Source RF Pulse Design Tools for Reproducible Research. In: Proceedings 28th ISMRM, Virtual, 2020, p. 1045.
Figures
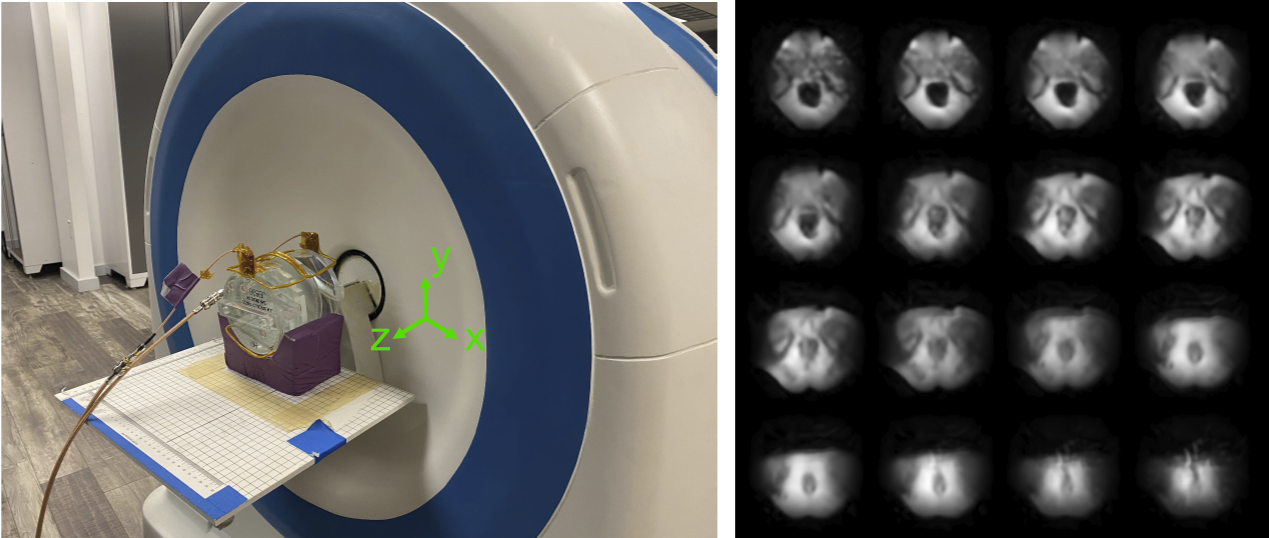
Figure 1: Scanner (left) and representative prostate images (right). The patient lies supine with their legs up and their prostate in front of the 65 mT magnet’s opening, which provides surgical access. There is a built-in z-gradient field that is used for frequency encoding in concert with pulsed x- and y-gradient phase encoding. It has a butterfly coil for excitation and 5-channel receiver surface coils that wrap around the pelvis.
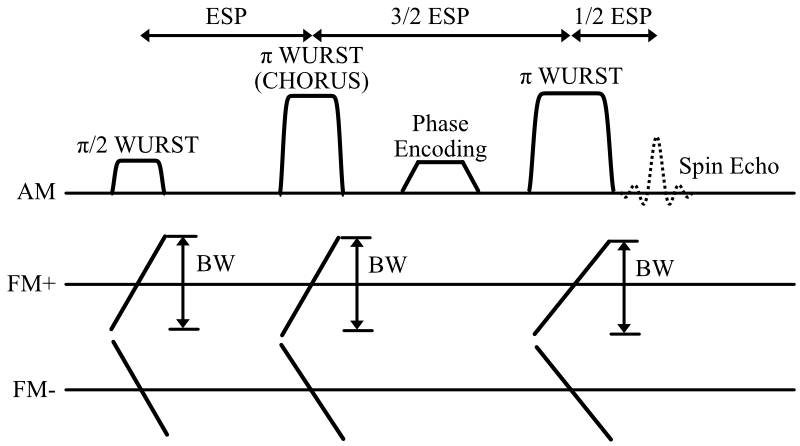
Figure 2: Multi-slab 3D CHORUS B1 mapping pulse sequence. A π/2 WURST excitation pulse is followed by a π WURST CHORUS pulse. Phase encoding gradients are applied between the WURST CHORUS pulse and a second π WURST pulse, and a spin echo signal forms after the second π WURST pulse. All the pulses have the same bandwidth, and for B1 mapping the scan is repeated with opposite frequency sweep polarities, which complex-conjugates the B1-dependent phase shift in the recorded signals.
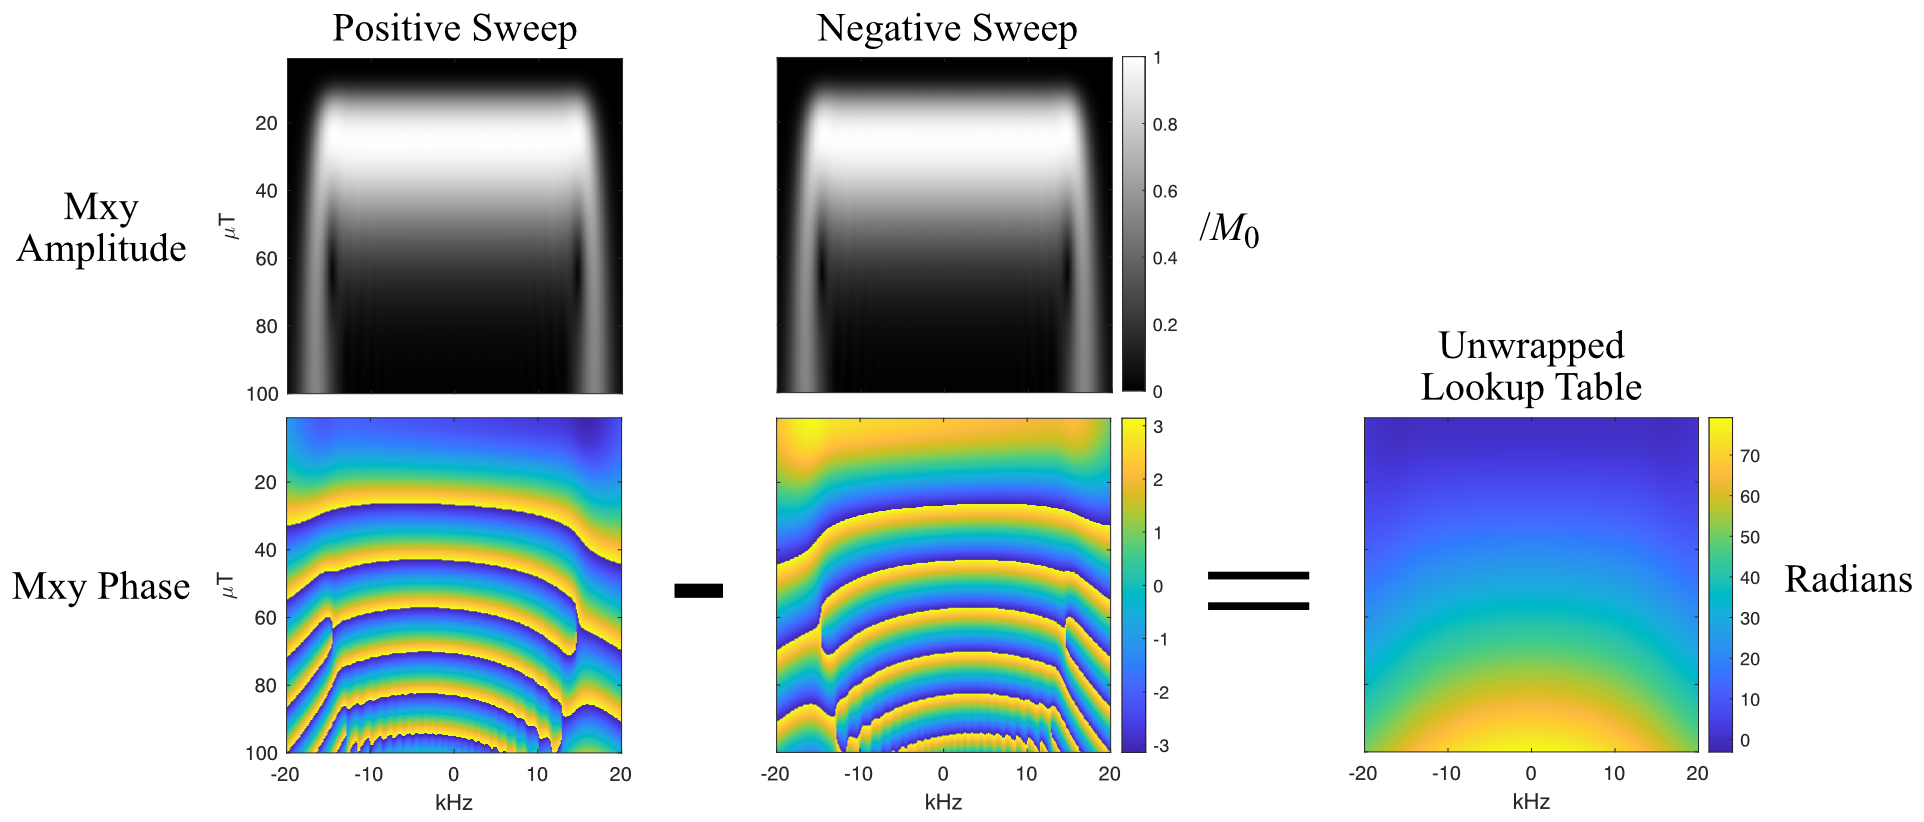
Figure 3: B1 Lookup Table Generation. Simulations of the CHORUS sequence were performed across B1 amplitudes and frequency offsets, with positive and negative WURST frequency sweeps. The top row shows simulated spin echo amplitude versus frequency offset and the peak B1 amplitude of the excitation pulse, for positive and negative frequency sweeps. The bottom row shows the spin echo Mxy phases. The lookup table (bottom right) is calculated from the unwrapped phase difference between the two signals.
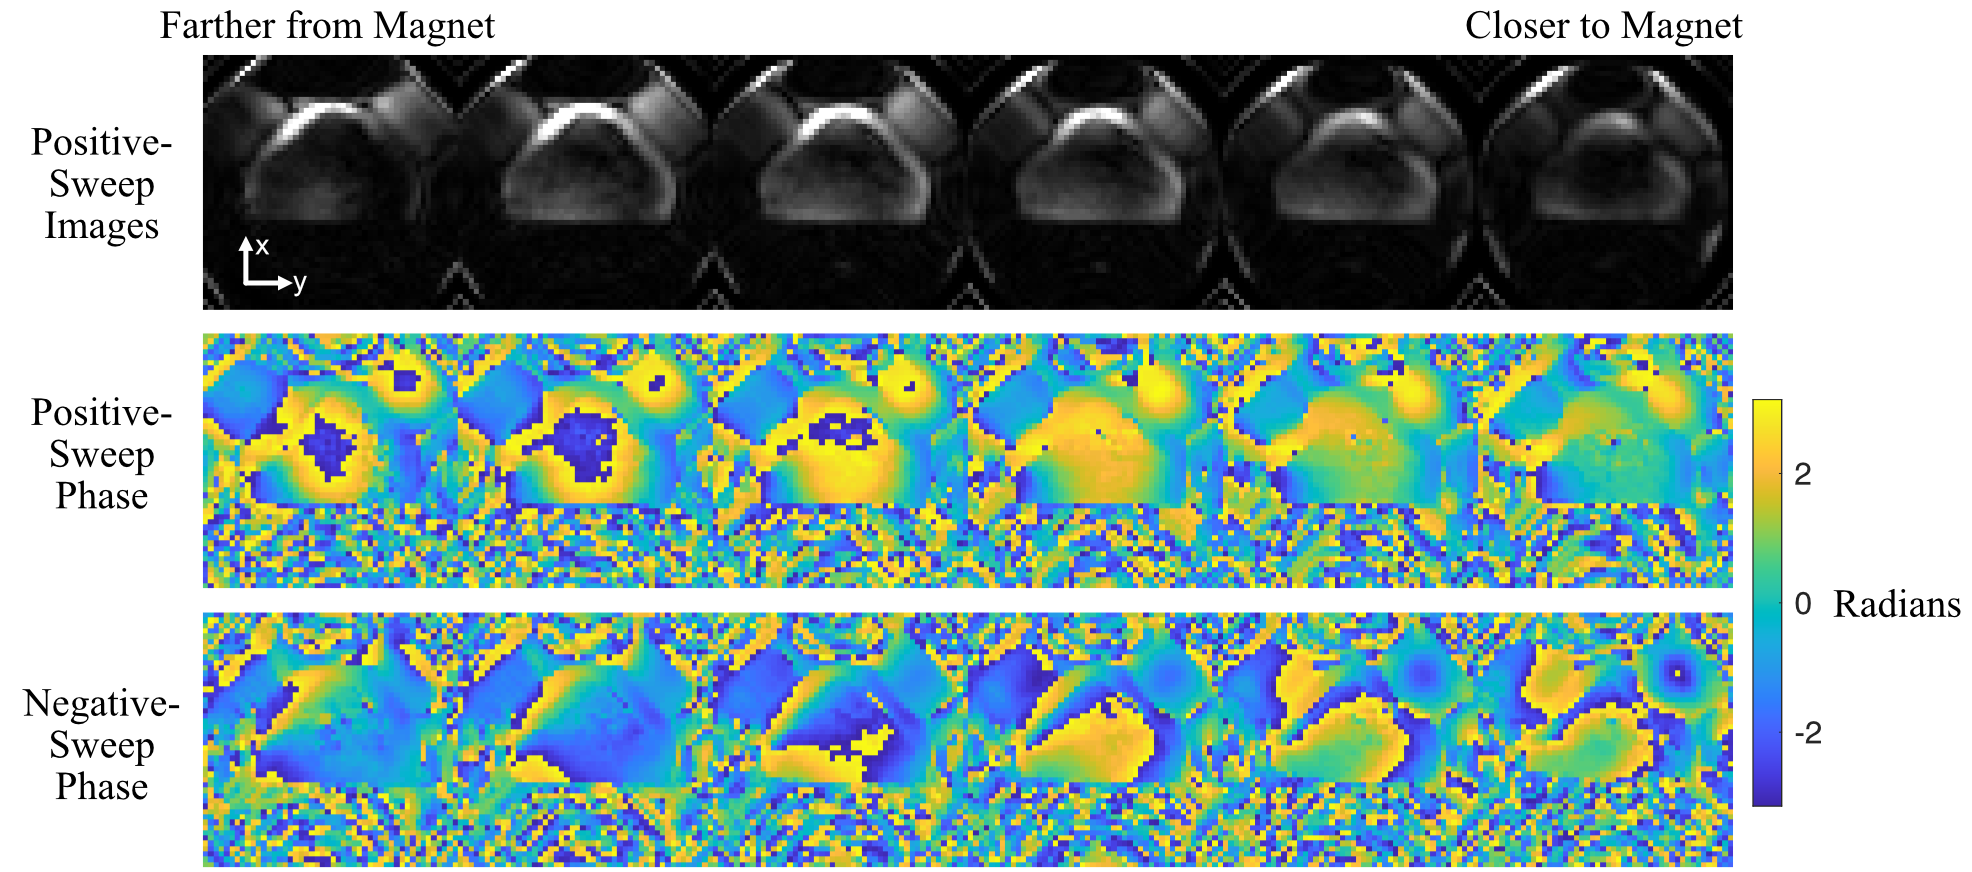
Figure 4: Measured CHORUS images in a six-slice slab of a water bottle phantom. Top row: Walsh-combined magnitude images from the positive frequency sweep acquisition. Signals outside the water bottle are aliased due to the non-bijective gradient fields. Bottom two rows: Raw positive and negative frequency sweep image phases after phase-sensitive Walsh combination.
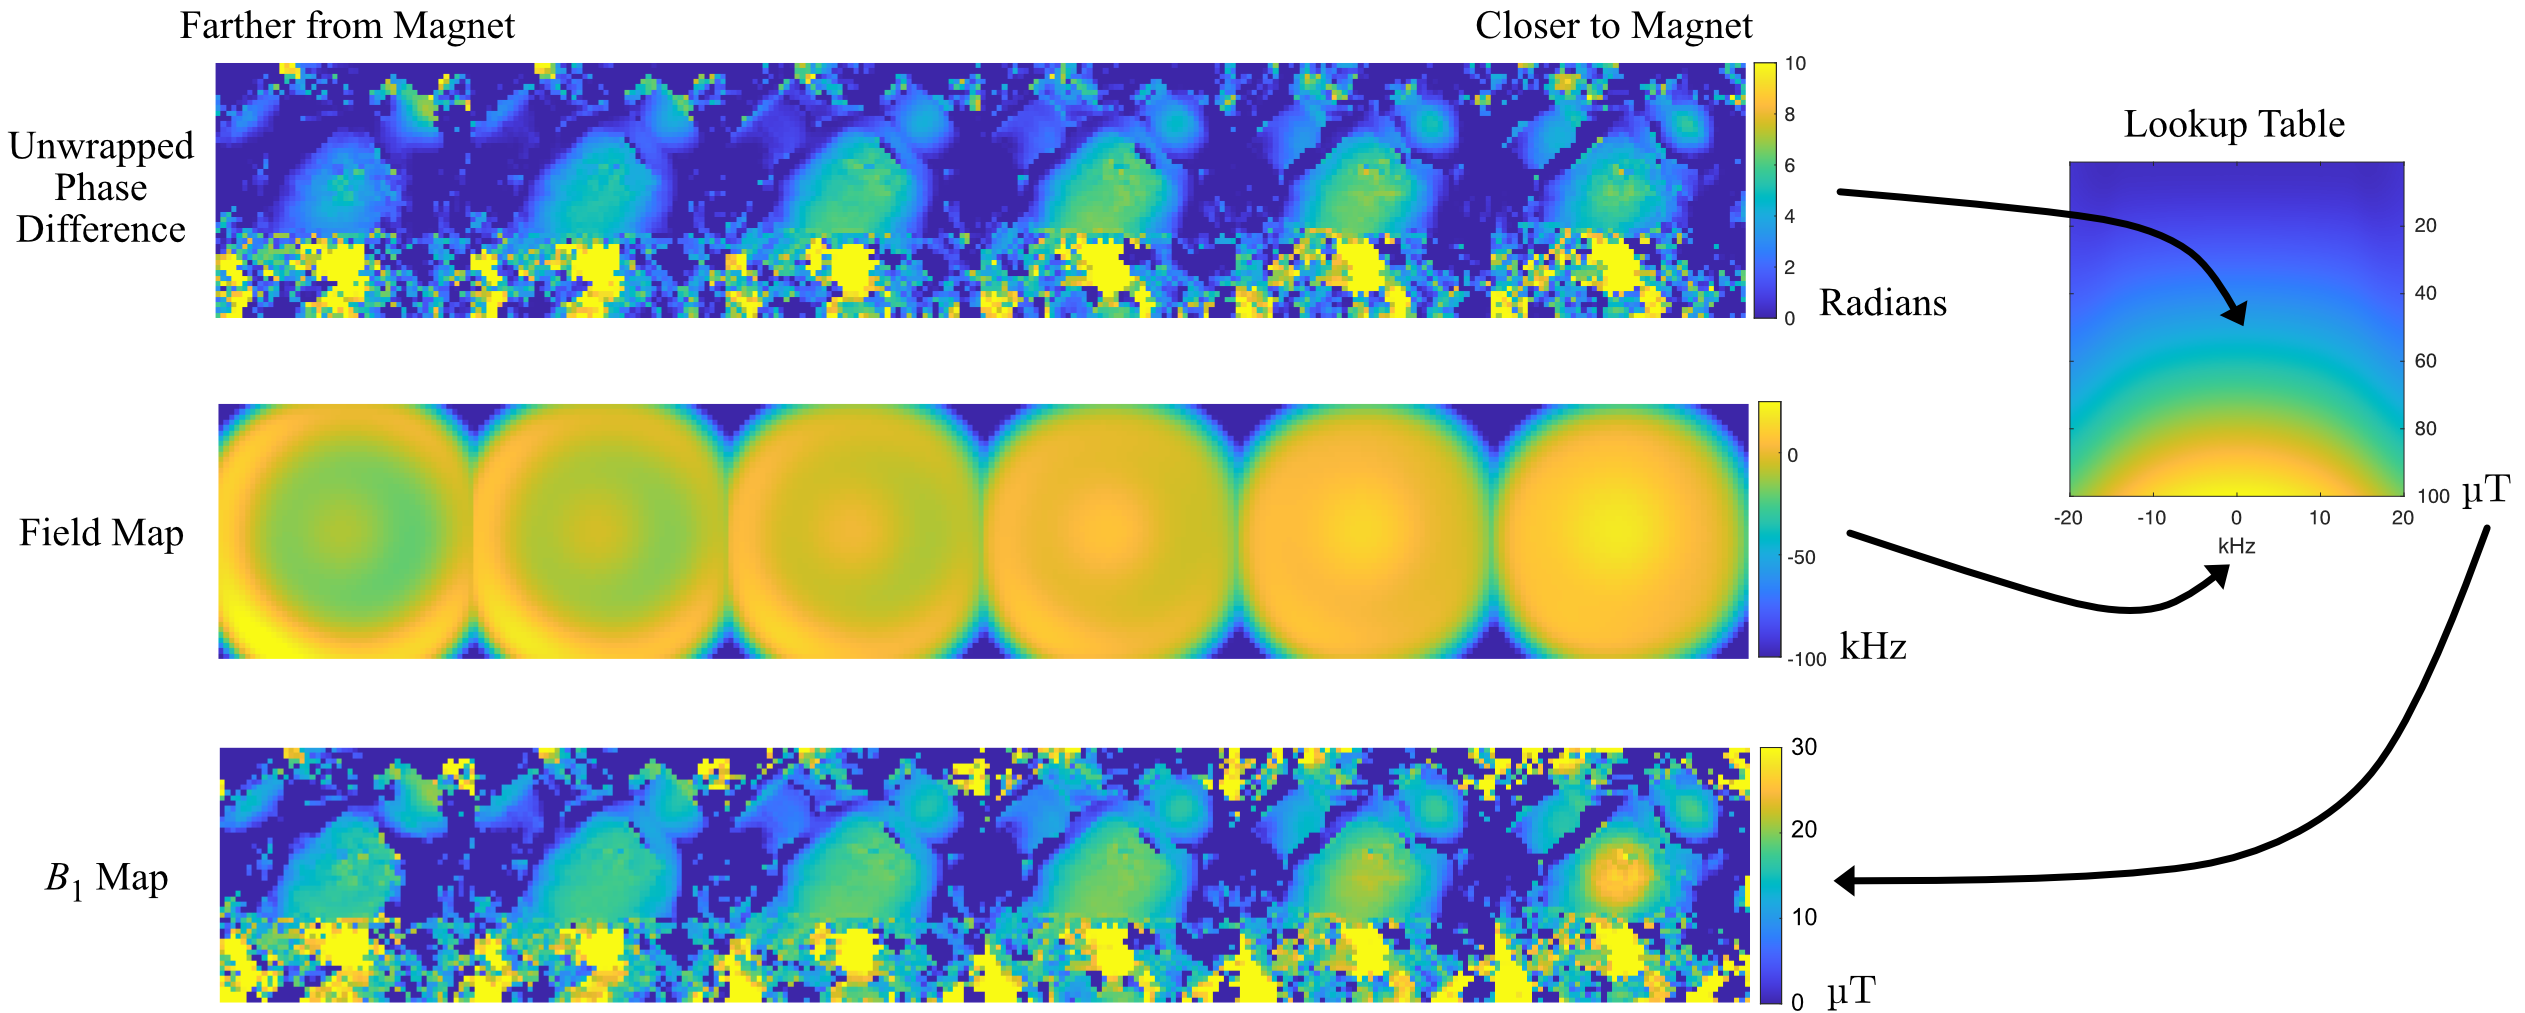
Figure 5: B1 Maps calculated from the images in Figure 4. Top row: Unwrapped phase differences between the positive and negative frequency sweep images. These phases are the z-values of the lookup table operation to calculate B1, which also uses probe-measured frequency offset field maps for this slab (middle row) for the x-coordinate. The y-values of the lookup table are the measured B1’s for each phase and frequency offset. Bottom row: Lookup table-calculated B1 maps. The specific B1 values correspond to the amplitude of the sequence’s excitation pulse.
DOI: https://doi.org/10.58530/2022/1198