1187
Respiratory System Resistance Explained using Hyperpolarized 129Xe MRI Texture Features and Machine Learning1Department of Medical Biophysics, Western University, London, ON, Canada, 2Robarts Research Institute, London, ON, Canada, 3Centre for Heart Lung Innovation, University of British Columbia, Vancouver, BC, Canada, 4Division of Respirology, Department of Medicine, Western University, London, ON, Canada, 5School of Biomedical Engineering, Western University, London, ON, Canada
Synopsis
129Xe MRI ventilation images consist of embedded texture features that may help explain ventilation heterogeneity. We previously showed that 129Xe MRI ventilation features predicted response to biologic therapy in asthma and thus, we postulated that texture features may help explain central and peripheral airways resistance. We employed machine-learning techniques to identify specific 129Xe MRI features that were related to airway resistance. Ventilation texture analysis yielded four unique and two common features that independently explained central and peripheral airways resistance, respectively. These promising results suggest that 129Xe ventilation texture analysis may reveal hidden anatomic-physiologic measurements that lead to ventilation heterogeneity.
Introduction
The forced-oscillation-technique (FOT) provides a way to directly measure central and peripheral airway resistance (R), which in participants with asthma, points to airway abnormalities that may be responsible for ventilation heterogeneity.1 Hyperpolarized noble gas magnetic-resonance-imaging (MRI) provides a way to spatially locate and quantify inhaled gas abnormalities related to airway dysfunction, inflammation and remodeling.2-4 In previous work, MRI ventilation-defect-percent (VDP)5 was shown to be related to peripheral airways resistance measured using FOT in patients with asthma and chronic-obstructive-pulmonary-disease.6,7VDP is a binary measurement of ventilation-defects which disregards signal intensity differences and assumes all ventilated regions contribute equally to global lung function. These signal intensity differences, or ventilation heterogeneity, may be quantified as texture features extracted from gray-level run-length (GLRLM) and co-occurrence matrices (GLCM).8 Hyperpolarized gas MRI-VDP and MRI texture analysis have been previously used to measure post-bronchodilator improvements9,10 in airway function and ventilation and to predict methacholine and biologic therapy responsive participants with asthma. Unfortunately, the physiological interpretation of texture features in the context of pulmonary ventilation MRI remains uncharacterized.
Here we hypothesized that MRI-VDP in combination with shape-based, first-order and higher-order texture features will independently describe central (R19Hz) and peripheral (R5-19Hz) airways resistance measured using FOT. Therefore, the two objectives of this work were to: 1) extract texture features from 129Xe MRI and use a machine-learning regression approach to identify features that explain respiratory system resistance and 2) perform principal-component-analysis (PCA) on significant features to relate these features to oscillometric biomechanics.
Methods
Participants and Data Acquisition:We retrospectively analyzed 71 participants with eosinophilic-asthma (n=24) or post-acute COVID-19 syndrome (PACS) (n=47) and eight healthy volunteers. Data were randomly split into training (n=60) and testing (n=19) sets. Anatomic 1H and 129Xe static ventilation MRI were acquired using a 3.0 Tesla scanner as previously described.11 Anatomic 1H MRI was acquired using a fast-spoiled gradient-recalled-echo sequence (partial-echo acquisition; total acquisition time=8s; repetition-time msec/echo time msec=4.7/1.2; flip-angle=30°; field-of-view=40×40cm2; bandwidth=24.4kHz; 128×80 matrix, zero-padded to 128×128; partial-echo percent=62.5%; 15-17×15mm slices). 129Xe MRI was acquired using a three-dimensional fast-spoiled gradient-recalled echo sequence (total acquisition time=14s; repetition-time msec/echo time msec=6.7/1.5; variable flip-angle; field-of-view=40×40cm2; bandwidth=15.63kHz; 128×128 matrix; 14×15mm slices). Supine participants were coached to inhale a 1.0L bag (400mL 129Xe + 600mL 4He for 129Xe MRI; 1.0L N2 for 1H MRI) from the bottom of a tidal breath with acquisition under breath-hold conditions. Participants performed spirometry12 according to American Thoracic Society guidelines and FOT13 according to European Respiratory Society guidelines using a tremoFlo C-100 Airwave Oscillometry System to measure R between 5 and 37 Hz.
Image Processing and Statistics:
Quantitative MRI analysis was performed using a semi-automated segmentation algorithm, as previously described14 using Matlab 2021b. Texture features were extracted from the 3D-application of GLRLM and GLCM using the PyRadiomics platform.15 Feature selection was performed using f-test statistics to independently rank and identify extracted texture features, including MRI-VDP, which significantly contributed to each machine-learning model’s performance. Two machine-learning models were developed to explain R19Hz and R5-19Hz using Matlab 2021b. Five-fold cross-validation was implemented to prevent over-fitting. Model performance was evaluated using root-mean-square-error (RMSE). Selected features from both models underwent PCA to describe the physiology responsible for MRI ventilation texture features.
Results
Table 1 provides demographic characteristics for all 79 participants. Figure 1 provides 129Xe MRI center slice ventilation images for representative participants with normal or abnormal central or peripheral airways resistance.16As shown in Figure 2, we identified six features per model (four unique features per model, two common features) that were used to explain R19Hz and R5-19Hz; VDP was not identified as a significant feature (rank: R19Hz-48/72, R5-19Hz-65/72) in either model. Table 3 shows the five highest performing models for R19Hz and R5-19Hz. Highest performance for R19Hz and R5-19Hz was achieved using coarse regression trees (RMSE=0.97) and medium regression trees (RMSE=0.71), respectively.
The ten selected features for both models underwent PCA, which revealed that seven features described ventilation heterogeneity (Shape: Maximum 2D Diameter Slice; First Order: Robust Mean Absolute Deviation; GLCM: Difference Average, Difference Entropy, Inverse Variance, Joint Energy; GLRLM: Gray-Level Non-Uniformity), two features described whole-lung ventilation (First Order: Root Mean Squared, Interquartile Range) and one feature described the shape of the ventilation image (Shape: Flatness).
Discussion
We developed two machine-learning regression models to explain oscillometry-measured central and peripheral airways resistances using 129Xe MRI texture features. Central and peripheral airway models each contained four unique and two common features. Both common features were revealed through PCA to describe ventilation heterogeneity, while the central airway feature First Order Root Mean Squared describes highly ventilated pixels while the peripheral airway feature First Order Interquartile Range describes the number of normally ventilated pixels. This suggests that highly ventilated pixels are related to the central airways while the number of normally ventilated pixels are related to the peripheral airways.Conclusion
Hyperpolarized 129Xe MRI texture features that explained central and peripheral airways resistance in patients with eosinophilic-asthma and PACS. We showed for the first time that central and peripheral airway resistance measured using FOT may be explained using hyperpolarized 129Xe MRI texture features. These promising results suggest that 129Xe ventilation texture analysis may reveal hidden anatomic-physiologic measurements that lead to ventilation heterogeneity.Acknowledgements
No acknowledgement found.References
1 Kaczka, D. W. et al. JAP (2011).
2 Svenningsen, S. et al. AJRCCM (2018).
3 Eddy, R. L. et al. AJRCCM (2020).
4 Costella, S. et al. Respirology (2012).
5 Kirby, M. et al. Proc. SPIE (2010).
6 Young, H. M. et al. JAP (2018).
7 Eddy, R. L. et al. PhysiolRep (2019).
8 Haralick, R. M. et al. IEETSystManCyb (1973).
9 Zha, N. et al. AcadRadiol (2016).
10 Kirby, M. et al. Radiology (2011).
11 Svenningsen, S. et al. JMRI (2013).
12 Miller, M. R. et al. ERJ (2005).
13 King, G. G. et al. ERJ (2020).
14 Kirby, M. et al. AcadRadiol (2012).
15 van Griethuysen, J. J. M. et al. CancerRes (2017).
16 Oostveen, E. et al. ERJ (2013).
Figures
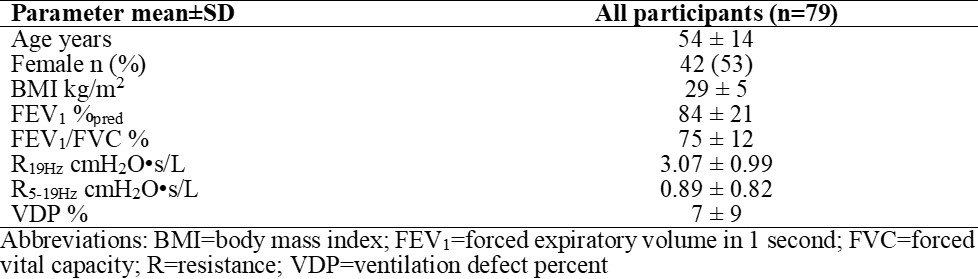
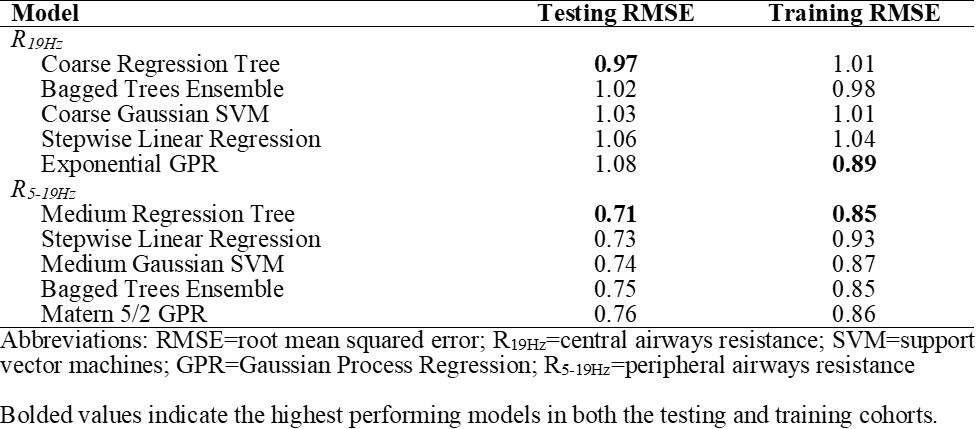
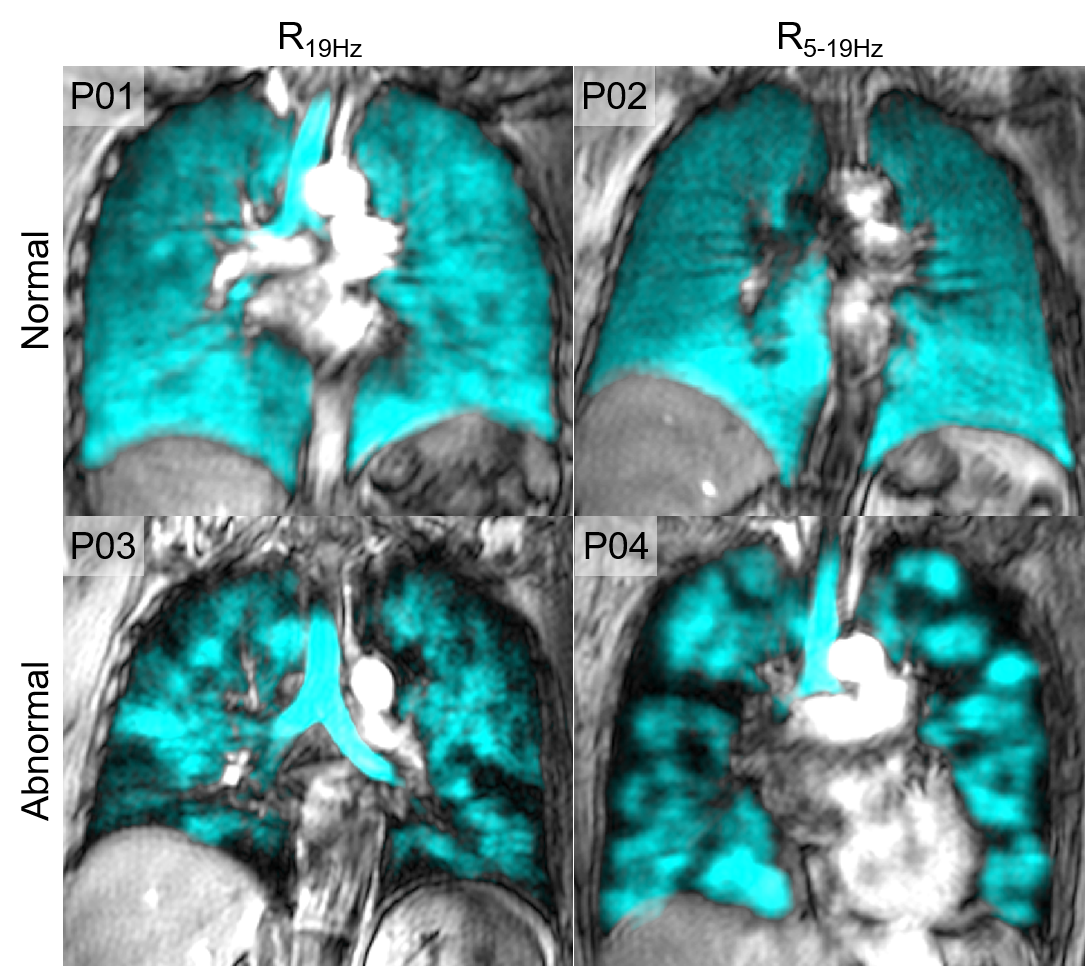
Figure 1. Qualitative results of normal vs. abnormal central and peripheral airways resistance
P01: 52 year old female with post-acute COVID 19 syndrome, R19Hz=5.06 cmH20•s/L
P02: 57 year old female with post-acute COVID-19 syndrome, R5-19Hz=0.49 cmH20•s/L
P03: 62 year old male with eosinophilic asthma, R19Hz=5.28 cmH20•s/L
P04: 56 year old female with eosinophilic asthma, R5-19Hz=1.81 cmH20•s/L
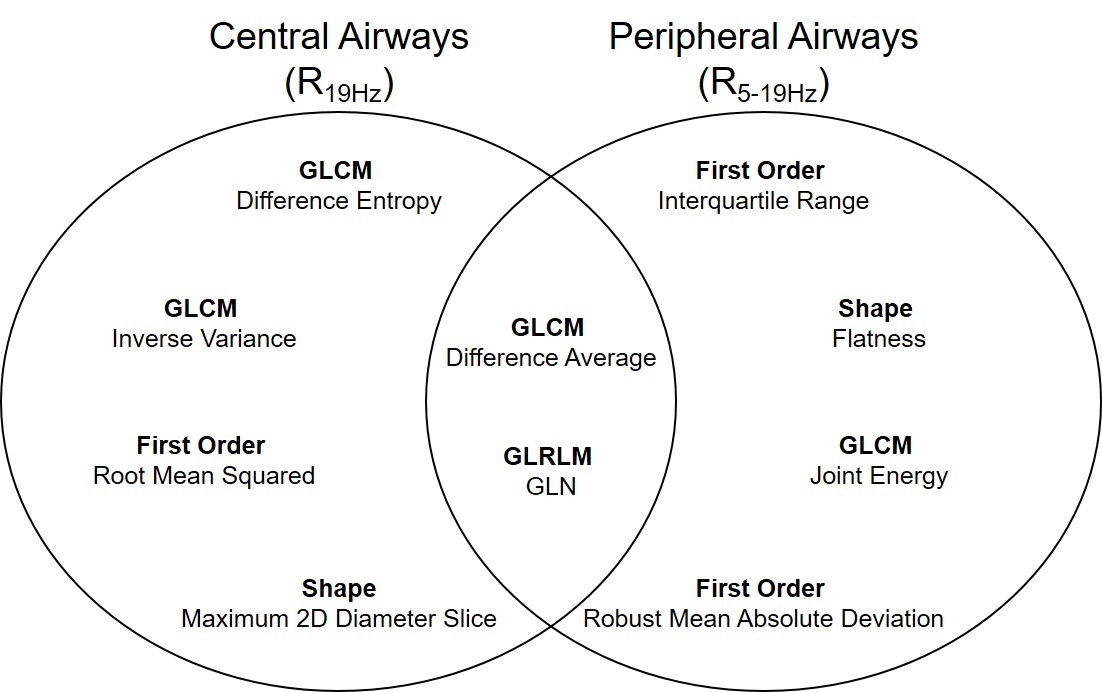
Figure 2. Selected features for central and peripheral airways
GLCM=gray-level co-occurrence matrix; GLRLM=gray-level run-length matrix; GLN=gray-level non-uniformity