1184
Establishing a hemoglobin correction for 129Xe gas exchange MRI1Physics, Duke University, Durham, NC, United States, 2Biomedical Engineering, Duke University, Durham, NC, United States, 3Radiation Oncology, Clinical Science, Duke University, Durham, NC, United States, 4Duke University, Durham, NC, United States, 5Radiology, Clinical Science, Duke University, Durham, NC, United States
Synopsis
Hyperpolarized 129Xe gas MRI provides a spatially resolved method of monitoring gas exchange function in the lungs via 3D reconstruction of RBC/gas and barrier/gas signals. However, the strength of these signals is affected by patient hemoglobin concentration (Hgb). Thus, correcting for Hgb is important for establishing normative healthy reference distributions and accurately assessing the degree of gas exchange impairment. Here, we use a 1D physical diffusion model to establish Hgb-dependent correction factors to standardize gas exchange MRI relative to a fixed Hgb value. This correction can result in substantial changes in the visualization and quantification of gas exchange MRI.
Purpose
Hyperpolarized 129Xe MRI can be used to map 129Xe within airspaces (gas), interstitial tissues and plasma (barrier), and red blood cells (RBCs)1. This method has emerged as a means of characterizing pulmonary diseases, such as chronic obstructive pulmonary diseases (COPD), idiopathic pulmonary fibrosis (IPF), and pulmonary vascular disease1. However, because RBC signal is driven by 129Xe interactions with hemoglobin, and barrier signal contains a contribution from plasma, the relative strength of both the RBC and barrier signals is expected to depend on hemoglobin concentration (Hgb)2. In order to accurately compare data across and within subjects and establish healthy reference metrics, it is necessary to correct for Hgb. Here, we suggest a means to employ the 1D model of gas exchange (MOXE) to establish scaling factors to normalize RBC/barrier, RBC/gas and barrier/gas to a standard Hgb value.Methods
The MOXE model established by Chang estimates the time-dependent diffusive replenishment of 129Xe in barrier and RBC signal after saturation with 90˚ excitation2. We combined this with the principle of TR/flip angle equivalence3 to model the RBC/barrier, barrier and RBC signals across a range of hematocrit values at TR = 15 ms and 20º flip recommended for gas exchange MRI/MRS4. Hematocrit was converted to Hgb using established relationships5. Barrier and RBC Hgb-dependence was used to generate scaling factor (βHgb) relationships to normalize these signals to a standardized Hgb of 15 g/dL, an approximate healthy average Hgb independent of patient sex6. The scaling relationships were fit with 3rd degree polynomials (Figure 2) to facilitate practical computation. These relationships were then used to standardize images from individual patients by using their measured Hgb at the time of MRI. Hgb was measured non-invasively using the Masimo Pronto point of care sensor.To analyze the impact of the Hgb correction, we studied gas exchange data from 14 healthy subjects, who underwent gas exchange MRI/MRS according to published protocols with TR = 15 ms and 20º flip angle4. The areas under fits to MRS peaks were used to calculate RBC/barrier (Figure 1). This ratio was used to reconstruct maps of barrier/gas and RBC/gas, which were quantified into 8 and 6 bins respectively based on established thresholds from a healthy reference cohort7. Corrected quantification maps were created by dividing each voxel of the uncorrected images by the appropriate scaling factor based on that subject’s Hgb. From the uncorrected and corrected maps, metrics for “defect,” “low,” and “high” percentage were calculated based on existing reference populations7.
Results
Figure 2 shows the nonlinear trends in scaling factor relationships for barrier, RBC, and RBC/barrier signals across a Hgb range of 10 – 20 g/dL6. As expected, for patients with Hgb < 15 g/dL, division by these scaling factors boosts both RBC/barrier and RBC/gas signals, while reducing barrier/gas. For barrier and RBC signals, the Hgb correction results in as much as a ~20-30% change. For these more extreme subjects, correction of the RBC/barrier ratio is even larger (~40-60%).Figure 3 demonstrates the effect of the Hgb correction in barrier/gas and RBC/gas images for one of the 14 healthy subjects. Due to this subject’s fairly low Hgb of 10.2 g/dL, the image correction imparts a fairly drastic change to barrier and RBC. Similarly, the associated histograms show significant changes in the intensity distributions, along with the defect, low, and high percentages of each scheme.
To further examine the impact of the correction, we used barrier/gas and RBC/gas intensity distributions from a healthy subject, scaled them by the correction factors corresponding with Hgb values of 10 – 20 g/dL, and plotted the resulting changes in the defect, low, and high percentage metrics. Figure 4 displays these trends superimposed with the percentage changes for all 14 subjects. The impact on low percentage is most extreme for low Hgb in barrier/gas signal and the impact on high percentage is most extreme for high Hgb in barrier/gas signal and low Hgb in RBC/gas signal. For both dissolved-phase signals, the impact on defect percentage is minimal. In Figure 5, we show the aggregate distributions of RBC/barrier, defect, low, and high percentage change for the sample.
Discussion
The MOXE model provides a framework for Hgb correction of gas exchange images and reveals its remarkably strong effects. Most notably, applying this correction to a healthy sample resulted in an average of ~14% increase in RBC/barrier, a metric that is emerging as a robust and important measurement of lung function1.We note that the binning used in our images was based on healthy reference data that was not corrected for Hgb. For future studies, the reference distributions should be built with data that has been corrected for Hgb. Similarly, imaging reports for individual patients should report both uncorrected and Hgb-corrected quantitative metrics. Because Hgb in females tends to be lower than in males, a sex-specific correction may prove more appropriate6. In addition, finite element modeling of Hgb correction as suggested by Stewart could provide a more accurate alternative to the MOXE approach8. These investigations will develop our ability to correct for the effects of Hgb in 129Xe MRI and allow us to more accurately assess gas exchange in healthy subjects and patients with lung disease.
Acknowledgements
R01HL105643, R01HL12677References
1. Wang, Z., He, M., Bier, E., Rankine, L., Schrank, G., Rajagopal, S., Huang, Y.-C., Kelsey, C., Womack, S., Mammarappallil, J., & Driehuys, B. (2018). Hyperpolarized 129XE gas transfer MRI: The transition from 1.5T to 3T. Magnetic Resonance in Medicine, 80(6), 2374–2383. https://doi.org/10.1002/mrm.27377
2. Chang, Y. V. (2012). Moxe: A model of gas exchange for hyperpolarized 129XE magnetic resonance of the lung. Magnetic Resonance in Medicine, 69(3), 884–890. https://doi.org/10.1002/mrm.24304
3. Ruppert, K., Amzajerdian, F., Hamedani, H., Xin, Y., Loza, L., Achekzai, T., Duncan, I. F., Profka, H., Siddiqui, S., Pourfathi, M., Sertic, F., Cereda, M. F., Kadlecek, S., & Rizi, R. R. (2018). Assessment of flip angle–TR equivalence for standardized dissolved‐phase imaging of the lung with hyperpolarized 129xe MRI. Magnetic Resonance in Medicine, 81(3), 1784–1794. https://doi.org/10.1002/mrm.27538
4. Niedbalski, P. J., Lu, J., Hall, C. S., Castro, M., Mugler, J. P., Shim, Y. M., & Driehuys, B. (2021). Utilizing flip angle/TR equivalence to reduce breath hold duration in hyperpolarized 129 xe 1‐point Dixon Gas Exchange Imaging. Magnetic Resonance in Medicine. https://doi.org/10.1002/mrm.29040
5. Nijboer, J. M., van der Horst, I. C., Hendriks, H. G., ten Duis, H.-J., & Nijsten, M. W. (2007). Myth or reality: Hematocrit and hemoglobin differ in trauma. The Journal of Trauma: Injury, Infection, and Critical Care, 62(5), 1310–1312. https://doi.org/10.1097/ta.0b013e3180341f54
6. Billett, H. H. (1990). Hemoglobin and Hematocrit. In Clinical methods: The history, physical, and laboratory examinations. 3rd edition (3rd ed.). LexisNexis UK.
7. Wang, Z., Robertson, S. H., Wang, J., He, M., Virgincar, R. S., Schrank, G. M., Bier, E. A., Rajagopal, S., Huang, Y. C., O'Riordan, T. G., Rackley, C. R., McAdams, H. P., & Driehuys, B. (2017). Quantitative analysis of hyperpolarized129xe gas transfer MRI. Medical Physics, 44(6), 2415–2428. https://doi.org/10.1002/mp.12264
8. Stewart, N. J., Parra-Robles, J., & Wild, J. M. (2016). Finite element modeling of 129XE diffusive gas exchange NMR in the human alveoli. Journal of Magnetic Resonance, 271, 21–33. https://doi.org/10.1016/j.jmr.2016.07.016
Figures
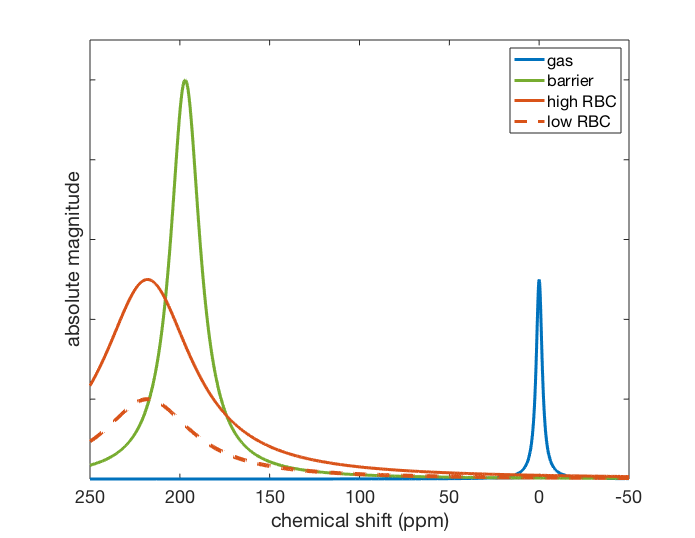
Figure 1. Example fits to MRS gas, barrier, and RBC peaks. RBC/barrier was determined from the ratio of areas under the RBC and barrier fits. The solid red spectrum represents a subject with high RBC/barrier and the dashed red spectrum represents a subject with low RBC/barrier.
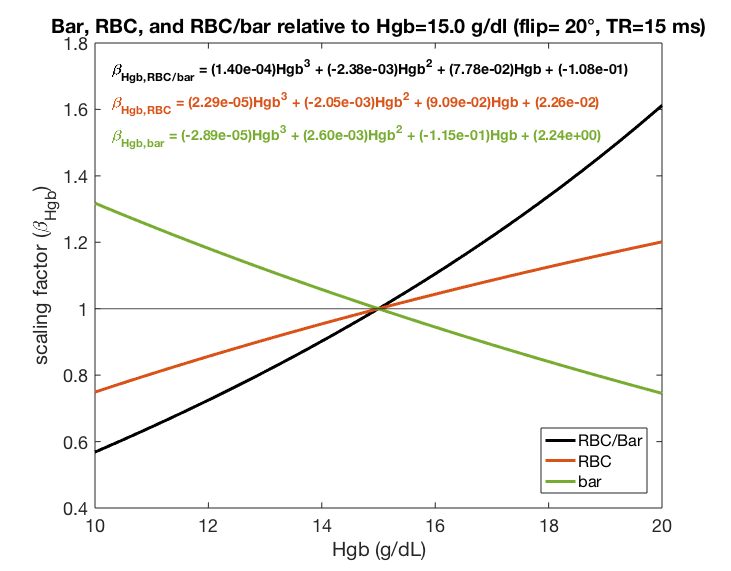
Figure 2. Third degree polynomial fits of Hgb scaling factor relationships for barrier, RBC, and RBC/barrier signal as determined from the Hgb dependence of the 1D MOXE model. Scaling factors are relative to an approximate healthy average Hgb of 15 g/dL6. For extreme Hgb values, these factors can adjust barrier and RBC signal by over 20% and RBC/barrier signal by over 60%.
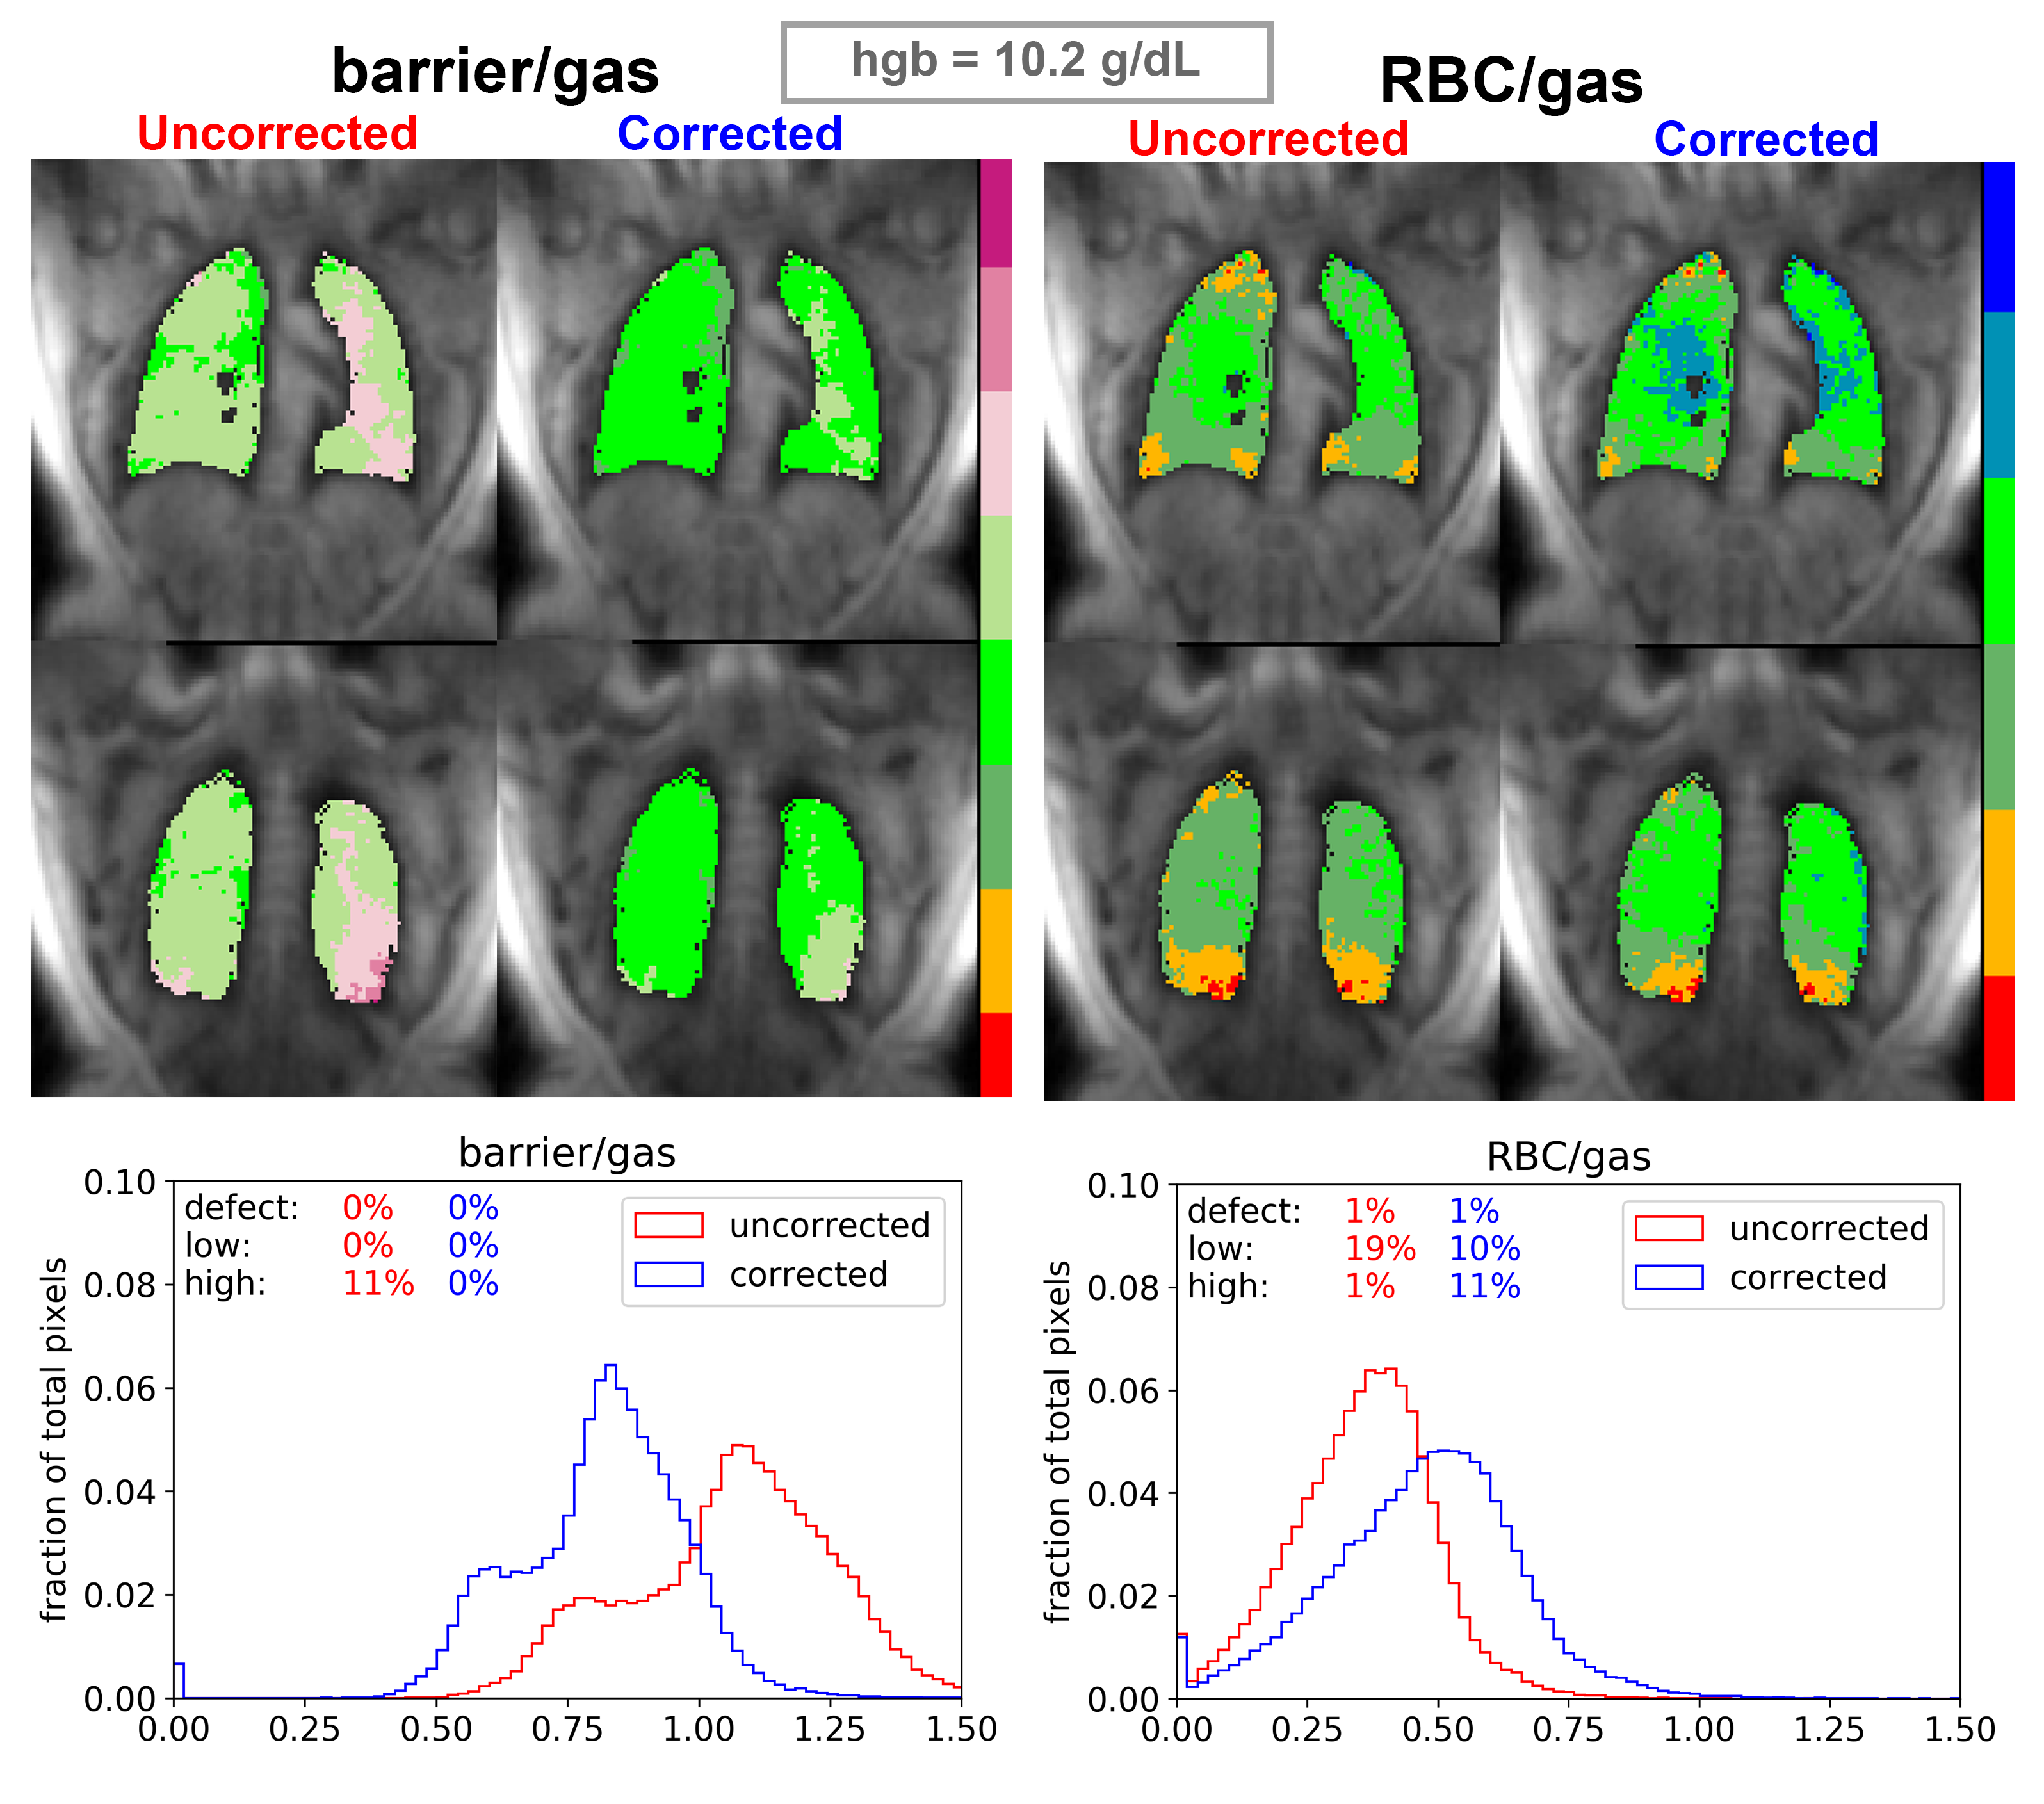
Figure 3. Uncorrected barrier/gas and RBC/gas images for a subject with low Hgb of 10.2 g/dL. We also show the changes in pixel intensity distributions and defect, low, and high percentage. The subject’s low Hgb may bias barrier signal to be higher and RBC signal to be lower; corrected schemes show decreased and increased values for these metrics, respectively. Notably, the RBC/barrier increases from 0.292 to 0.501 after correction.
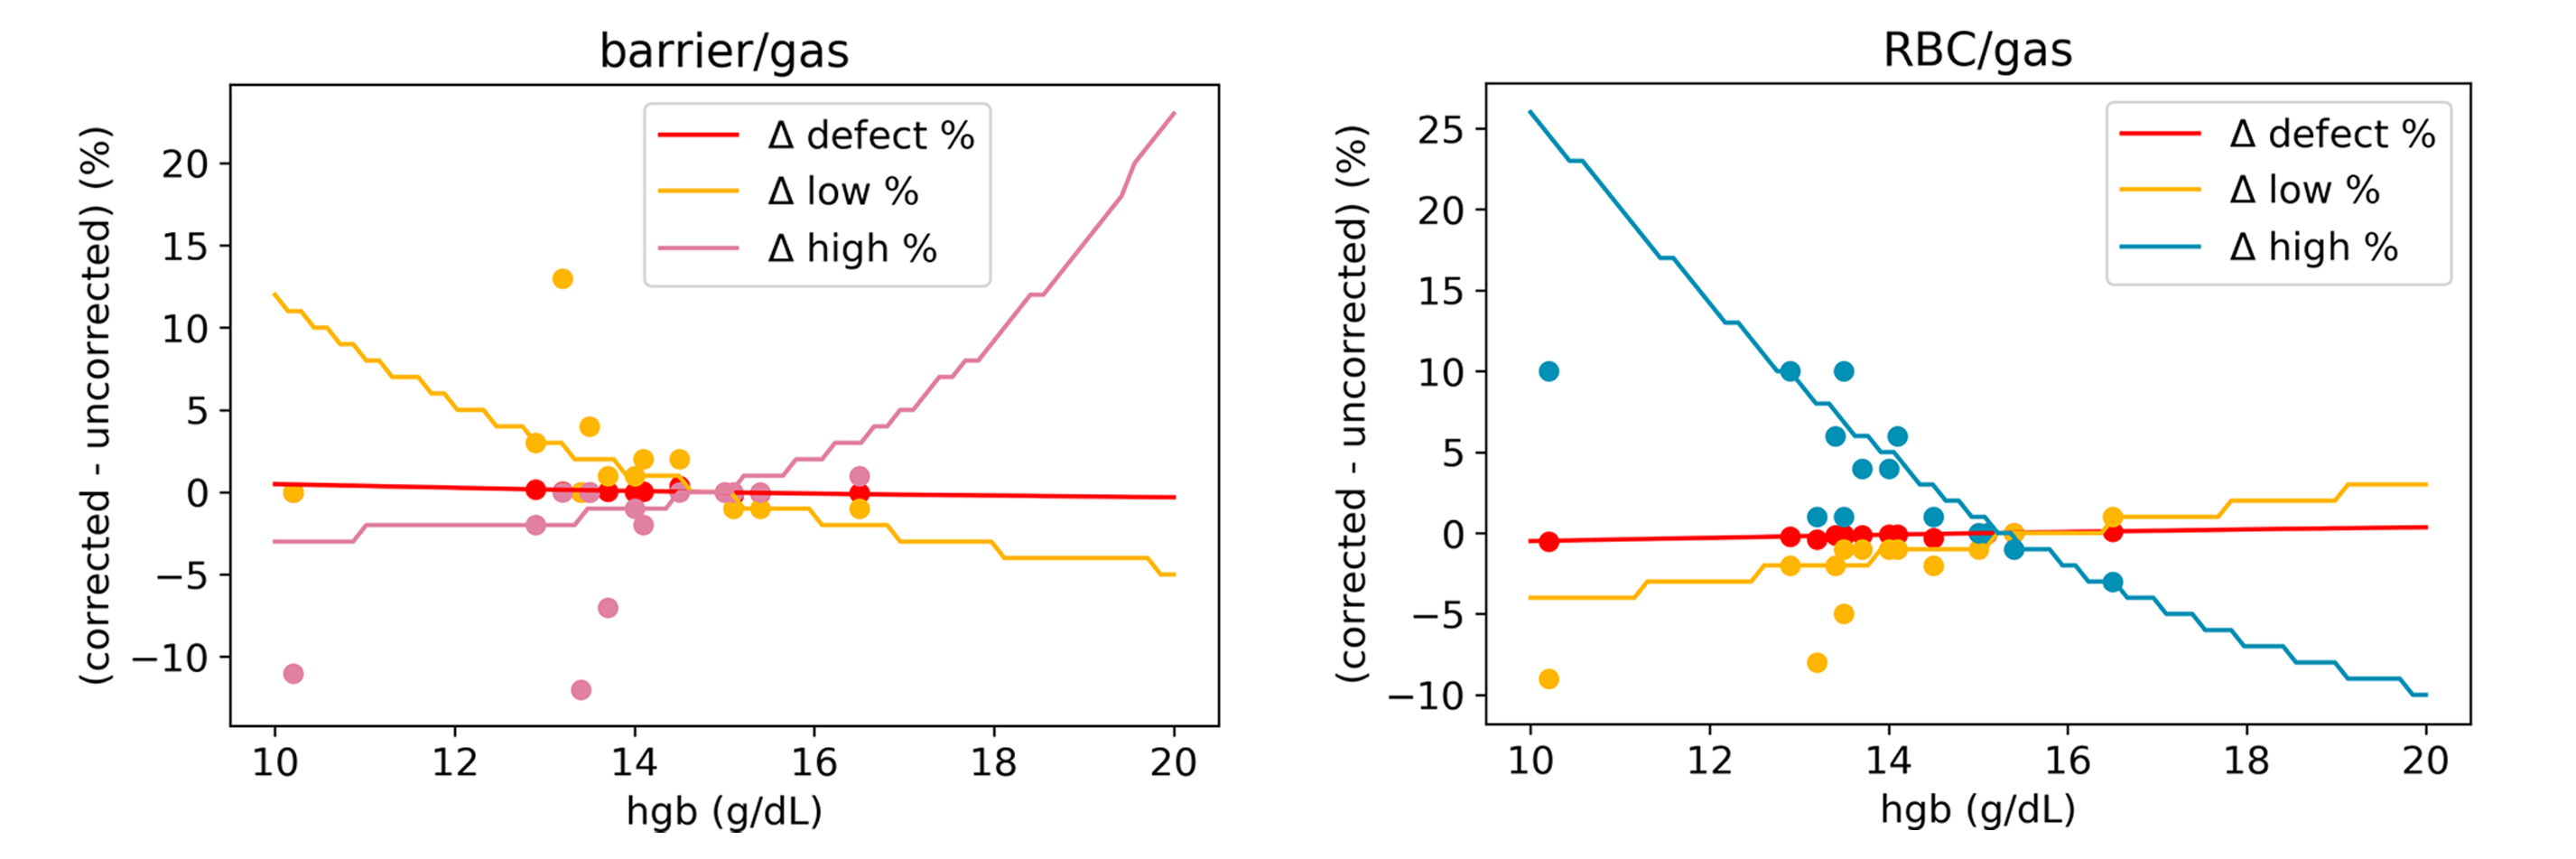
Figure 4. Lines illustrate changes in defect, low, and high percentage bins when Hgb is allowed to vary across a range of values in one example subject. Dots represent the actual percentage changes for each of the 14 healthy subjects in the study.
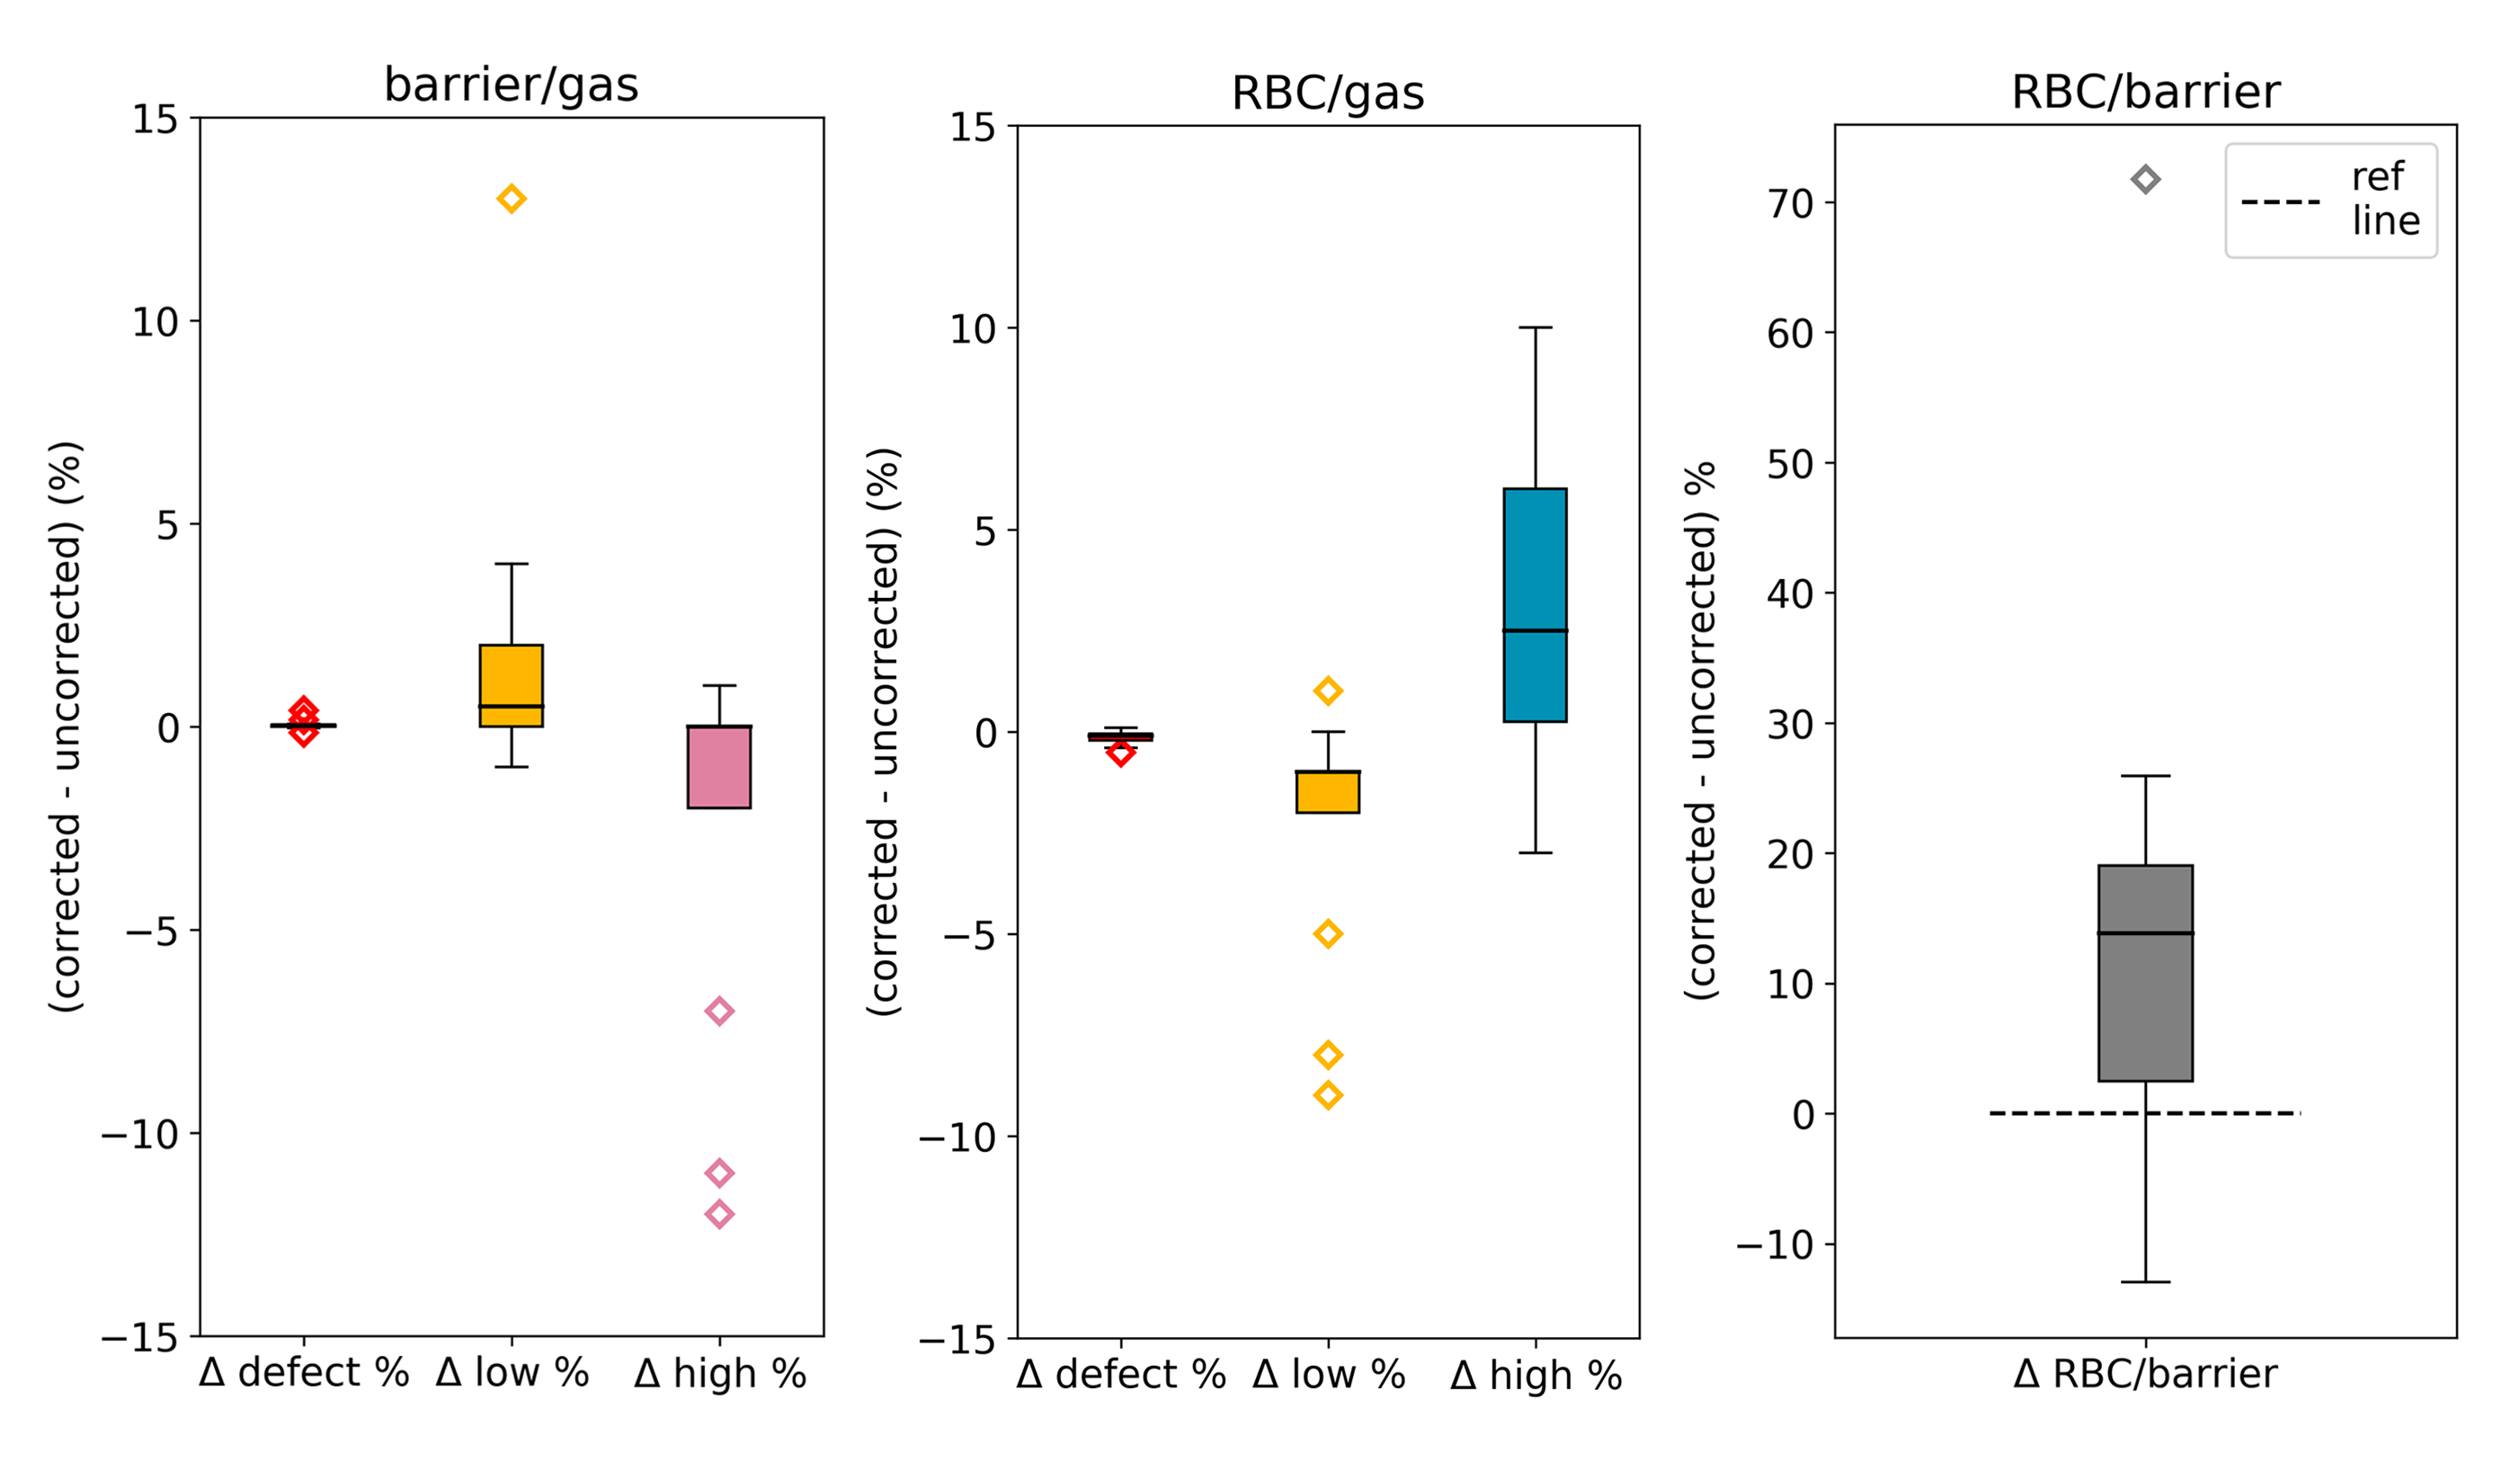
Figure 5. Box plots showing the aggregate changes across all subjects imparted by Hgb correction for the defect, low, and high percentage bins as well as the RBC/barrier ratio. The bias toward decreasing high barrier and low RBC with increasing high RBC is reflective of the fact that Hgb values in our study group were on average below 15 g/dL. This is further shown in the distribution of RBC/barrier changes, with some subjects’ RBC/barrier ratios increasing as much as 20 to 70%.