1182
129Xe chemical shift mapping in the lungs with 3D density-weighted MRSI
Graham Norquay1, Guilhem J. Collier1, Rolf F. Schulte2, and Jim M. Wild1
1Infection, Immunity and Cardiovascular Disease, University of Sheffield, Sheffield, United Kingdom, 2GE Healthcare, Munich, Germany
1Infection, Immunity and Cardiovascular Disease, University of Sheffield, Sheffield, United Kingdom, 2GE Healthcare, Munich, Germany
Synopsis
3D density-weighted MRSI was used to regionally measure the 129Xe chemical shift from xenon in the lung airspaces (G), lung tissue/plasma (TP) and pulmonary red blood cells (RBC) at three lung inflation states. The 129Xe-RBC and 129Xe-G chemical shifts were both found to increase with increasing lung inflation (increase in alveolar pO2) while the 129Xe-TP shift was observed to be lung-inflation independent. The RBC chemical shift maps presented here may be used in patient populations to detect areas of low blood oxygenation in diseases presenting regional hypoxia in the lungs and other well-perfused organs such as the brain and kidneys.
Introduction
MR imaging and spectroscopy of hyperpolarised 129Xe dissolved in pulmonary red blood cells (RBCs) and parenchymal tissue/plasma (TP) is of interest for investigating a range of cardiopulmonary diseases.1 It has been shown previously that the 129Xe-RBC resonance is sensitive to oxygenation, exhibiting a non-linear increase in chemical shift with increasing blood oxygenation.2,3 The relationship between the 129Xe-RBC chemical shift and RBC oxygenation has been used previously to detect changes in lung blood oxygenation by acquiring MR spectra of hyperpolarised 129Xe during breath-hold apnoea.3 While offering a promising method to non-invasively measure blood/tissue oxygenation, spectra in those experiments were acquired globally and therefore did not provide regional measurements of lung blood oxygenation. The goal of this work was to implement and validate 3D density-weighted MRSI for 129Xe-RBC chemical shift/oxygenation mappings of the lungs and to determine the effect of lung inflation on the 129Xe chemical shift by performing the measurements at three lung inflation levels.Methods
A spectrally-tailored RF pulse4 with a duration of 1.2ms and partial self-refocusing was designed for scanning at 1.5T to excite the dissolved and gas phase with flip angles of 10° and 0.1°, respectively. A 3D density-weighted MRSI trajectory was designed with an isotropic voxel size of (2.9 cm)3, matrix size of 14×14×7 and a FOV=40×40×20cm3, requiring a total of 1799 RF excitations. In the spectral dimension, 88 sample points were acquired with BW=20kHz. An optimised crusher gradient and RF spoiling scheme with TR=8ms (TE=0.9ms) resulted in a total acquisition time of 14.4s, suitable for a single breath-hold.Spectra were zero-filled to 256 samples and reconstructed for frequency-domain processing. After masking, data were fit to a three-peak Lorentzian to determine the RBC, TP and G peak positions.
The sequence was acquired during breath-hold on a healthy male volunteer at three different lung inflation states: residual volume (RV)+1L, functional residual capacity (FRC)+1L and total lung capacity (TLC). Each breath-hold consisted of inhaling 1L of enriched xenon gas (86% 129Xe) polarised to ~30%5 on a 1.5T HDx GE scanner equipped with a 129Xe transmit-receive vest coil (CMRS).
Histogram analysis was performed to determine parameters describing the chemical shift distribution corresponding to RBC, TP and G resonances for each lung inflation state.
Results and Discussion
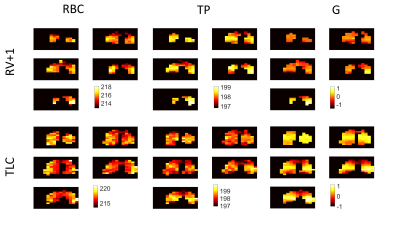
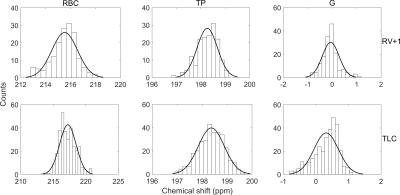
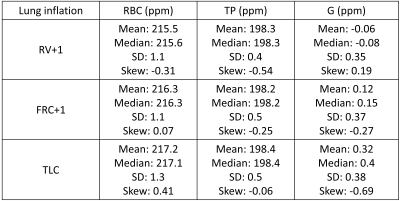
129Xe chemical shift maps for RBC, TP and G resonances are shown in Fig. 1. The RBC chemical shift exhibits higher values towards the lateral edges of the lungs, with the biggest variation observed in the middle slices at TLC. This suggests blood in the alveolar capillaries towards the outer edges of the lungs may be more oxygenated when compared to blood within alveolar capillaries more proximal to the heart. There is no clear trend in the TP chemical shift over the lungs at any of the lung inflation states. The G chemical shift is lower by ~1.5 ppm in the apices and bases when compared to the mid-section of the lungs at TLC. This is consistent with previous observations where it was reported that spherical microscopic magnetic susceptibility effects cause portions of the lungs with larger alveolar-space/conducting-airway ratios (apices and bases) to have ~2ppm lower G chemical shift values.6 However, larger length scale bulk magnetic susceptibility effects may also play a role, with significant susceptibility gradients present at the bases and apices of the lungs as observed previously with SPGR signal dephasing and SSFP banding in hyperpolarised gas ventilation MRI.7-9All 129Xe chemical shift distributions followed an approximate normal distribution (skew <0.5) with the exception of the G resonance at TLC which exhibited a negative skew of ~-0.69 (Fig. 2, Fig. 4). This may be attributed to the opening up of conducting airways, where a reduction in spherical microscopic magnetic susceptibility effects should shift the G resonance downfield (positive ppm shift). Additionally, expansion of the alveoli at TLC causes a smaller fraction of 129Xe nuclei to be in contact with heterogeneous diamagnetic tissue interfaces, potentially adding to the skewed G chemical shift distribution at TLC.
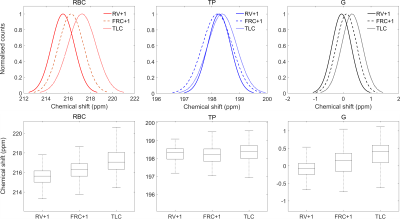
The mean RBC and G chemical shifts were found to increase with increased lung inflation level while the TP chemical shift remained approximately constant at all three lung inflation states (Fig. 3, Fig. 4), suggesting an increase in pO2 at elevated lung inflation is predominantly responsible for the observed increases in the RBC and G chemical shift values. This is consistent with previous observations of RBC shift increases with blood oxygen saturation3 and an expected downfield shift of the G peak from reports of gaseous xenon interactions with molecular oxygen (0.939 ppm/amagat as reported in ref.10).
Conclusions
Density-weighted MRSI was used to regionally quantify the 129Xe chemical shifts from RBCs, TP and G resonances in the lungs. The RBC and G shifts were found to increase with increasing lung inflation/pO2 elevation while the TP shift exhibited lung-inflation independence, suggesting the TP resonance is a potentially a more reliable reference peak against which to quantify RBC shifts for experiments performed at variable lung inflations. More generally, the RBC chemical shift mapping approach described here may be of use in measuring low blood oxygenation in lung diseases that cause focal hypoxia in the lungs and in other well-perfused organs such as the brain and kidneys.Acknowledgements
This work was funded by the University of Sheffield, Medical Research Council (MR/M022552/1) and the National Institute for Health Research (NIHR-RP-R3-12-027).References
- Eddy RL, Parraga G. Pulmonary xenon-129 MRI: new opportunities to unravel enigmas in respiratory medicine. European Respiratory Journal 2020;55(2):1901987.
- Wolber J, Cherubini A, Leach MO, Bifone A. Hyperpolarized 129Xe NMR as a probe for blood oxygenation. Magnetic Resonance in Medicine 2000;43(4):491-496.
- Norquay G, Leung G, Stewart NJ, Wolber J, Wild JM. 129Xe chemical shift in human blood and pulmonary blood oxygenation measurement in humans using hyperpolarized 129Xe NMR. Magnetic Resonance in Medicine 2017;77(4):1399-1408.
- Schulte RF, Collier GJ, Ball J, Norquay G, Rao M, Wild JM. Imaging Gas-Exchange Lung Function using Density-Weighted MRSI and Hyperpolarised 129Xe Gas. Proc. ISMRM 2020: p. 3562.
- Norquay G, Collier GJ, Rao M, Stewart NJ, Wild JM. 129Xe-Rb Spin-Exchange Optical Pumping with High Photon Efficiency. Physical Review Letters 2018;121(15):153201.
- Virgincar RS, Robertson SH, Nouls J, Degan S, Schrank GM, He M, Driehuys B. Establishing an accurate gas phase reference frequency to quantify 129Xe chemical shifts in vivo. Magnetic Resonance in Medicine 2017;77(4):1438-1445.
- Wild JW, Fichele S, Woodhouse N, Paley MJN, Swift A, Kasuboski L, van Beek EJR. Assessment and compensation of susceptibility artifacts in gradient echo MRI of hyperpolarized 3He gas. Magnetic Resonance in Medicine 2003;50(2):417-22.
- Wild JM, Teh K, Woodhouse N, Paley MNJ, Fichele S, Zanche N, Kasuboski L. Steady-state free precession with hyperpolarized 3He: experiments and theory. Journal of Magnetic Resonance 2006;183(1):13-24.
- Deppe MH, Parra-Robles J, Ajraoui S, Parnell, Clemence M, Schulte RF, Wild JM. Susceptibility effects in hyperpolarized (3)He lung MRI at 1.5T and 3T. Journal of Magnetic Resonance Imaging 2009;30(2):418-23.
- Jameson CJ, Keith Jameson A. Density dependence of 129Xe N.M.R. chemical shifts in O2 and NO. Molecular Physics 1971;20(5):957-959.
Figures

Figure 1: Chemical
shift maps of 129Xe in the lungs at two lung inflation states:
residual volume (RV)+1L and total lung capacity (TLC). RBC represents the 129Xe
chemical shift in red blood cells within the alveolar capillaries; TP is
the 129Xe chemical shift in lung tissue/blood plasma; and GAS is the
129Xe chemical shift in the alveolar airspaces. For each map, slices
go from posterior to anterior (top left most posterior, bottom left most
anterior).

Figure 2: Histograms of 129Xe
chemical shift distribution for 129Xe in red blood cells (RBC),
tissue/plasma (TP) and lung air space (G). Top and bottom rows are histograms
at lung inflation levels residual volume (RV)+1L and total lung capacity (TLC).
Normal distribution fits are overlaid on each histogram plot.

Figure 3: Top row shows histogram
fits for the 129Xe chemical shift distributions for the red blood
cell (RBC), tissue/plasma (TP) and gas (G) resonances for three lung inflation
states: residual volume (RV)+1L, functional residual capacity (FRC)+1L and
total lung capacity (TLC). Bottom row shows box plots for each 129Xe
resonance at each lung inflation.

Figure 4: Summary of 129Xe
chemical shift distribution values for each resonance (RBC = red blood cells,
TP = tissue/plasma and G = xenon in the lung alveoli). The (Pearson’s) skew =
3x(mean-median)/SD where SD is the standard deviation from the mean.
DOI: https://doi.org/10.58530/2022/1182