1181
Deuterated trityl spin probe for in vivo pO2 imaging with Time-Domain EPR1NCI, Bethesda, MD, United States, 2GenEpria Consulting, Inc, Columbia, MD, United States
Synopsis
In this work, we present our first 3D in vivo EPR oximetry study using Ox071 spin probe in comparison with Ox063 oximetry. The R2* change with [Ox071] and pO2 was calibrated using standard solutions. In vivo EPR imaging of a mouse tumor was performed on successive days by using either Ox071 or Ox063. The zero gradient signal level of Ox071 was about twice stronger and lasted almost twice longer compared to Ox063. The spin density, and pO2 maps and pO2 histograms of tumor regions marked by co-registration with MRI were similar between Ox063 and Ox071.
Introduction
EPR imaging using the triarylmethyl (TAM) radicals offers fast scan of pO2 maps in vivo. In our laboratory, routine scans of pO2 maps were performed by measuring the R2* of Ox063 spin probe in single point imaging (SPI) modality1. In a previous study,2 we have shown that Ox071 spin probe, a deuterated version of Ox063,3 may be used to assess R1 which offers better pO2 resolution than by using R2*. However, R1 based imaging method for in vivo measurement is associated with long scan time and high energy absorption rate. In this work, we present our first 3D in vivo oximetry study using Ox071 spin probe by SPI modality. The measurement of R2* instead of R1 allowed faster scans. The relatively narrower linewidth of Ox071 compared to Ox063 provided images with higher resolution and stronger signal level and lower dose of the spin probe. While the long lasting signal of Ox071 is beneficial, the experimental parameters are to be optimized to overcome the disturbance by echo contributions at short repetition times.Methods
MIA PaCa-2 tumors of about 10 mm (diameter) were grown in the hind leg of 3 months old athymic mice. EPR scans were performed using the same mouse on successive days by tail vein injection of either Ox071 or Ox063 (1.125 mmol/kg for both probes) on the in-house built EPRI scanner. Aqueous solutions of Ox071 were prepared in epoxy sealed glass tubes at concentrations of 1, 2, 5 and 10 mM. The relationship between pO2 and R2* was assessed using 2mM Ox071 solutions bubbled with gases containing 0%, 2%, 5%, 10% and 21% oxygen. The relationship between [Ox071] and R2* was assessed at 0% oxygen. Image formation and pO2 map calculations were done using in-house developed MATLAB scripts. The estimation of pO2 maps were done by multi-gradient method using gradient maxima of 14, 11.4, and 9.6 mT/m. The mouse 3D imaging data were acquired at 19 x 19 x 19 Cartesian grid and the image reconstruction was done at 96 x 96 x 96 grid by zero-filling the k-space matrix.Results and Discussion
In the first step, the R2* values were calculated by fitting the log(Signal) of FID from 0.25 – 1.5 μs after the deadtime. The relationship between R2* and [Ox071] wasR2* (MHz) = 0.05062 [Ox071 mM] + 0.49573 [1]
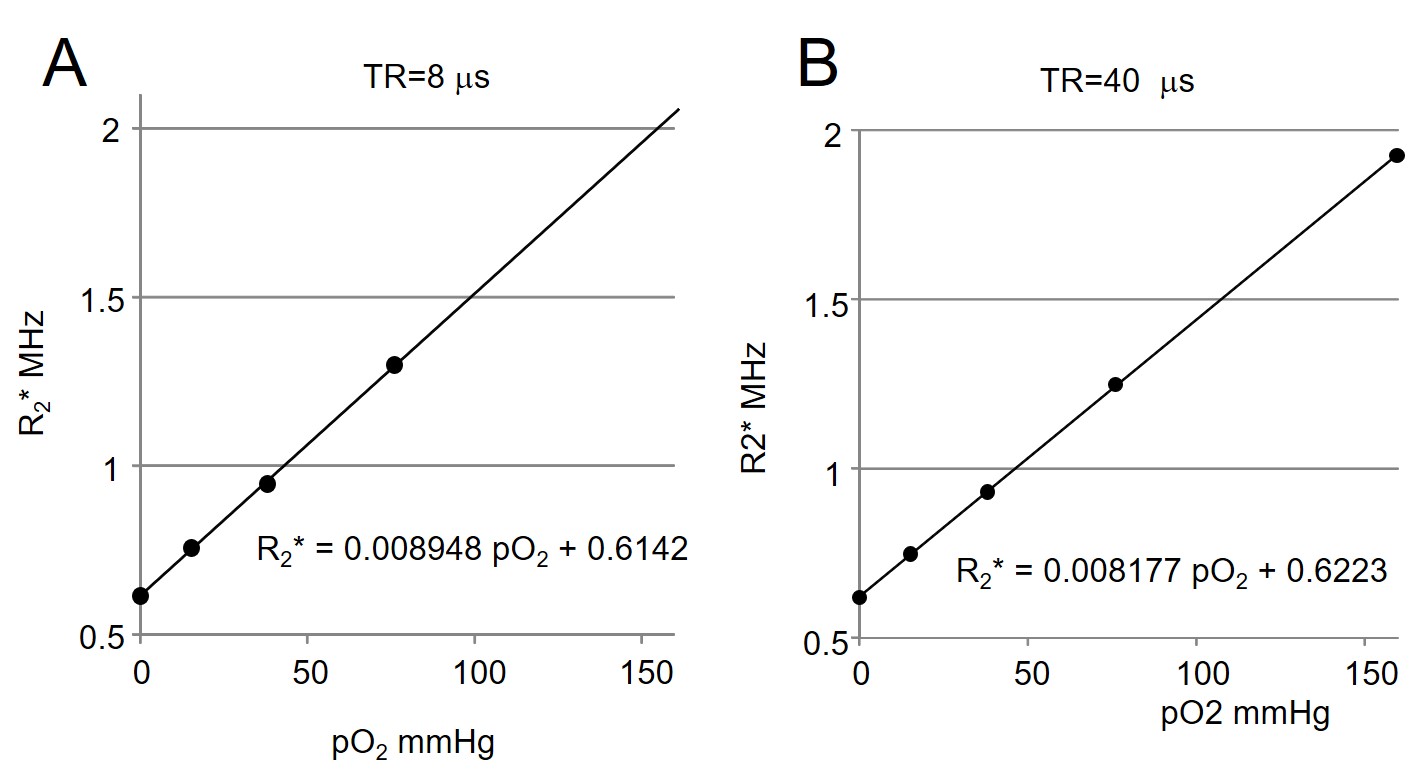
R2* vs. pO2 relationship was examined at the TR values of 4, 6, 8, 12, 15, 20, 28 and 40 μs. When TR ≥ 28 μs, R2* is linearly correlated to pO2 in the range of 0 – 21%. At TR = 40 μs (Figure 1),
R2* (MHz) = 0.008177 [pO2 mmHg] + 0.6223 [2]
Interestingly, the R2* is found to be linearly proportional to pO2 in the range of 0 – 10% for TR values from 4.0 – 20 μs. At TR = 8 μs,
R2* (MHz) = 0.008948 [pO2 mmHg] + 0.6142 [3]
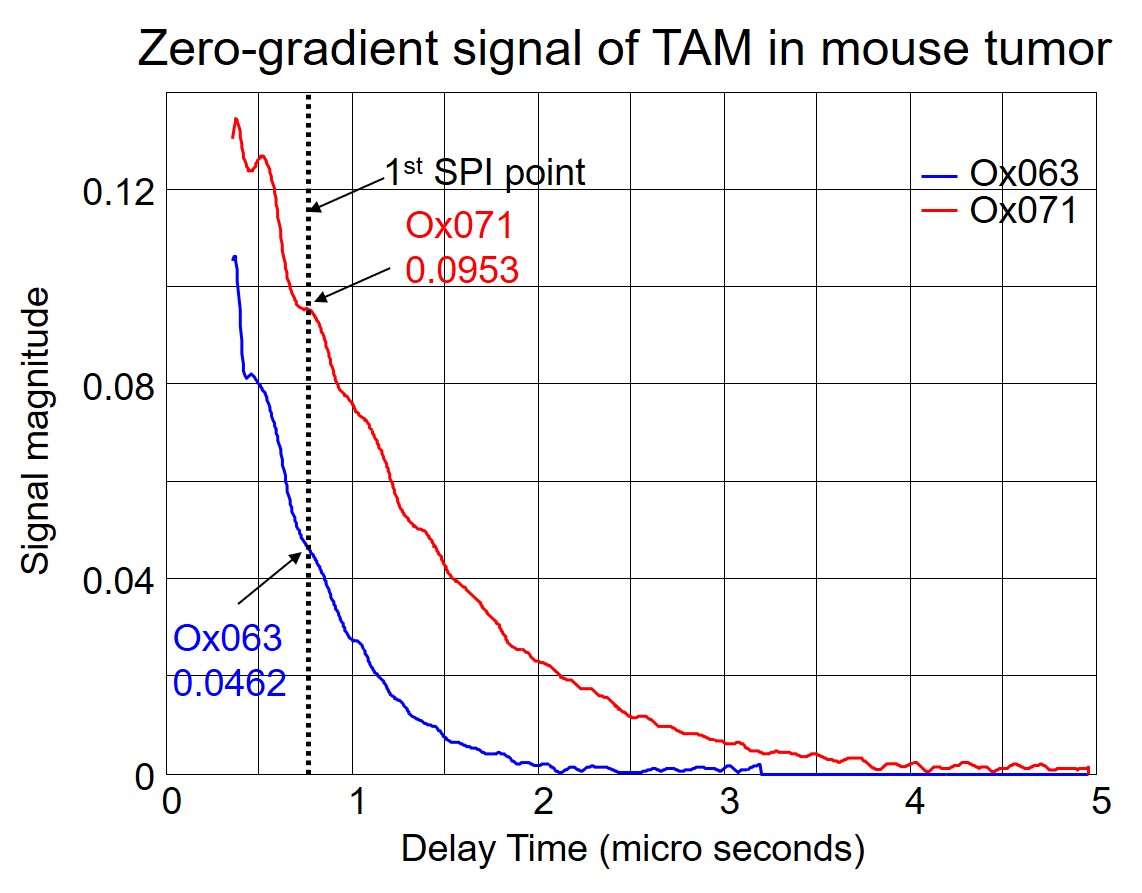
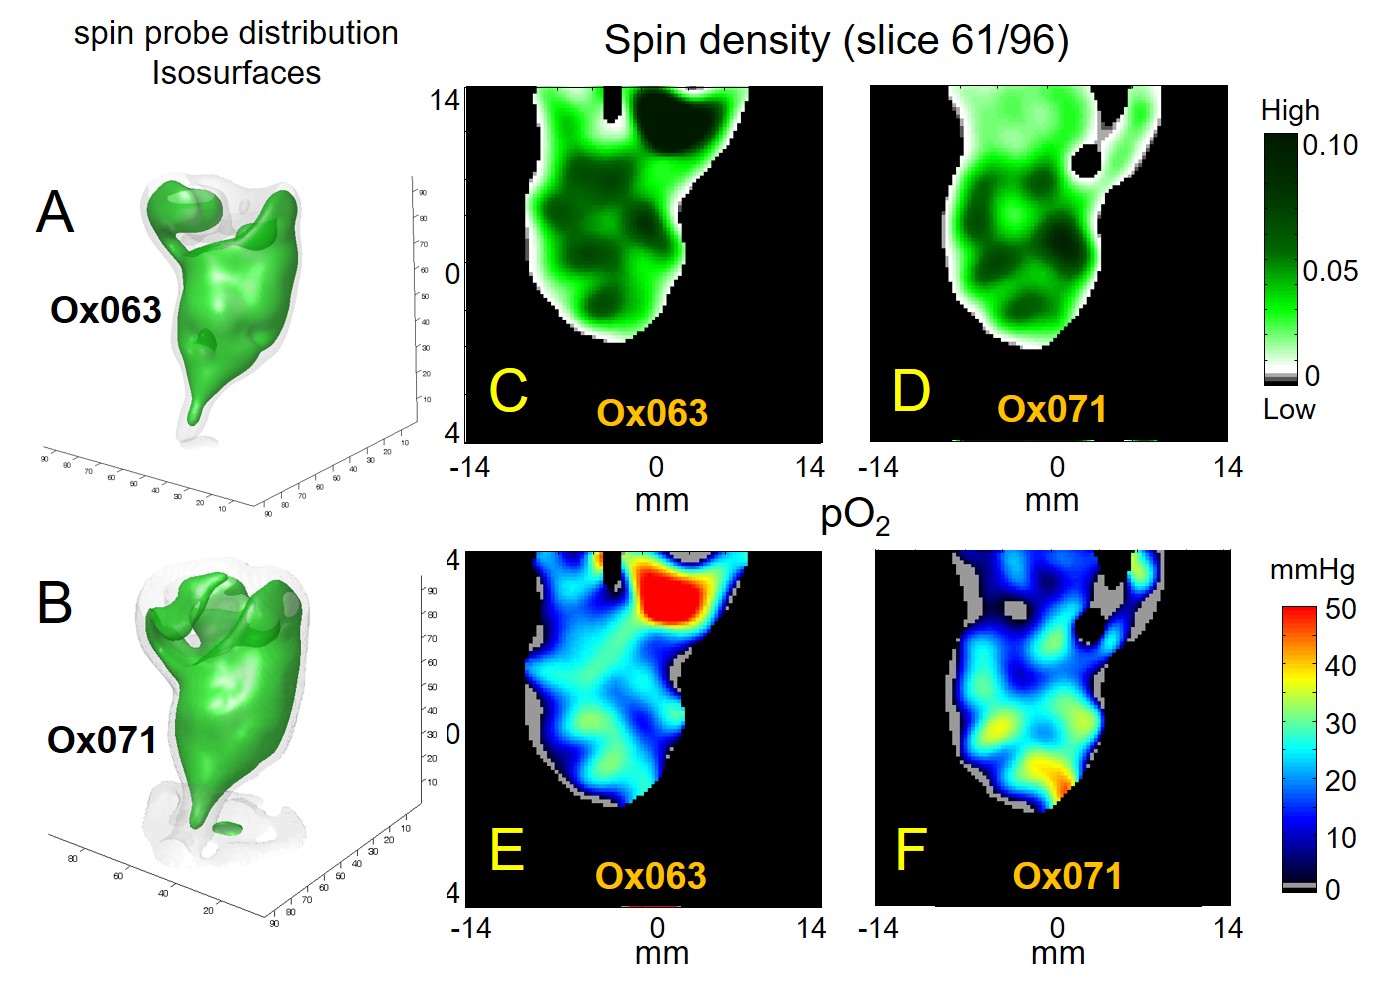
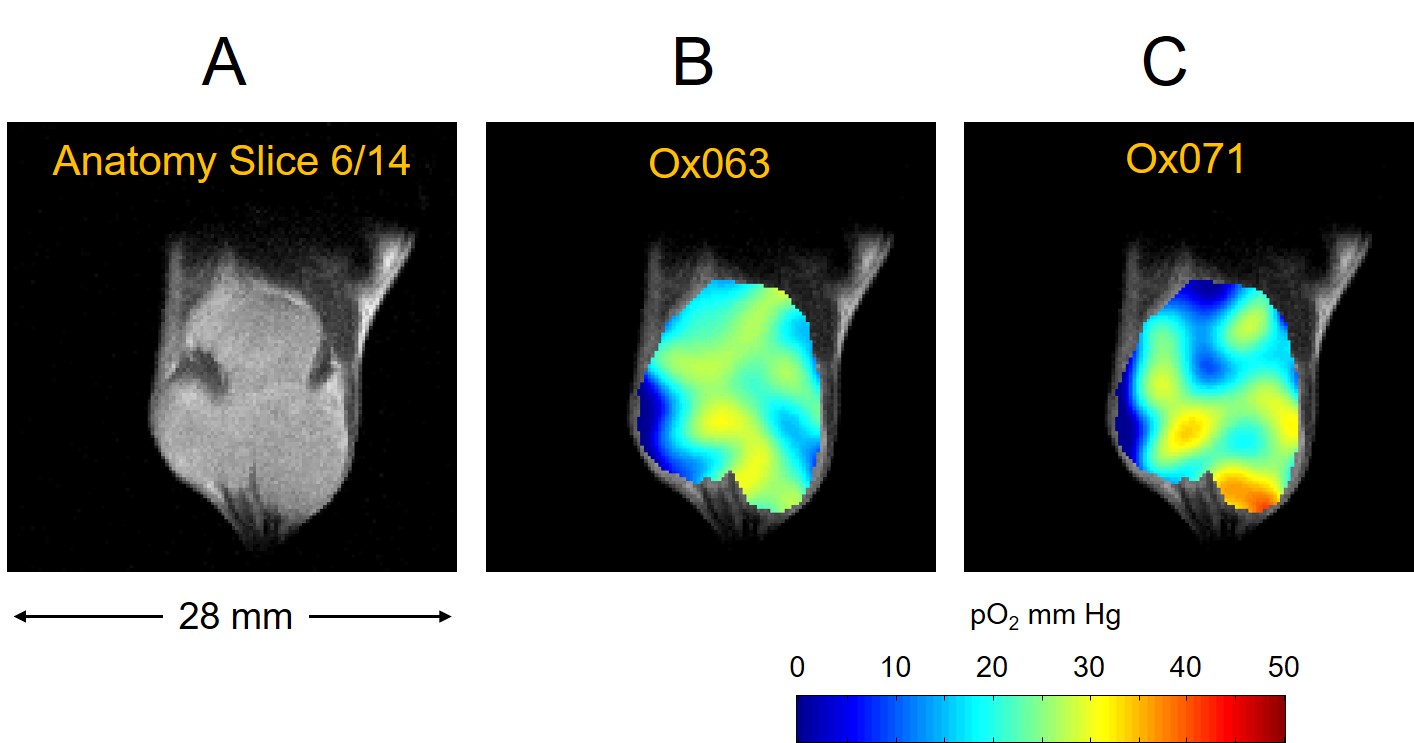
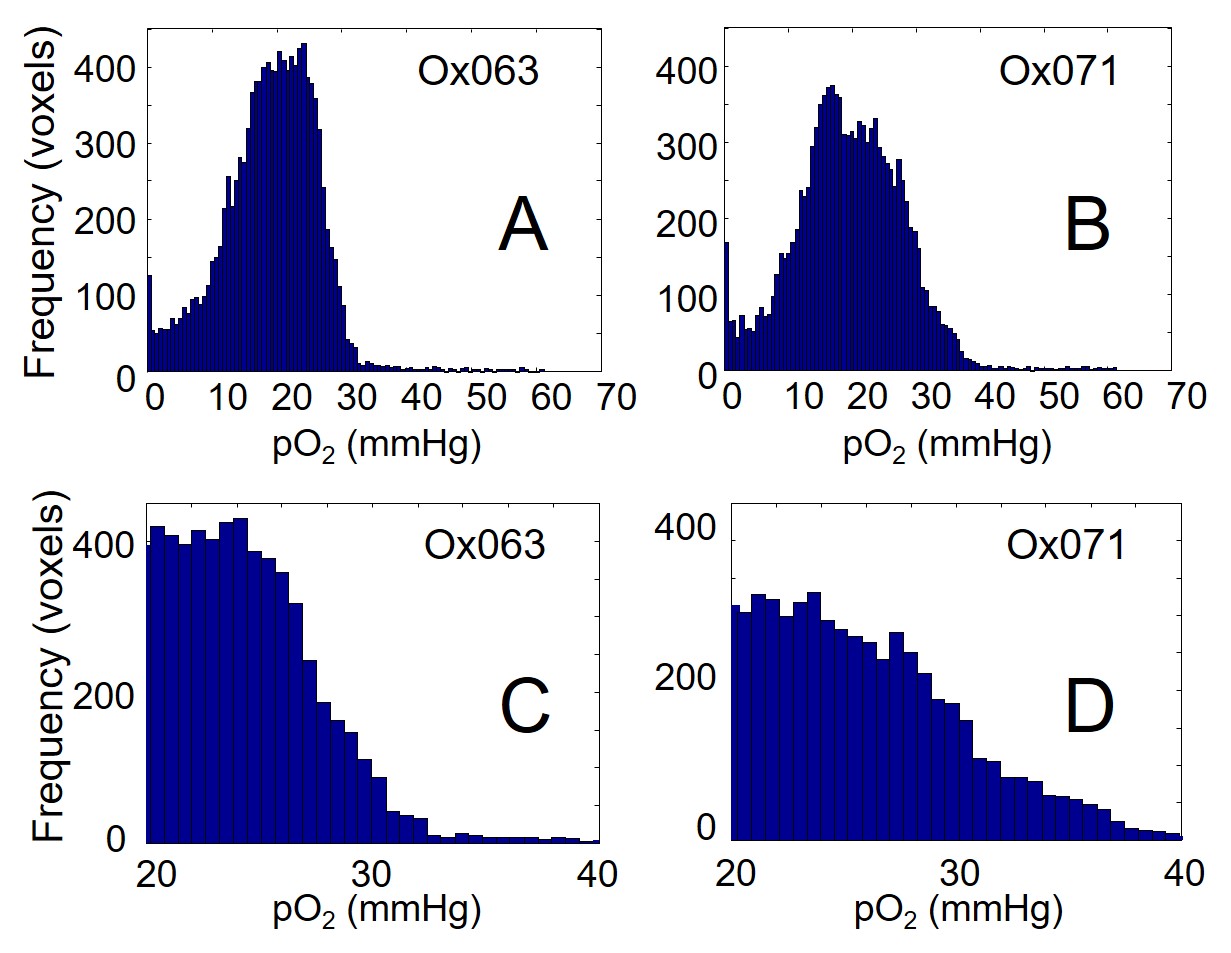
The imaging of tumor in mouse leg was performed using Ox071 spin probe on the first day, and delayed until next day for clearance of Ox071 from its body before the other imaging study using Ox063. The zero gradient signal intensities from both imaging data are compared in Figure 2. The signal level from Ox071 appears to be about twice stronger and lasts almost twice longer compared to Ox063. To estimate pO2 values, R2* map was calculated from 12 delay time (tp) points starting from 0.7 μs (marked by the vertical dashed line in Figure 2) and separated at 30 ns intervals. The spin density was estimated from the signal at tp= 0 (S0), and pO2 map was determined from R2* values at each voxel. A smoother intensity map was obtained by mean pixel intensities of the 12 images though it was different from S0 and used to calculate the background mask and to display 3D isosurface of probe distribution. In Figure 3, the isosurfaces of Ox063 and Ox071 displayed the overall shape of tumor leg including regions without probe distribution due to multiple tumor lumps. The cross sections of spin density (S0) and pO2 maps of the tumor at a selected slice (61) through the bulk indicated similarities between Ox071 and Ox063. The spin density maps indicated uneven distribution of the probe due to multiple cysts. The tumor anatomy was determined by MRI at matrix size of 128 x 128 x 14. Figure 4 shows a slice containing large tumor region and pO2 values in the region of interest determined by Ox063 and Ox071 probes. The histograms of entire tumor regions indicated that pO2 values assessed by Ox071 are more widely distributed compared to those by Ox063. The longer relaxation time of Ox071 allowed determination of pO2 at the higher ranges (> 30 mmHg) reliably.
Conclusion
In this work, in vivo 3D oximetry was performed using Ox071 and compared with Ox063. Higher signal level and longer relaxation times of Ox071 provide an edge over Ox063 to obtain accurate pO2 estimates over a broader range and eventually to decrease the dosage of the spin probe required for clinical applications.Acknowledgements
No acknowledgement found.References
1. Matsumoto K, Subramanian S, Devasahayam N, et al. Electron paramagnetic resonance imaging of tumor hypoxia: enhanced spatial and temporal resolution for in vivo pO2 determination. Magn Reson Med. 2006; 55(5): 1157-63.
2. Matsumoto KI, Kishimoto S, Devasahayam N, et al. EPR-based oximetric imaging: a combination of single point-based spatial encoding and T1 weighting. Magn Reson Med. 2018; 80(5): 2275-2287.
3. Ardenkjaer-Larsen JH, Laursen I, Leunbach I, et al. EPR and DNP properties of certain novel single electron contrast agents intended for oximetric imaging. J Magn Reson. 1998; 133(1): 1-12.
Figures