1178
Ventilation Defect Synthesis in Hyperpolarized 129Xe Ventilation MRI to Accelerate Training of Segmentation Models1Biomedical Engineering, Duke University, Durham, NC, United States, 2Medical Physics, Duke University, Durham, NC, United States, 3Mathematics, Duke University, Durham, NC, United States, 4Radiology, Duke University, Durham, NC, United States, 5Bioengineering, McGill University, Montréal, QC, Canada, 6Mechanical Engineering and Materials Science, Duke University, Durham, NC, United States
Synopsis
Quantification of 129Xe MRI relies on accurate segmentation of the thoracic cavity. This segmentation could potentially be performed directly on the 129Xe ventilation image using an automated convolutional neural network, but this task is challenging, especially in cases where peripheral ventilation defects obscure the lung boundary. Currently, overcoming this obstacle requires large, diverse training datasets created by time-consuming manual segmentation. Here, we demonstrate the use of a generative Pix2Pix model to synthesize both 129Xe images with defects, and corresponding segmentation masks. We then test the effects of this additional training data on the performance of an existing U-net segmentation algorithm.
Introduction
Quantification of hyperpolarized 129Xe MRI requires accurate delineation of the subject’s thoracic cavity. This typically involves time-consuming and labor-intensive segmentation of a breath-hold 1H MR image, which is then registered to the functional scan for quantitative analysis1. Alternatively, it is also possible to train a convolutional neural network (CNN) to directly segment the 129Xe ventilation scan. We have previously demonstrated that this approach can yield relatively high Dice scores2. However, careful inspection of such segmentation reveals poor performance around peripheral ventilation defects. Overcoming this problem requires training the CNN with much larger datasets with well-registered masks and 129Xe scans containing a wide range of patterns of ventilation heterogeneity from minimal to extensive. Unfortunately, these datasets are not only costly to acquire but also require extensive and precise manual segmentation. Here, we propose using the Pix2Pix generative adversarial network3 to synthesize 129Xe images that can be tuned to a desired ventilation defect percentage (VDP) range and texture/histogram input, together with corresponding aligned thoracic cavity masks. We then use this synthetic data to augment the training data for a standard (U-net)4 segmentation model. We compare segmentation performance when the model is trained with hand-segmented data alone, synthetic data alone, and both datasets combined.Methods
Dataset selection and processing:Our study employed 73 acquired imaging datasets consisting of 14-slice 2D GRE coronal 129Xe ventilation and registered SSFSE 1H thoracic cavity scans. These were registered and segmented by expert readers to delineate the thoracic cavity, enabling generation of histogram-based defect maps5. The 73 datasets were split 5-fold and then split into individual slices for cross validation to train both the Pix2Pix data synthesis model and the U-net segmentation model. To expand the range of histograms on which Pix2Pix trained, each 129Xe image was augmented in 5 different ways using gamma correction with [0.2,0.6,1.4,1.6] values and adaptive histogram equalization. Both the manually generated defect maps and their original and augmented histograms were used to train the Pix2Pix model.
Training:
The Pix2Pix model was trained for 100 epochs with batch size of 1, with other hyperparameters as outlined in the original work3. The Pix2Pix input is a concatenation of a histogram tiled to all spatial locations of image's size and the defect map. The U-net segmentation model was trained over 3000 epochs with batch size of 16 using binary cross entropy. For each training session, the segmentation model with the highest validation Dice score was retained.
Synthetic image generation:
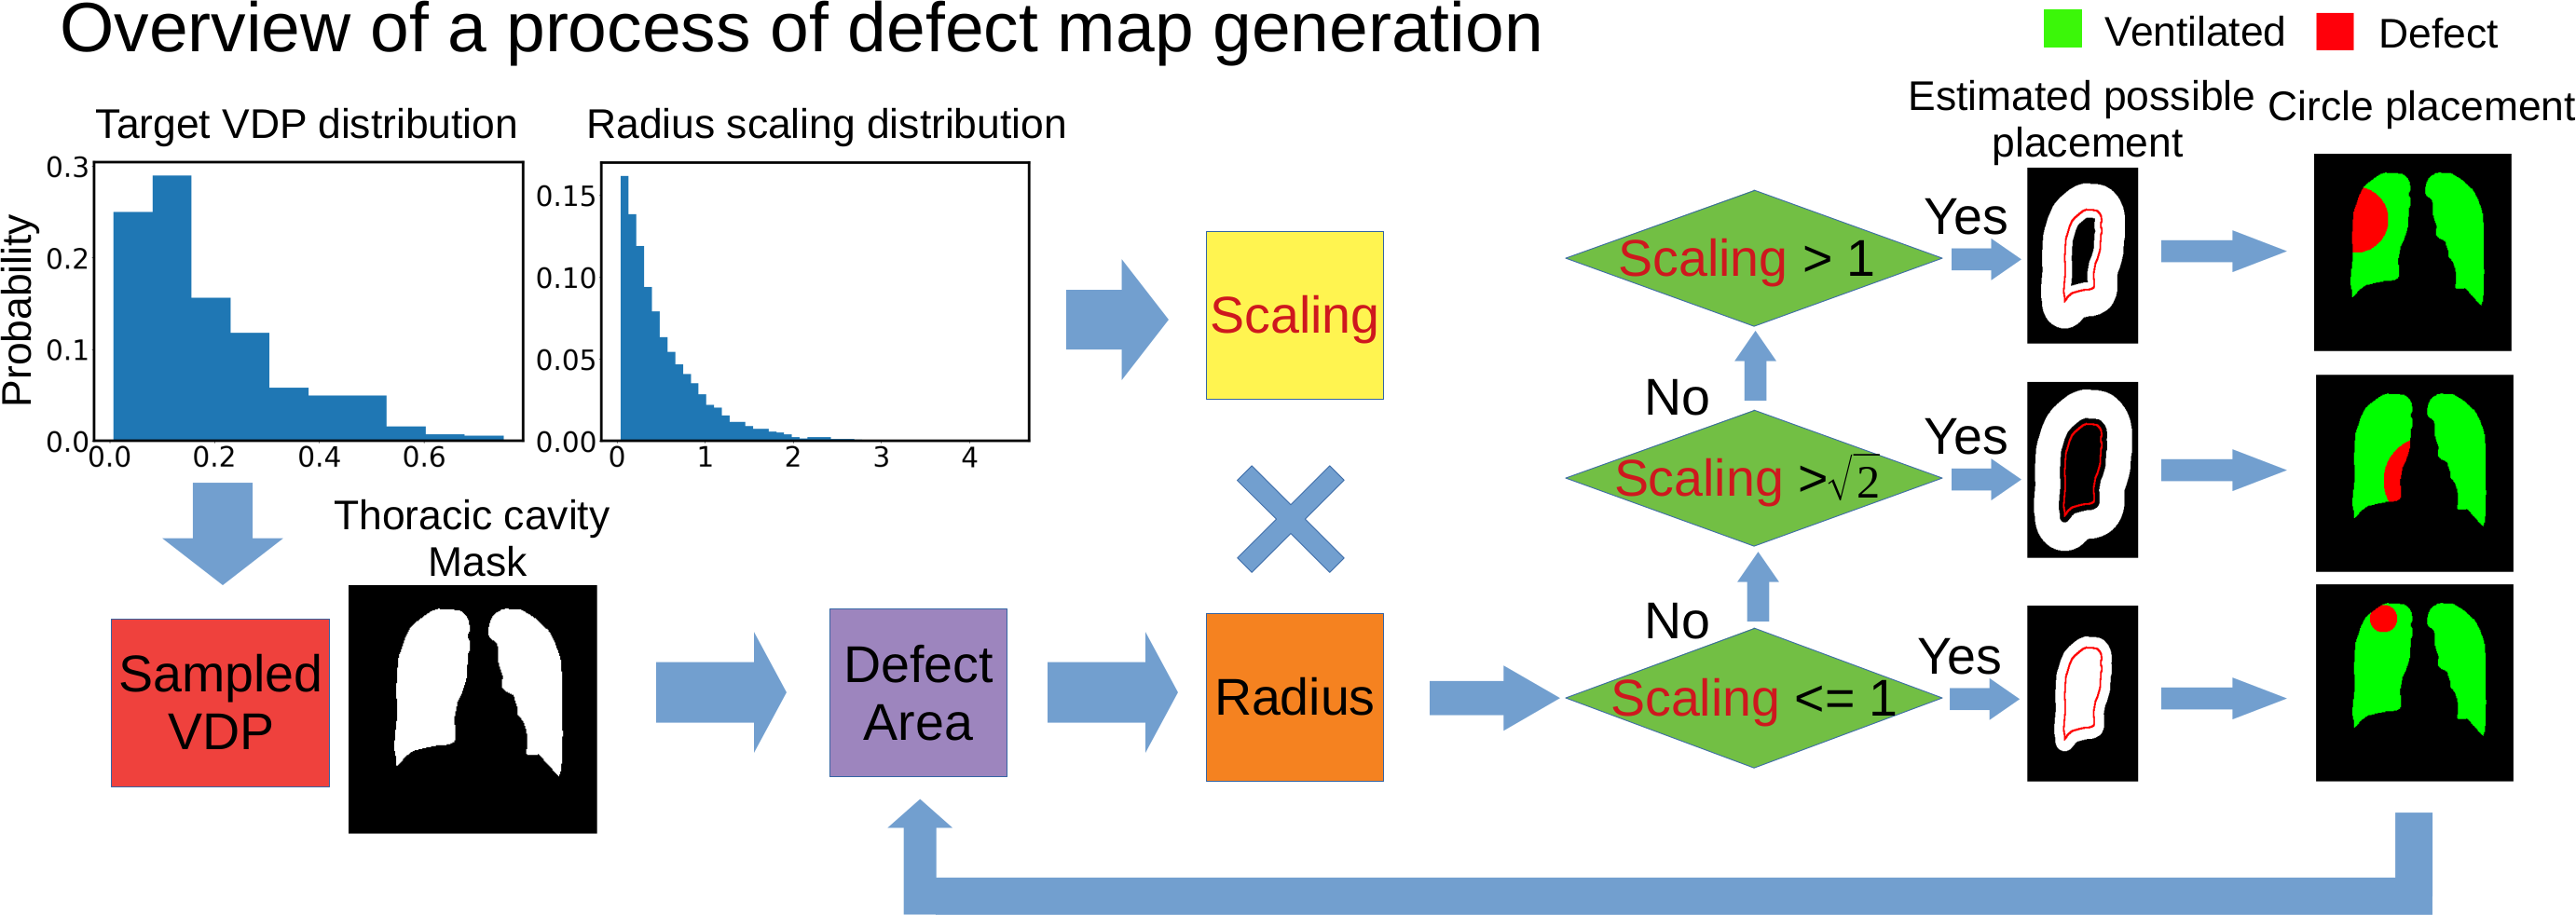
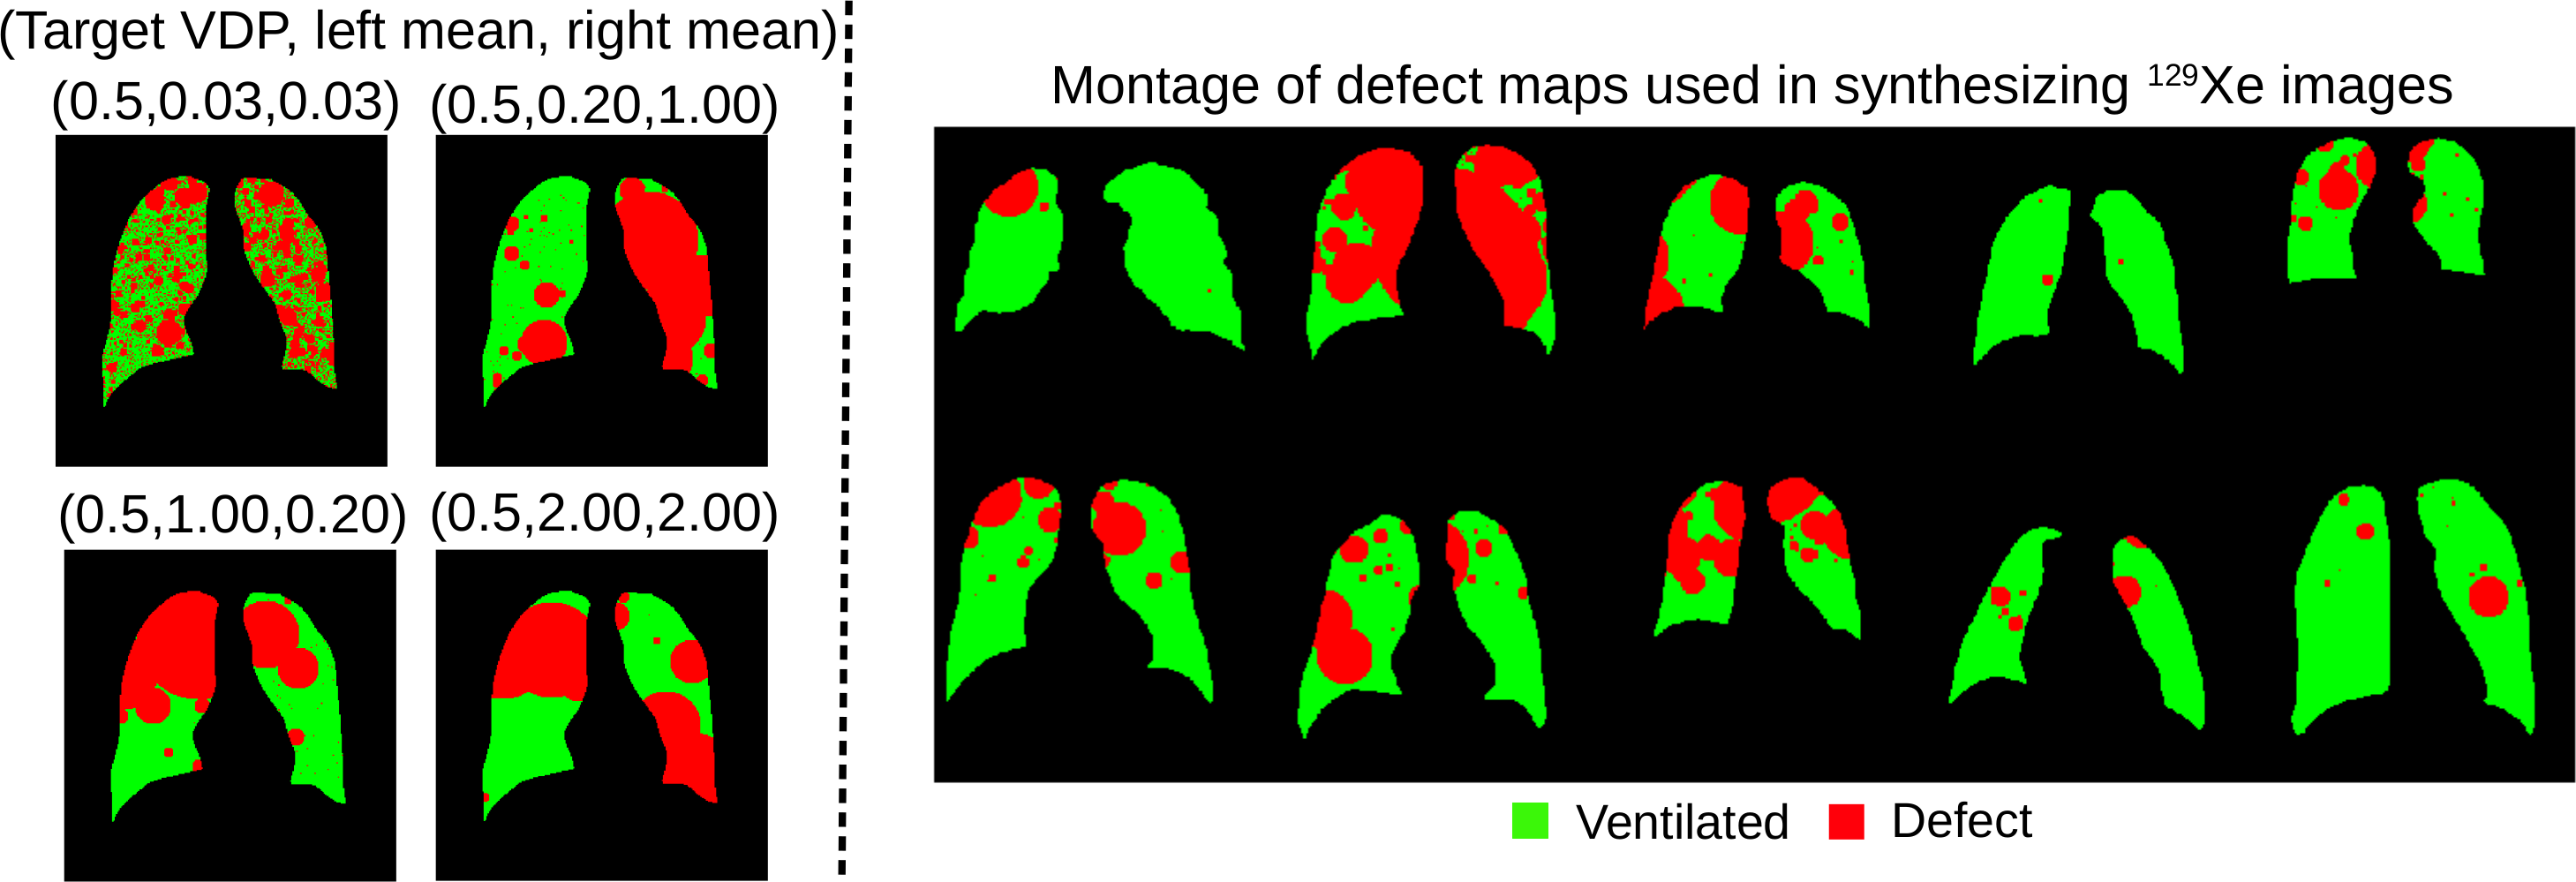
Synthetic 129Xe images were generated using 704 thoracic cavity masks publicly available from 2D X-ray scans associated with Kaggle challenge6. Each mask was used to create a separate defect map with a target level of defect percentage based on the distribution of VDP values in the set of 73 2D GRE images. This process, as outlined in Figure 1, begins by randomly placing circle-shaped “defects” within the mask. This included 1) randomly choosing left or right lung 2) calculating the radius of a circle that satisfies the area of the VDP target, 3) multiplying this by a random scaling value drawn from an exponential distribution with mean = 0.5, 4) randomly placing the circle 5) calculating the remaining area and 6) repeating these steps in the opposite lung. The effect of the exponential distribution on ventilation defect pattern are shown in Figure 2 along with a montage of resultant ventilation defect maps. These, along with the 704 randomly picked histograms from the original training dataset are then fed into Pix2Pix to synthesize 129Xe ventilation images.
Results
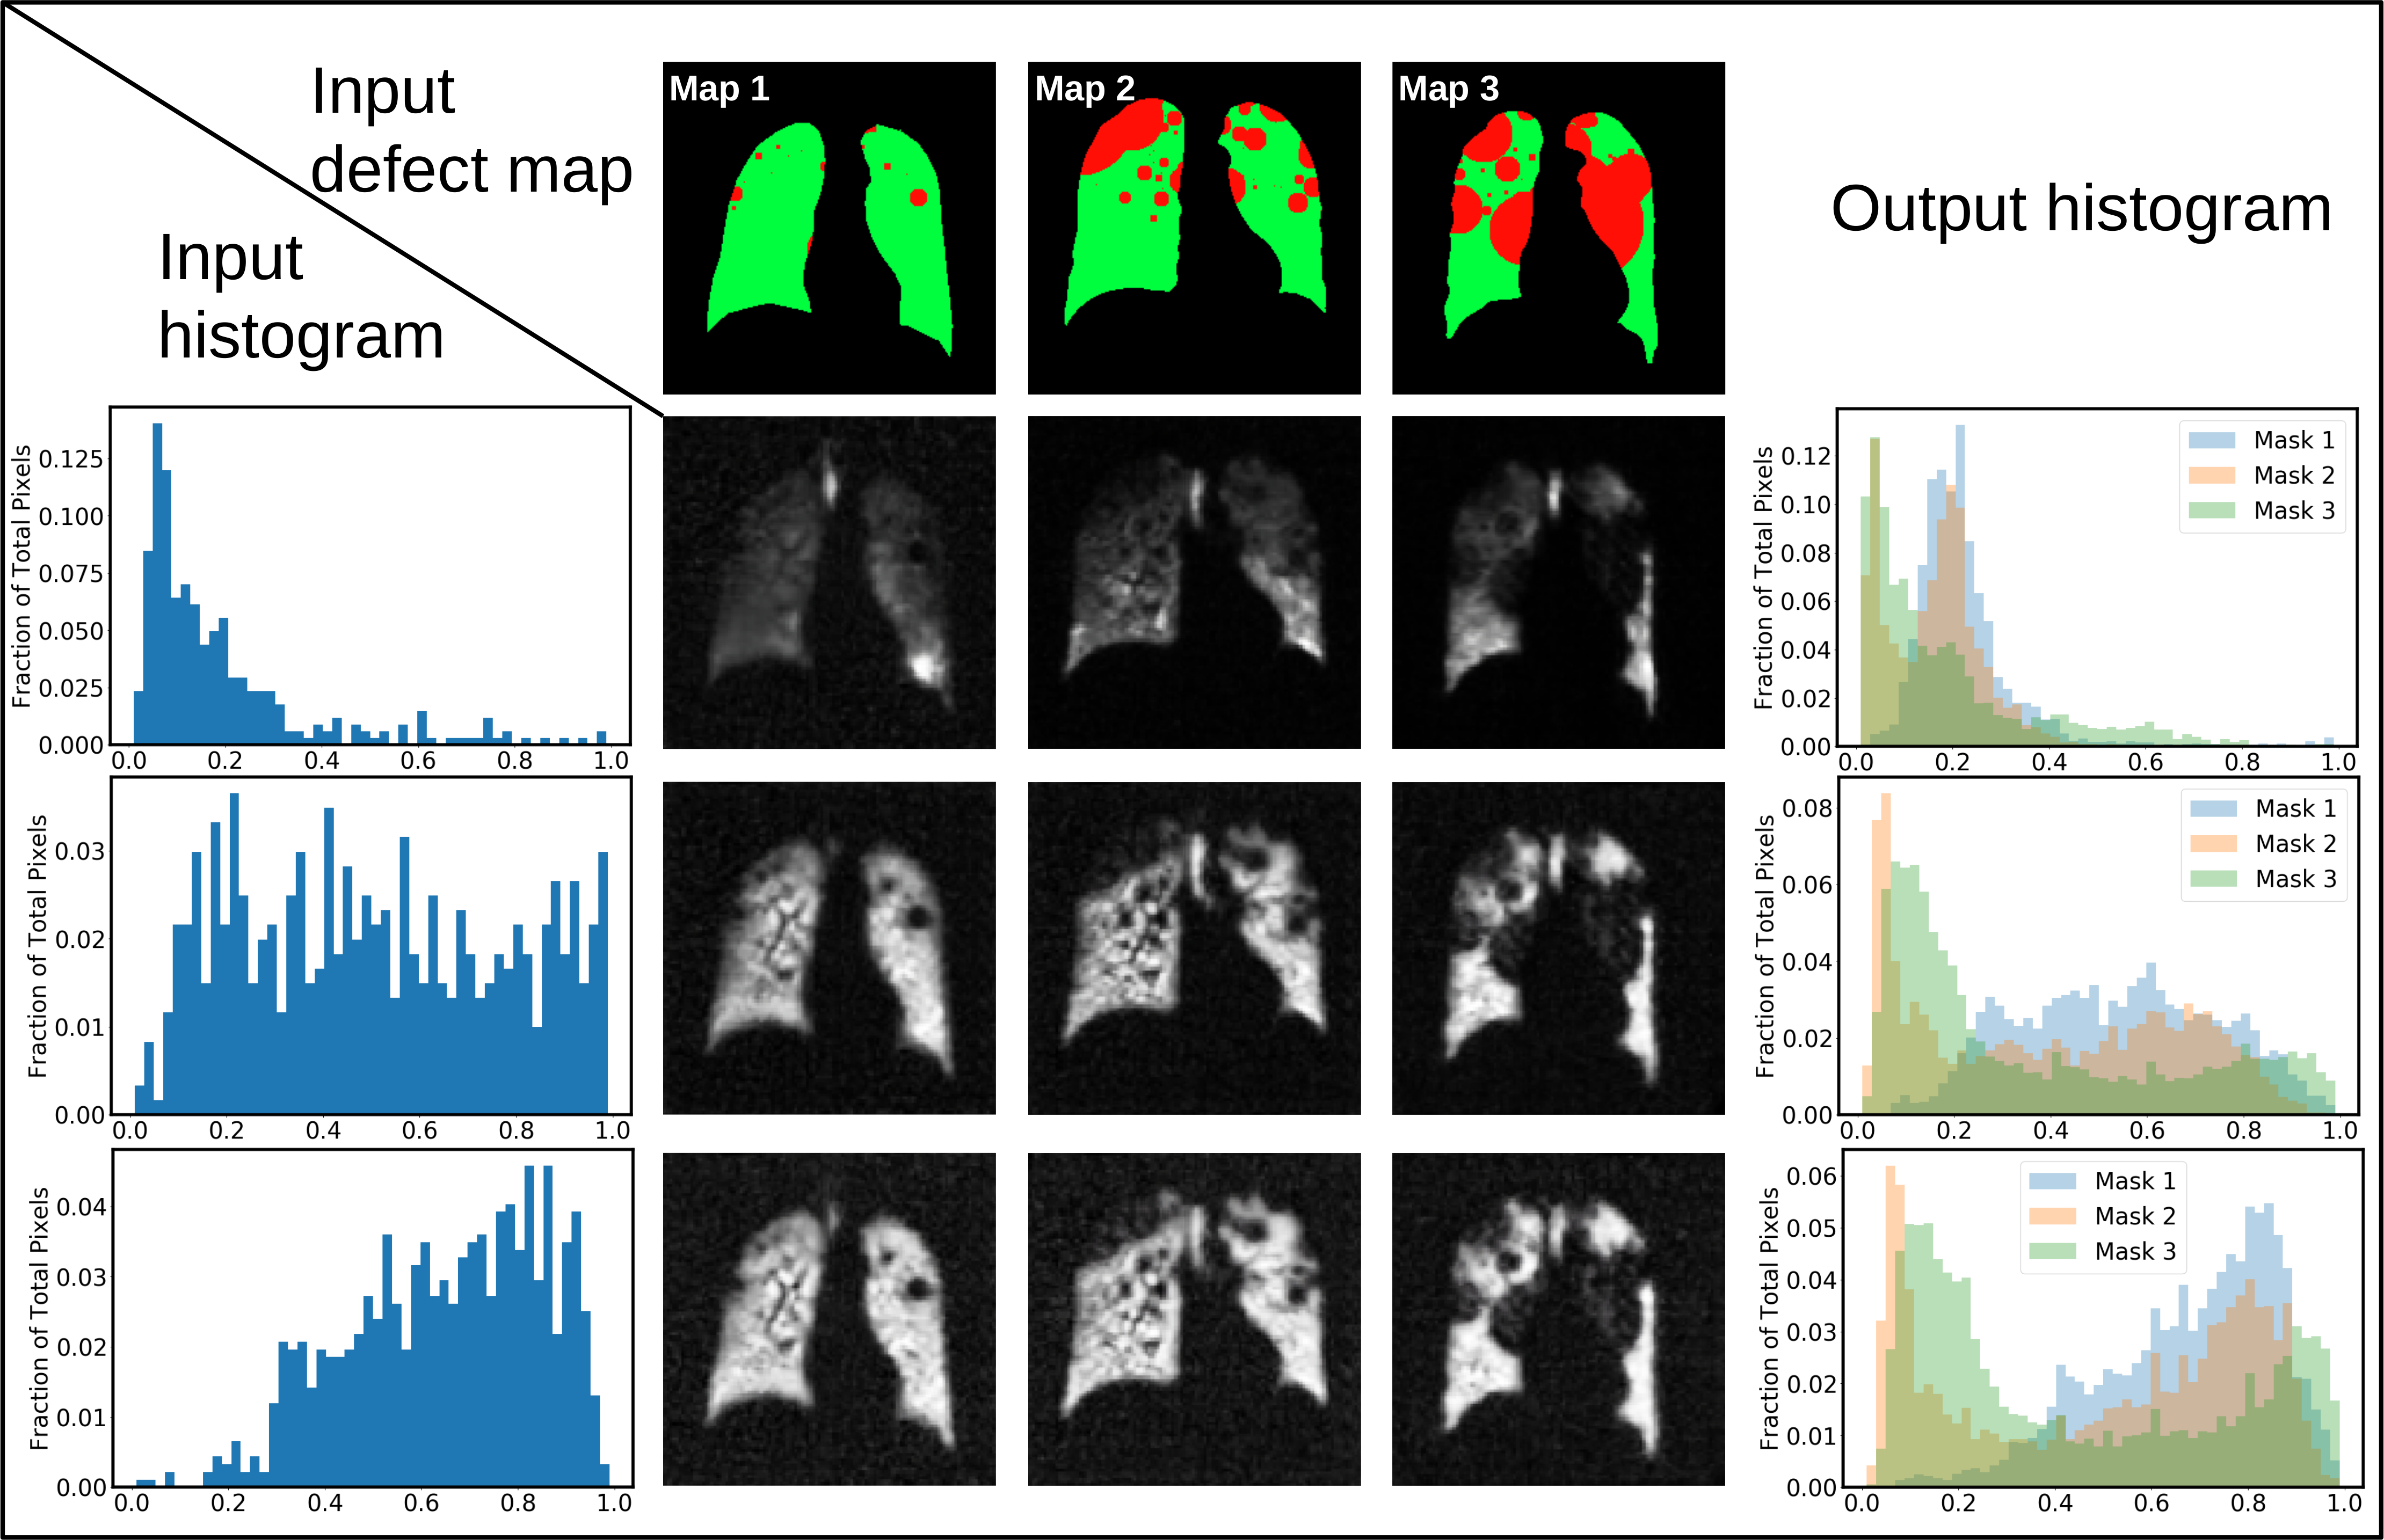
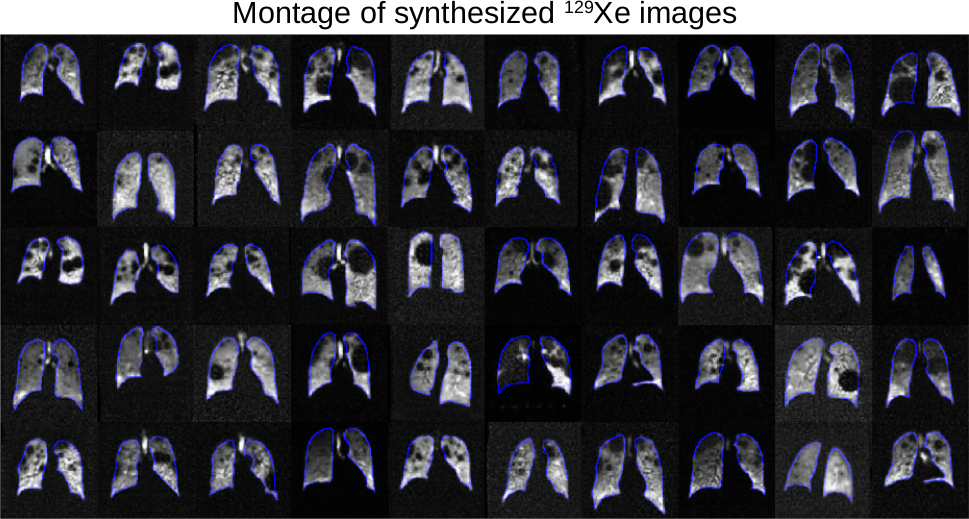
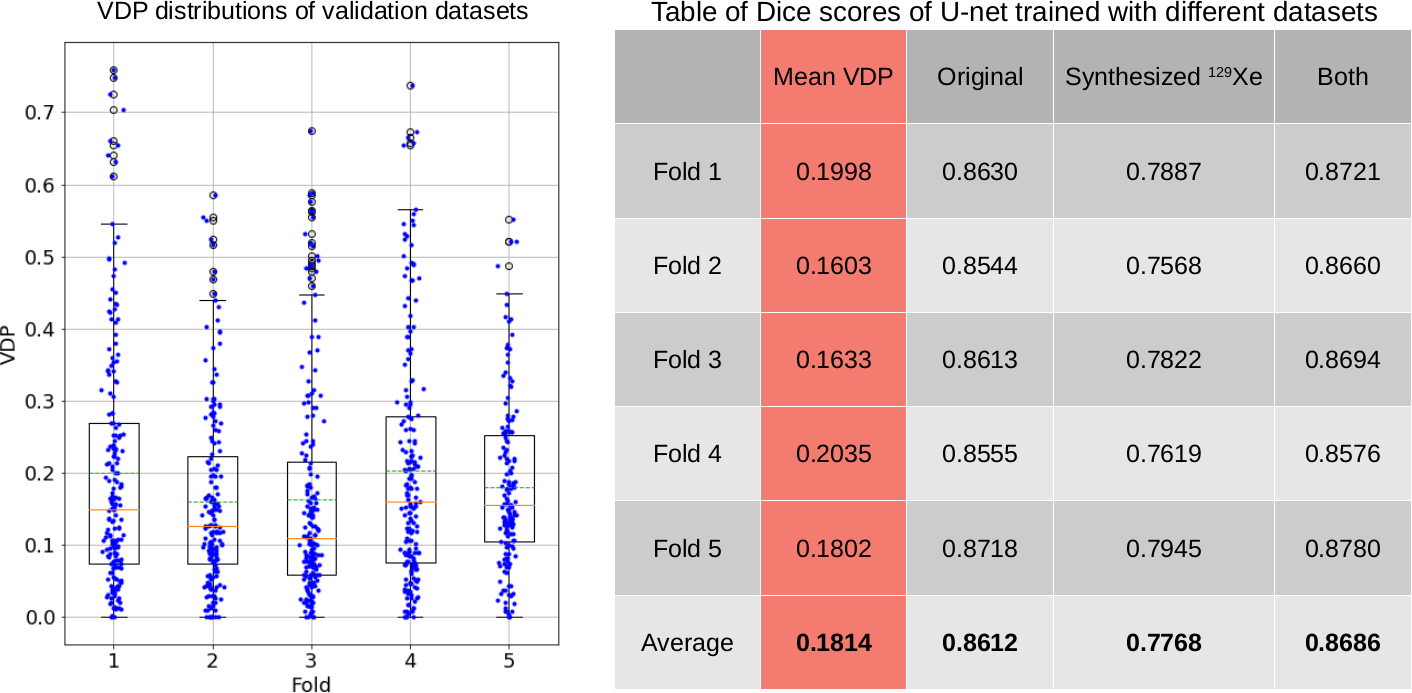
Figure 3 illustrates representative synthetic 129Xe images generated by Pix2Pix for the given input histograms and defect maps. Figure 4 shows a montage of synthetic 129Xe ventilation images and their perfectly aligned masks. A total of 704 generated 2D slices were used in training the U-net segmentation model. Figure 5 shows the Dice scores achieved when training the U-net segmentation model with the original data, synthetic data, and the combination of both. The model trained with only synthesized data exhibited the lowest Dice score (0.777). The one trained only with original data was somewhat better (0.861) and the one trained with all the data performed best (0.869).Discussion
We have demonstrated a method to rapidly generate synthetic 129Xe ventilation images containing arbitrary defects and perfectly aligned with corresponding thoracic cavity masks. Although the addition of this data resulted in only marginal improvement in the performance of the U-net segmentation model, there are several opportunities for improvement. First, the masks used to synthesize the data were derived from X-ray projections and most closely reflect only the middle slice of the thoracic cavity. Thus, data synthesis can be improved by using masks from a truly 3D dataset. Second, we limited the number of synthesized data to 704 for the purpose of comparison. The performance may be improved as we generate more training data since there is no limit to how many we choose to synthesize. Third, the relative sizes and numbers of defects (generated here based on an exponential distribution) may not reflect those of the real ventilation defects and need to be further optimized.Acknowledgements
R01HL105643, R01HL12677, NSF GRFP DGE-1644868References
1. He, M., Driehuys, B., Que, L. G., & Huang, Y. C. T. (2016). Using Hyperpolarized 129Xe MRI to Quantify the Pulmonary Ventilation Distribution. Academic Radiology. https://doi.org/10.1016/j.acra.2016.07.014
2. Leewiwatwong, S., Lu, J., Mummy, D., Dummer, I., Yarnall, K., Wang, Z. and Driehuys, B. (2021). Deep learning-based thoracic cavity segmentation for hyperpolarized 129Xe MRI. The International Society for Magnetic Resonance in Medicine (ISMRM) Annual Meeting 2021.
3. Isola, P., Zhu, J., Zhou, T., & Efros, A. A. (2017). Image-to-Image Translation with Conditional Adversarial Networks. 2017 IEEE Conference on Computer Vision and Pattern Recognition (CVPR).
4. Ronneberger, O., Fischer, P., & Brox, T. (2015). U-Net: Convolutional Networks for Biomedical Image Segmentation. In N. Navab, J. Hornegger, W. M. Wells, & A. F. Frangi, Medical Image Computing and Computer-Assisted Intervention – MICCAI 2015 Cham.
5. He, M., Kaushik, S. S., Robertson, S. H., Freeman, M. S., Virgincar, R. S., McAdams, H. P., & Driehuys, B. (2014). Extending semiautomatic ventilation defect analysis for hyperpolarized 129Xe ventilation MRI. Academic radiology, 21(12), 1530–1541. https://doi.org/10.1016/j.acra.2014.07.017
6. https://www.kaggle.com/nikhilpandey360/lung-segmentation-from-chest-x-ray-dataset
Figures