1176
Hyperpolarized 129Xe Diffusion MRI and Diffusion Morphometry in Mice using 2D Spiral1Center for Pulmonary Imaging Research, Cincinnati Children's Hospital Medical Center, Cincinnati, OH, United States, 2Biomedical Engineering, University of Cincinnati, Cincinnati, OH, United States, 3Pulmonary Medicine, Cincinnati Children's Hospital Medical Center, Cincinnati, OH, United States, 4Biochemistry, National Institute of Nutrition, Telangana, India, 5Pediatrics, University of Cincinnati, Cincinnati, OH, United States, 6Pulmonary and Critical Care, University of Kansas Medical Center, Kansas City, KS, United States, 7Imaging Research Center, Cincinnati Children's Hospital Medical Center, Cincinnati, OH, United States
Synopsis
Hyperpolarized (HP) 129Xe diffusion imaging, including the apparent diffusion coefficient (ADC) and more sophisticated diffusion morphometry, can assess microstructural dimensions of the acinar airspace. In diseases characterized by alveolar destruction (eg, emphysema), these parameters strongly indicate disease severity. Here, a time-efficient, 2D-spiral diffusion sequence was developed and compared to a conventional GRE-based sequence in a free-diffusion phantom, wild-type mice, a and a transgenic mouse model of lung fibrosis that develops emphysema as a comorbidity. Both sequences provided comparable SNR, ADC values, and morphometry metrics, indicating spiral sequences can assess airspace size in mice, while making efficient use of HP magnetization.
Introduction
Hyperpolarized (HP) 129Xe diffusion morphometry is a technique to assess the microstructural dimensions of the acinar airspace noninvasively. This technique uses bipolar diffusion-weighted gradients to measure the apparent diffusion coefficient (ADC) of HP 129Xe and extract physiological parameters—(e.g., surface-to-volume ratio (SV), alveolar number density (Na), and mean linear intercept (Lm))—within the acinar airspace1,2. In diseases characterized by alveolar destruction (e.g., emphysema), these parameters shift as xenon diffusivity approaches the free-diffusion limit, providing evidence of early disease and allowing disease severity to be quantified3-7.While 129Xe diffusion data have been obtained in mouse lungs using gradient recalled echo sequences (GRE), spiral sequences have the potential to provide more rapid acquisition and superior signal-to-noise-ratio (SNR)8,9. In this work, a 2D Archimedean spiral diffusion sequence was developed and compared to a GRE-based sequence in a free-diffusion phantom, wild-type mice, a control transgenic mouse, and a transgenic mouse model of fibrosis that develops pronounced emphysema as a comorbidity.
Methods
Imaging: GRE and spiral sequences (Fig. 1) were implemented with a 7T Bruker BioSpin scanner (ParaVision 6.0.1). Xenon was hyperpolarized to >30% (Model 9820, Polarean Inc., Durham, NC). MRI parameters included: axial orientation, in-plane resolution=0.5mm, slice thickness=1.5mm, δ=2.575ms, Δ=2.585ms, b=[0, 6.25, 12.5, 18.75, 25, 31.25, 37.5] s/cm2.Phantom images were acquired from 30mL of HP 129Xe within a syringe (length: 5.4cm, ID: 26mm). GRE acquisition parameters included: matrix=642, FOV=32×32mm2, slices=11, α=4°, TE=8.1ms, TR=12.2ms. Spiral acquisition parameters included: matrix=1282, FOV=64×64mm2, slices=3, α=7.6°, TE=6.4ms, TR=14.0ms, Nspirals=26, points per spiral=513. In vivo acquisition parameters included: matrix=522, FOV=26×26mm2, slices=11, α=45°, averages=1, repetitions=4. In vivo GRE parameters also included: TE=7.9ms, and TR=11.8ms. In vivo spiral parameters included: TE=6.5ms and TR=14.5ms; transgenic mice: Nspirals=10, points per spiral=214; wild-type mice: Nspirals=13, points per spiral=169.
Image analysis and ADC maps were performed in MATLAB (MathWorks, Inc., Natick, MA) using nonlinear least-squares fitting. Lung parenchyma was manually segmented to exclude large airways. Diffusion morphometry metrics were calculated using Bayesian probability theory10-12.
Animal Handling: Mice were housed under pathogen-free conditions and handled according to protocols approved by the Institutional Animal Care and Use Committee of the Cincinnati Children’s Hospital Research Foundation. Transgenic mice were derived from the FVB/JL inbred strain. Single transgenic (control) and bitransgenic (TGF-α) mice were produced within the same litter by mating homozygous CCSP-rtTA+/+ mice to hemizygous (TetO)7-cmv TGFa+/- mice13,14. Doxycycline was administered to transgenic mice (62.5mg/kg) for 8 weeks to induce fibrotic and emphysematous remodeling. Images were acquired 4 weeks after the cessation of doxycycline.
Eight male C57BL/6J (wild-type) mice and two female transgenic mice (one control, one TGF-α) were imaged using both sequences. Mice were ventilated at an inspiratory pressure of 10±1cmH2O using a homebuilt, HP gas compatible, small animal ventilator. Data were acquired at breath-hold using 70% HP 129Xe and 30% O215,16 (Fig 1.)
Histology: Following imaging, transgenic mice were euthanized and lungs were inflation-fixed in situ with 4% paraformaldehyde in phosphate-buffered saline at a pressure of 10cmH2O to match in vivo conditions. Lungs were paraffin-embedded and stained with hematoxylin and eosin to examine lung tissue. Representative images of the lung tissue were captured at 10X magnification by Nikon Ti2 inverted SpectraX with scale bars of 100µm.
Results
For the HP 129Xe gas phantom, the spiral sequence produced higher SNR and lower ADC measurements (SNR=34.0, ADC=0.057±0.006cm2/s) compared to the GRE sequence (SNR=20.4, ADC=0.062±0.01 cm2/s) (Fig. 2).For the wild-type mice, two out of eight mice had images with SNR<10 and were excluded from the analysis. Wilcoxon signed-rank tests demonstrated no significant difference (p<.05) in SNR (GRE 20.6±5.6, spiral 23.5±6.5), ADC (GRE 0.011±0.005cm2/s, spiral 0.012±0.006cm2/s, Lm (GRE 55±2.1µm, spiral 57.3±1.2µm), SV (GRE 793.5±36cm-1, spiral 768.2±18cm-1) or Na (GRE 6363±399mm-3, spiral 6072±226mm-3) between sequences (Fig. 3).
Representative samples of the lung tissue displayed alveolar destruction and increased airspace size in the TGF-α mouse. For both transgenic mice, the sequences had similar SNR (TGF-α: GRE 22.6, spiral 17.3; Control: GRE 18.4, spiral 15.0), ADC, Lm, SV and Na values (Figs. 4 & 5). Lm is highest in the TGF-α mouse, slightly decreased in the control mouse, and lowest in wild-type mice. Inversely, SV and Na are lowest in the TGF-α mouse, slightly increased in the control mouse, and highest in wild-type mice.
Discussion & Conclusions
Phantom ADC measurements agreed well with the established free diffusion coefficient of xenon at room temperature, 0.06cm2/s17. Notably, the bore of the magnet had a temperature <20°C. Therefore, the decreased spiral ADC and narrower ADC distribution suggests the higher SNR provided by the sequence yields superior accuracy and precision18,19.The wild-type mice demonstrated that there is no significant difference in ADC or morphometric parameters between sequences despite a range of SNR values (12.2 – 29.4). The TGF-α mouse metrics are consistent with increased airspace size, including an increased ADC and Lm and a decreased SV and Na compared to the wild-type and control mice.
The phantom, wild-type, and transgenic mouse studies showed that the spiral sequence had higher accuracy and precision in ADC and diffusion morphometry metrics than the GRE sequence. These results indicate that spiral diffusion morphometry can sensitively and efficiently quantify changes in alveolar airspace size in mouse models of human lung disease.
Acknowledgements
The authors thank the following source for research funding and support: NIH R01 HL143011References
1. Sukstanskii AL, Yablonskiy DA: Lung morphometry with hyperpolarized 129Xe: Theoretical background. Magnetic Resonance in Medicine 2012, 67:856-66.
2. Niedbalski PJ, Cochran AS, Freeman MS, Guo J, Fugate EM, Davis CB, Dahlke J, Quirk JD, Varisco BM, Woods JC, Cleveland ZI. Validating in vivo hyperpolarized 129Xe diffusion MRI and diffusion morphometry in the mouse lung. Magn. Reson. Med. 2020.
3. Chan HF, Stewart NJ, Norquay G, Collier GJ, Wild JM. 3D diffusion‐weighted 129Xe MRI for whole lung morphometry. Magn Reson Med 2018;79(6):2986-2995.
4. Ouriadov A, Fox M, Hegarty E, Parraga G, Wong E, Santyr GE: Early Stage Radiation-Induced Lung Injury Detected Using Hyperpolarized Xe-129 Morphometry: Proof-of-Concept Demonstration in a Rat Model. Magnetic Resonance in Medicine 2016, 75:2421-31.
5. Zhang H, Xie J, Xiao S, Zhao X, Zhang M, Shi L, Wang K, Wu G, Sun X, Ye C. Lung morphometry using hyperpolarized 129Xe multi‐b diffusion MRI with compressed sensing in healthy subjects and patients with COPD. Medical physics 2018;45(7):3097-3108.
6. Quirk JD, Lutey BA, Gierada DS, Woods JC, Senior RM, Lefrak SS, Sukstanskii AL, Conradi MS, Yablonskiy DA: In Vivo Detection of Acinar Microstructural Changes in Early Emphysema with He-3 Lung Morphometry. Radiology 2011, 260:866-74.
7. Wang W, Nguyen NM, Yablonskiy DA, Sukstanskii AL, Osmanagic E, Atkinson JJ, Conradi MS, Woods JC: Imaging Lung Microstructure in Mice With Hyperpolarized He-3 Diffusion MRI. Magnetic Resonance in Medicine 2011, 65:620-6.
8. Salerno M, Altes TA, Brookeman JR, De Lange EE, Mugler III JP. Rapid hyperpolarized 3He diffusion MRI of healthy and emphysematous human lungs using an optimized interleaved‐spiral pulse sequence. Journal of Magnetic Resonance Imaging: An Official Journal of the International Society for Magnetic Resonance in Medicine 2003;17(5):581-588.
9. Willmering M.M., Niedbalski P.J., Wang H., Walkup L.L., Robison R.K., Pipe J.G., Cleveland Z.I., Woods J.C. Improved pulmonary 129Xe ventilation imaging via 3D-spiral UTE MRI. Magn. Reson. Med. 2020;84:312–320.
10. Bretthorst GL: An introduction to parameter estimation using Bayesian probability theory. Dartmouth: Dartmouth, NH: Kluwer Academic Publishers, 1989.
11. Quirk JD, Sukstanskii AL, Bretthorst GL, Yablonskiy DA: Optimal decay rate constant estimates from phased array data utilizing joint Bayesian analysis. Journal of Magnetic Resonance 2009, 198:49-56.
12. Bdaiwi AS, Willmering MM, Wang H, Cleveland ZI. 2D and 3D Spiral for Diffusion Weighted MRI with Hyperpolarized 129Xe. ISMRM 2021.
13. Hardie WD, Le Cras TD, Jiang K, Tichelaar JW, Azhar M, Korfhagen TR, Conditional expression of transforming growth factor-α in adult mouse lung causes pulmonary fibrosis, Am. J. Physiol. - Lung Cell. Mol. Physiol286 (2004) L741–L749.
14. Hardie WD, Korfhagen TR, Sartor MA, et al., Genomic profile of matrix and vasculature remodeling in TGF-alpha-Induced pulmonary fibrosis, Am. J. Respir. Cell Mol. Biol37 (2007) 309–321.
15. Akinyi TG. An Affordable Open-Source Small Animal MR and Hyperpolarized Gas Compatible Ventilator: Feasibility in pre-clinical imaging. [Master's Thesis]. Cincinnati, OH: University of Cincinnati; 2017.
16. Nouls J, Fanarjian M, Hedlund L, Driehuys B: A Constant-Volume Ventilator and Gas Recapture System for Hyperpolarized Gas MRI of Mouse and Rat Lungs. Concepts in Magnetic Resonance Part B-Magnetic Resonance Engineering 2011, 39B:78-88.
17. Acosta RH, Agulles-Pedros L, Komin S, Sebastiani D, Spiess HW, Blumler P. Diffusion in binary gas mixtures studied by NMR of hyperpolarized gases and molecular dynamics simulations. PhysChem ChemPhys 2006;8:4182–4188.
18. O’Halloran RL, Holmes JH, Altes TA, Salerno M, Fain SB. The effects of SNR on ADC measurements in diffusion-weighted hyperpolarized He-3 MRI. Journal of Magnetic Resonance 2007;185(1):42-49.
19. Bdaiwi AS, Niedbalski PJ, Hossain MM, Willmering MM, Walkup LL, Wang H, Thomen RP, Ruppert K, Woods JC, Cleveland ZI. Improving hyperpolarized 129Xe ADC mapping in pediatric and adult lungs with uncertainty propagation. NMR Biomed. 2021 Nov 2:e4639.
Figures
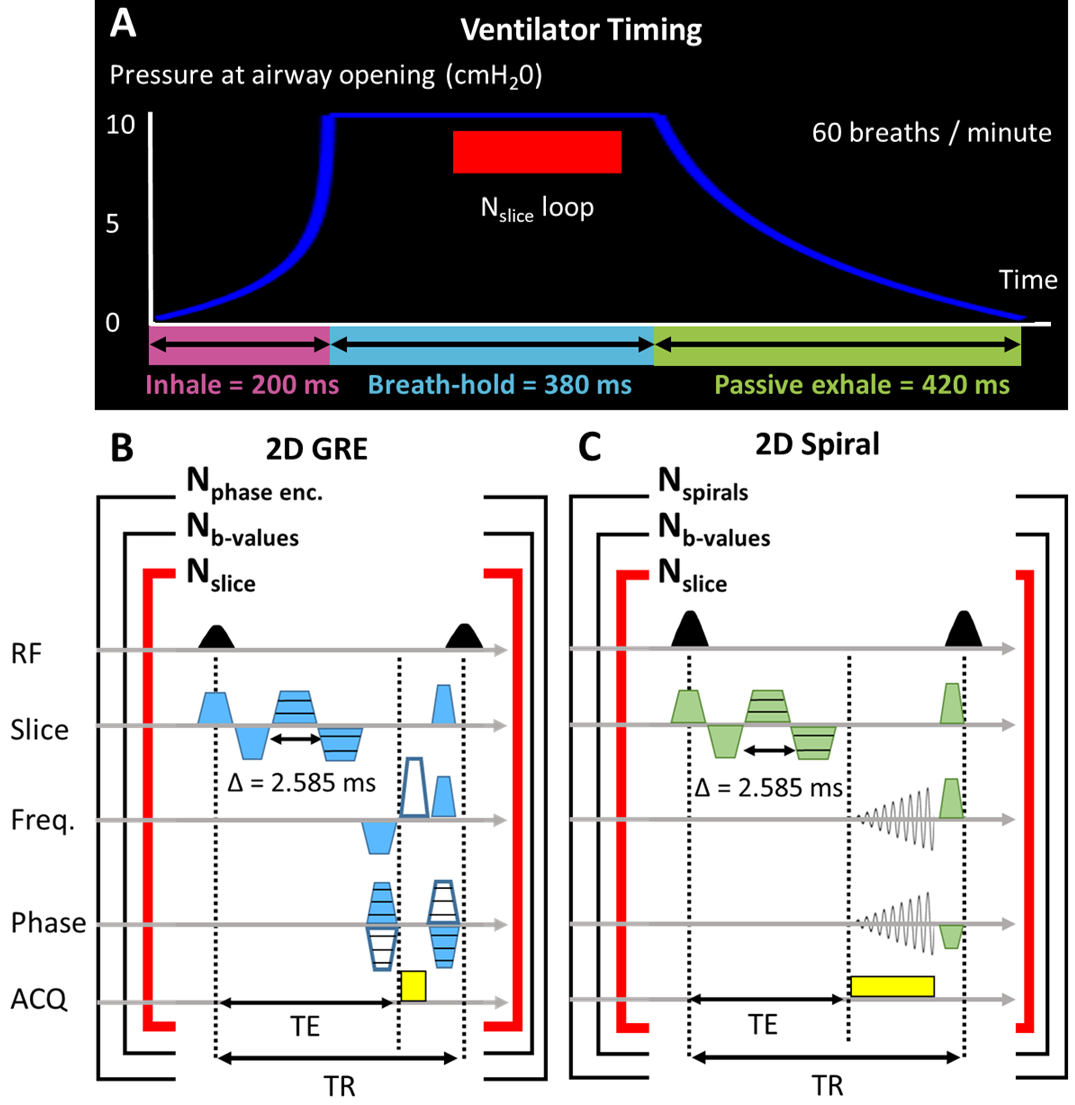
Fig. 1. A) Schematic depicting the pressure waveform from mechanical ventilation and acquisition timing during inspiration, breath-hold, and passive exhalation. Pulse sequence diagram for diffusion weighted imaging using B) 2D GRE and C) 2D spiral.
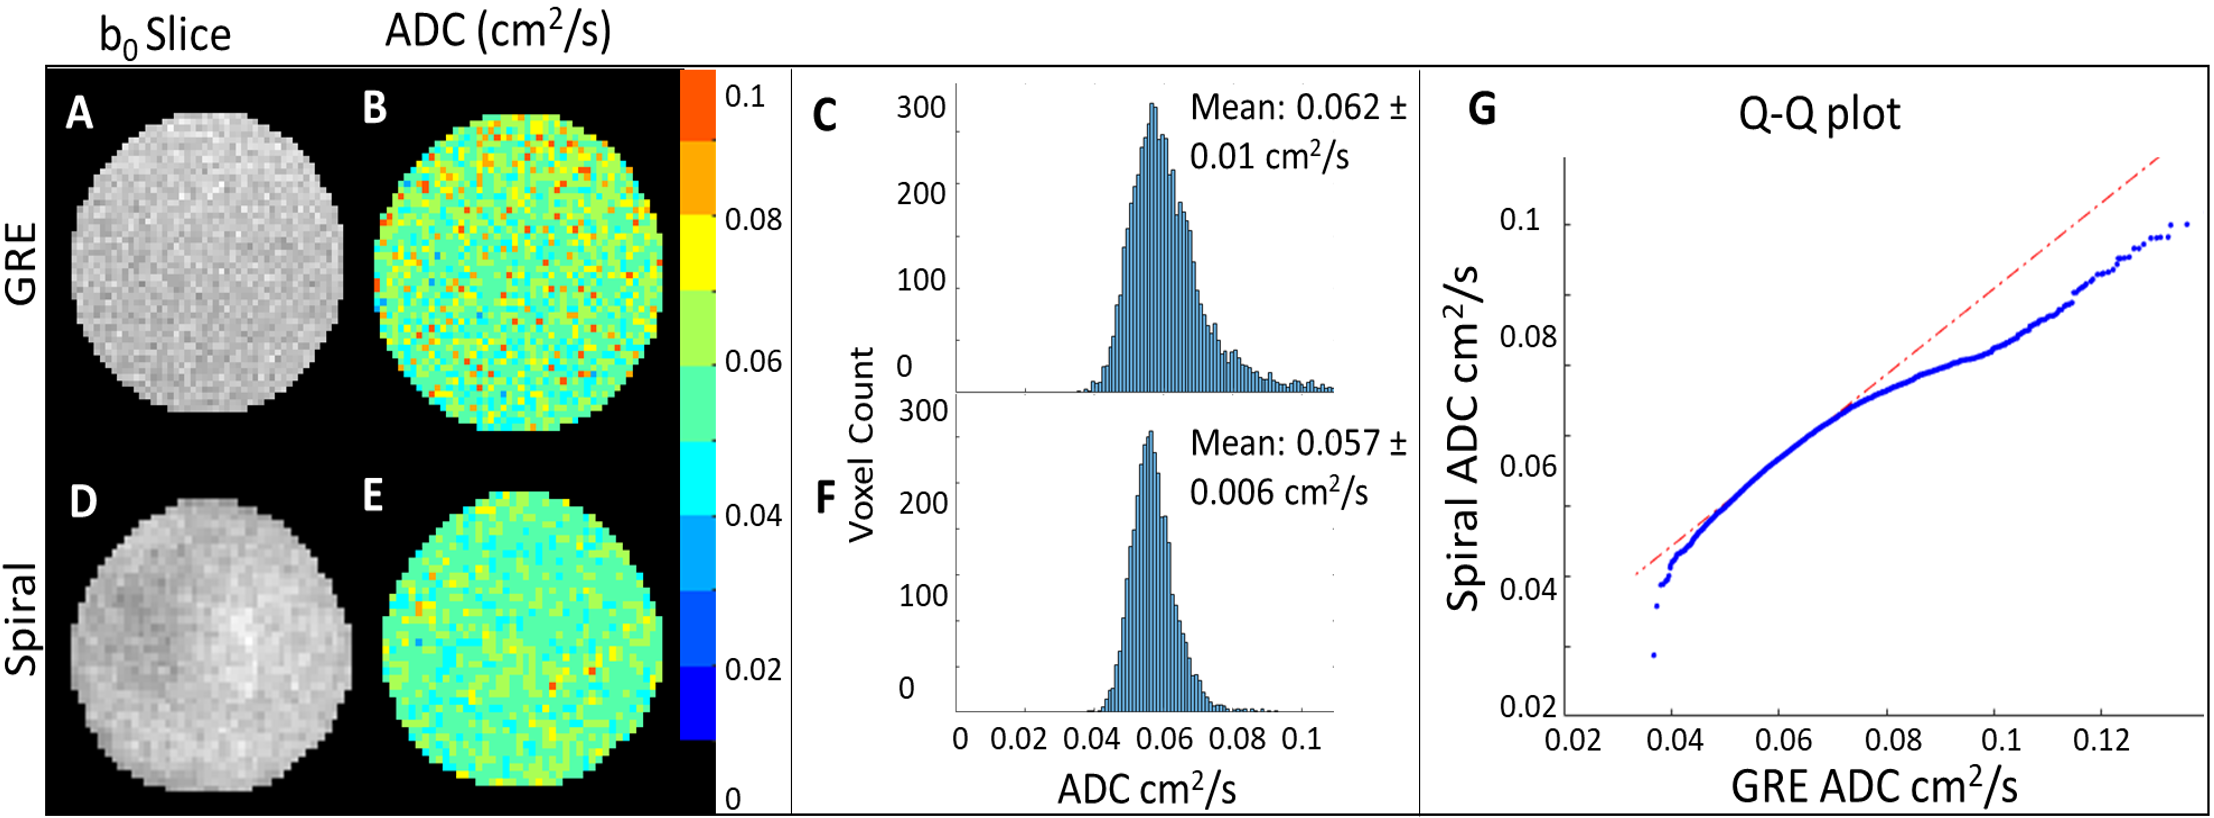
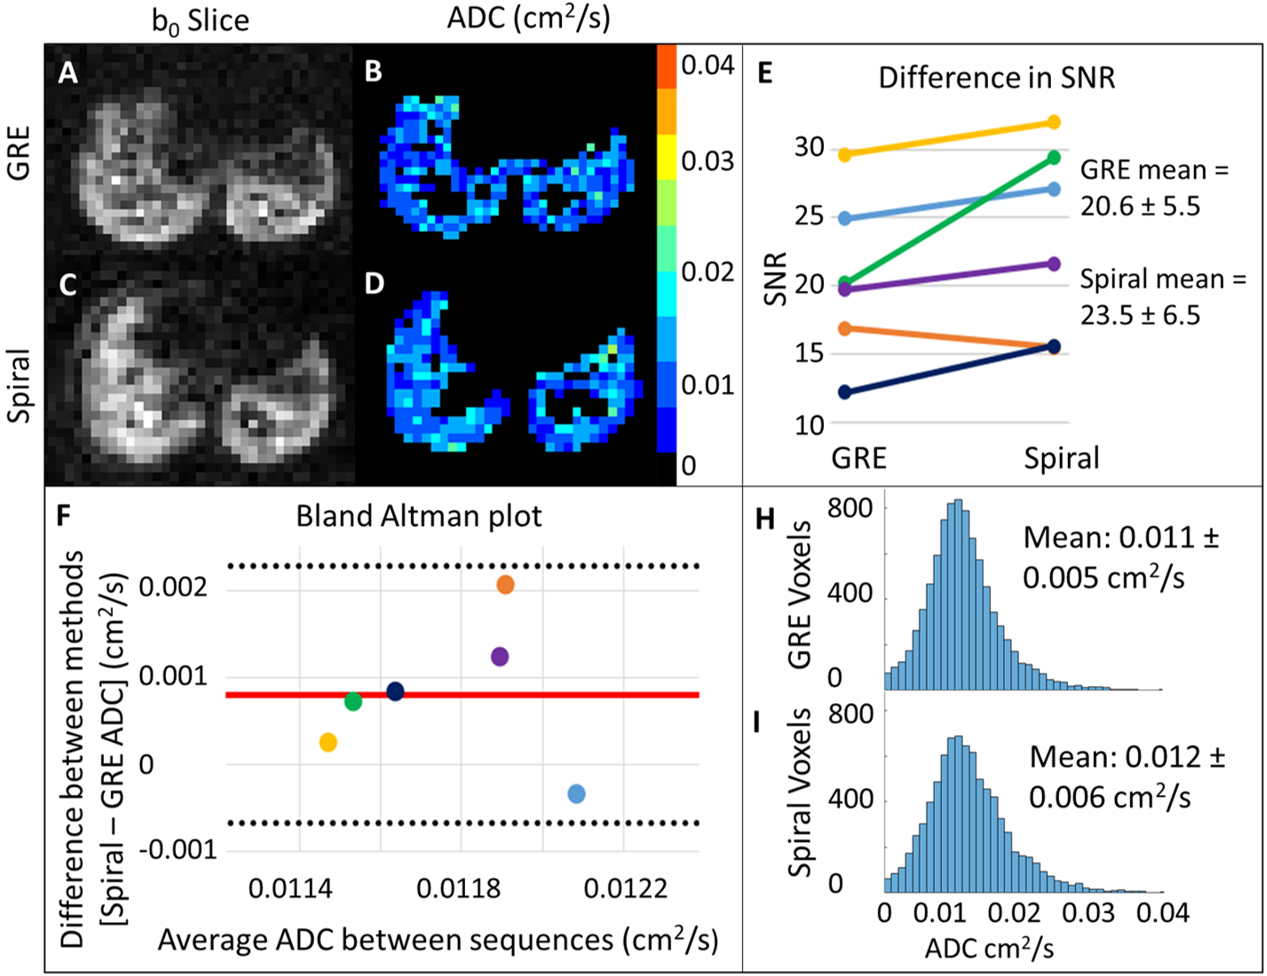
Fig 3. Wild-type images and ADC maps for GRE (A, B) and spiral (D, E) sequences. E) Slope plot demonstrating no significant difference in b0 SNR between sequences (p<0.5), likely reflecting polarization variability. F) Bland-Altman plot, showing a small bias toward higher ADC values from spiral (0.0008cm2/s). However, data from all animals fell within the 95% confidence interval, indicating strong overall agreement between spiral and GRE-derived mean ADC. ADC distributions (H, I) show a slight right skew in GRE-derived ADC, consistent with phantom observations.
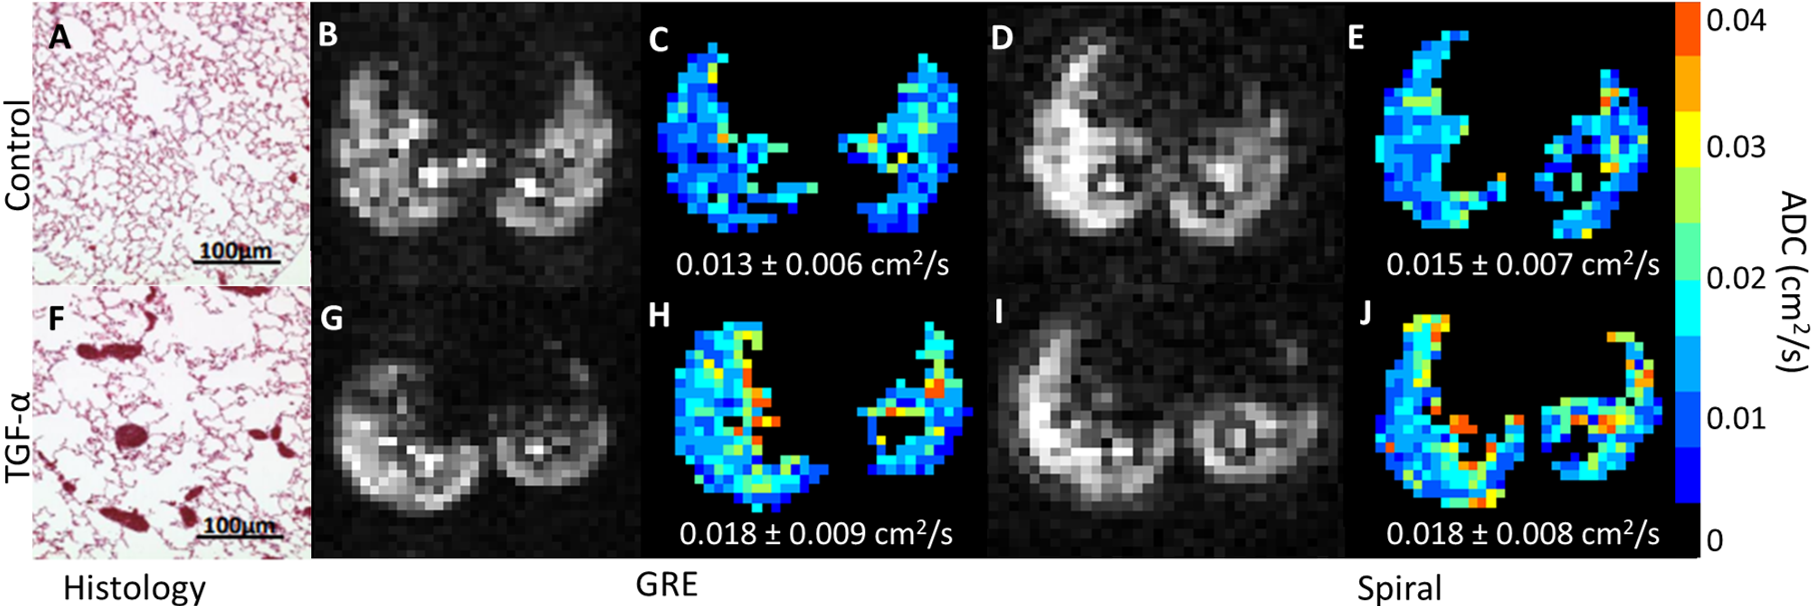
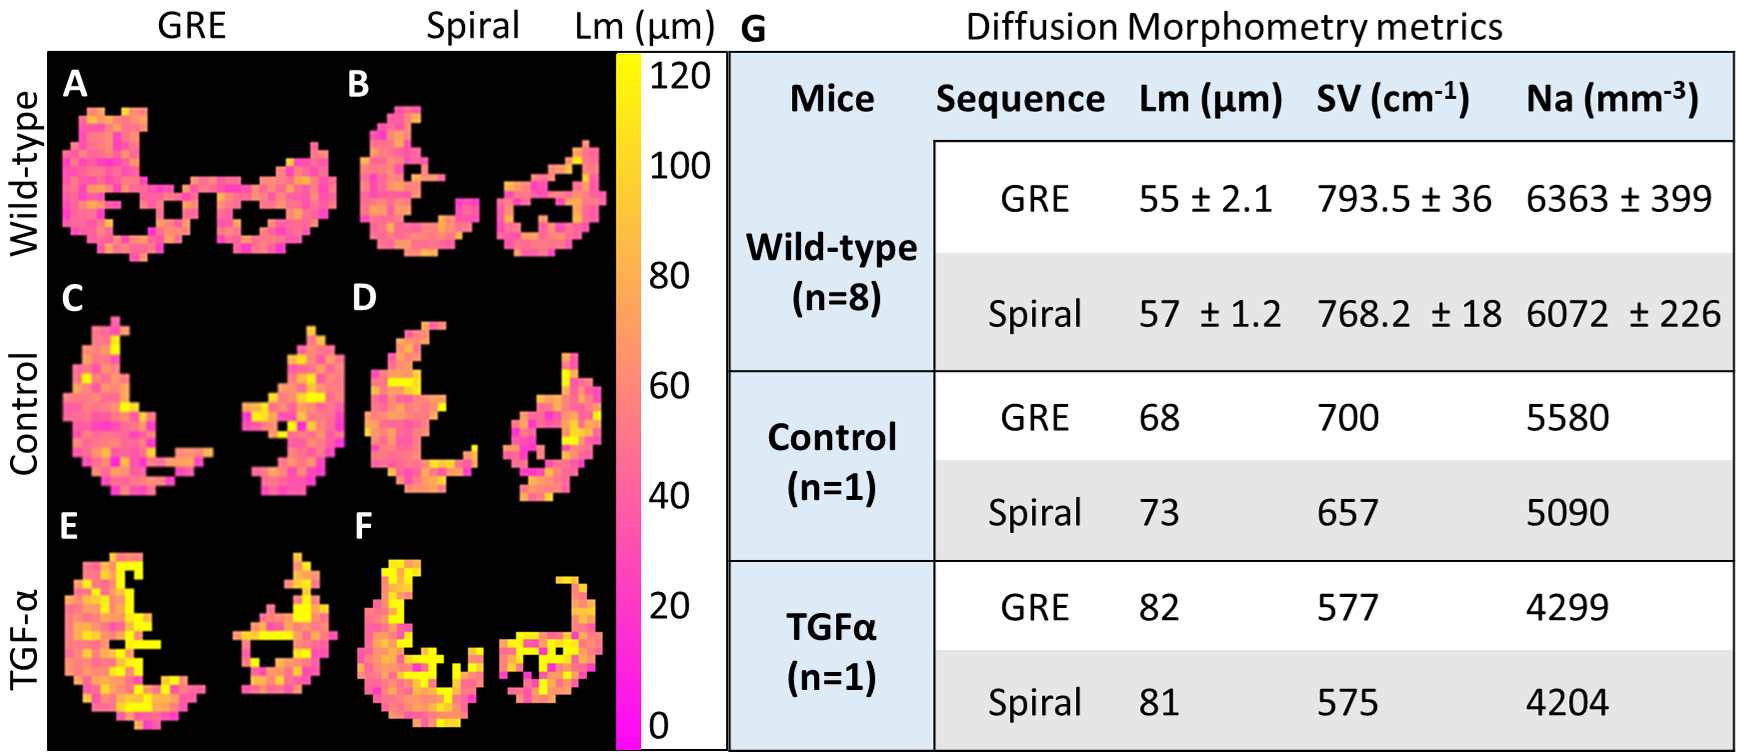
Fig 5. Diffusion morphometry metric Lm is lowest in wild-type animals (A, B), slightly increased in the control transgenic mouse (C, D), and highest in the TGF-α mouse (E, F). G) Inversely, SV and Na are highest in the wild-type mice, slightly increased in the control transgenic mouse, and lowest in the TGF-α mouse. Spiral morphometry values agreed well with GRE values.