1175
Dynamic Free-Breathing Ventilation and Gas Exchange with Hyperpolarized Xenon-1291University of Pennsylvania, Philadelphia, PA, United States
Synopsis
Hyperpolarized xenon-129 (HXe) imaging is capable of quantifying lung function through measurements of ventilation and gas exchange. However, traditional HXe approaches rely on long breath-holds for imaging, which may not be representative of steady-state behavior and are limited by the volume of gas that can be delivered. In this work, we imaged gas- and dissolved-phase xenon continuously over approximately 50 breaths and retrospectively binned the images, generating dynamic maps encompassing the entire respiratory cycle.
Introduction
In order to quantify gas exchange and assess regional changes in lung function, hyperpolarized xenon-129 (HXe) MRI takes advantage of the two distinct chemical shifts of xenon dissolved in the tissue/plasma (TP) and red bloods cells (RBC), respectively. Traditional HXe imaging approaches have typically involved long breath-holds at end-inspiration/expiration, producing static snapshots which may not fully characterize lung behavior and may be insensitive to the heterogeneous replacement of air with xenon1. In order to fully quantify the dynamics of ventilation and gas exchange, information from all phases of the breathing cycle is required. Due to the rapid depolarization of HXe in response to repeated RF excitations, acquiring this information during one breathing cycle is impractical. However, imaging over the course of several breaths with smaller doses of HXe continuously replenishes available polarization while maintaining sufficient signal-to-noise (SNR) in each individual image. This approach introduces additional SNR benefits for dissolved xenon in particular, as the total xenon dose is no longer limited by safety/anesthetic concerns or the patient’s tidal volume. Here, we explored the feasibility of continuously acquiring gas- (GP) and dissolved-phase (DP) xenon images over several minutes while the subject freely breathed a low-dose xenon mixture. The resulting images were retrospectively binned using diaphragm position to produce high-resolution maps of ventilation and gas exchange at distinct respiratory stages.Methods
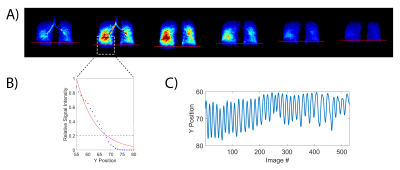
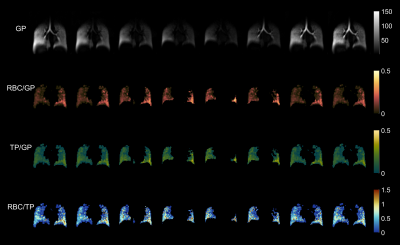
One healthy subject was imaged using an Institutional Review Board (IRB)-approved protocol in both prone and supine positions in a 1.5T scanner (Magnetom Avanto, Siemens) using an 8-channel 129Xe coil (Stark Contrast, Germany). A prototype commercial system (XeBox-E10, Xemed LLC, NH) was used to polarize 87% enriched xenon-129.Gas delivery, automated via a custom device, was administered through a nasal canula. The subject received a 50 mL dose of HXe with every inhalation while freely breathing room air. Imaging was performed continuously via a 3D stack-of-spirals sequence over the course of approximately four minutes, delivering 2.5 L of HXe in total. To quantify both ventilation and gas exchange, the frequencies of each RF excitation pulse were alternated between the GP (0 ppm) and RBC (218 ppm) resonances. The TE was chosen such that, for each RBC excitation, the phase of the RBC and TP resonances differed by precisely 90° at the center of k-space, allowing separation of these signals via the 1-point Dixon method2. The global RBC/TP ratio was determined from an acquired spectrum and used for phase correction to align the RBC and TP signals into real and imaginary compartments, respectively. The GP phase maps were subsequently used to correct B0 inhomogeneities. Other imaging parameters included: GP/RBC flip angles of 3°/30°, TR/TE = 8.13/0.81 ms, matrix size = 80x80x5, and FOV of 350x350x175 mm3. Approximately 500 GP and 500 DP images (undersampled by factor of 2) were acquired. From the GP images, the position of the diaphragm was calculated from the signal of the lower right lung, as indicated in Figure 1A. An exponential curve was fit to the sum of signals along the y-axis in this region, with the diaphragm position assumed to be at 20% of the maximum signal (Figure 1B). The diaphragm position over time (Figure 1C) was used to bin the GP and DP images into 8 distinct phases of the breathing cycle, after which the GP, RBC/GP, TP/GP, and RBC/TP maps were generated.
Results and Discussion
Figure 2 shows the retrospectively binned ratio maps at end-inspiration for both prone and supine positions in a healthy subject. The anterior-to-posterior gravitational gradient, consistent with supine HXe imaging, is clearly apparent in the distributions of the TP/GP, RBC/GP, and RBC/TP maps, in which the greater pleural pressure in the posterior lung increases tissue density, resulting in increased uptake and exchange. This gradient is partially reversed in the prone position due to reduced compression of the posterior lung. Figure 3 shows the middle slice across all 8 phases, illustrating changes in gas uptake and exchange over the breathing cycle. There are notable inaccuracies in the calculated ratio maps, however, as the phase corrections were performed based on spectra acquired during an end-inhale breath-hold, so the resulting RBC/TP ratios will not be particularly accurate for other stages of respiration. This source of error can be ameliorated in the future by interspersing spectra acquisitions throughout the imaging protocol. Additionally, the large number of acquired images creates an opportunity for further improvements in both SNR and resolution via the implementation of undersampling and keyhole techniques, with the latter showing particular promise due to the dependence of the 1-point Dixon method on the center of k-space.Conclusion
Combining retrospective gating with continuous, low-dose HXe imaging can quantify ventilation and gas exchange dynamics throughout the respiratory cycle, providing a more comprehensive evaluation of lung function during natural breathing.Acknowledgements
No acknowledgement found.References
[1] Hamedani, Hooman, et al (2021). Ventilation heterogeneity imaged by multibreath wash-ins of hyperpolarized 3He and 129Xe in healthy rabbits. The Journal of Physiology 599(17), 4197–4223.
[2] Kaushik, Sivaram S., et al (2016). Single-breath clinical imaging of hyperpolarized 129xe in the airspaces, barrier, and red blood cells using an interleaved 3D radial 1-point Dixon acquisition. MRM 75(4), 1434–43.
Figures


