1173
Texture Analysis as an Adjunct to Hyperpolarized 129Xe Ventilation Defect Percentage for Quantifying Cystic Fibrosis Lung Disease Severity1Center for Pulmonary Imaging Research, Cincinnati Children's Hospital Medical Center, Cincinnati, OH, United States, 2Department of Biomedical Engineering, University of Cincinnati, Cincinnati, OH, United States, 3Department of Radiology, Cincinnati Children's Hospital Medical Center, Cincinnati, OH, United States, 4Department of Pediatrics, University of Cincinnati, Cincinnati, OH, United States
Synopsis
MRI of hyperpolarized 129Xe has been shown to be a robust, non-invasive biomarker to assess pulmonary disease pathophysiology. Static spin-density maps (ventilation images) are commonly analyzed using the ventilation defect percentage (VDP) to quantify the degree of airway obstruction in diseases including asthma, chronic obstructive pulmonary disease, and cystic fibrosis. However, VDP reduces the intrinsic 3D-spatial richness of ventilation images to a global measure, suppressing underlying spatial correlations. In this work, a gray-level run-length matrix (GLRLM) analysis is assessed as an adjunct to VDP analysis for quantifying obstruction in Cystic Fibrosis (CF) lung disease, relative to a healthy control cohort.
Introduction
Hyperpolarized 129Xe as a gaseous contract agent has emerged as a powerful non-invasive, radiation-free technique to assess lung function1-4. As the use of this imaging technique grows, quantitative image analysis and data interpretation must be refined to yield more robust and clinically relevant measures of lung pathology. Ventilation images are currently quantified based on relative variations in signal intensity across different lung regions, with partial or fully obstructed areas being identified based on lower signal intensity. Ventilation Defect Percentage (VDP) motifs use a phenomenological threshold for signal quantification which may be insensitive to subtle changes caused by early lung pathophysiology.Texture analysis (gray-level run-length matrix, GLRLM)5 has been used to quantify spatial signal variations of 3He MRI in asthma6. These texture metrics have been used to quantify changes in ventilation heterogeneity in response to treatments such as bronchodilation6. Therefore, pairing VDP analysis with GLRLM texture analysis may provide greater sensitivity for quantifying obstruction in 129Xe ventilation images. In this study, we applied GLRLM analysis along with VDP as a method for extracting useful metrics from the texture present in HP 129Xe ventilation images from subjects with cystic fibrosis (CF) relative to age-matched healthy controls.
Methods
HP 129Xe MRI ventilation images were acquired in 46 healthy subjects (18.2±11.2 years) and 17 CF patients (19.9±5.6 years). HP 129Xe gas was polarized to 35−40% (Model 9820, Polarean, Durham, NC). The ventilation MR images were acquired using 2D gradient echoes on a 3T Philips Achieva or Ingenia scanner [resolution= 3x3x15 mm, TE=1.7 ms, TR=6.16 ms, FOV=350−250 mm2, 10-15 slices] during a <16 s breath-hold at inspiration. Subjects inhaled a 129Xe volume from functional residual capacity equal to 1/6th of predicted total lung capacity or 1L for adults7. Images were corrected using N4 field bias8. Binary masks of lung parenchyma (excluding airways) were manually segmented, and VDP analysis was performed in MATLAB. Images then were analyzed to quantify VDP using the 4 clusters (normally ventilated, incomplete ventilation, completely obstructed, hyper-ventilated) threshold method9. GLRLM texture analysis was performed in MATLAB to extract 11 second-order texture metrics: Short Run Emphasis (SRE), Long Run Emphasis (LRE), Gray-Level Nonuniformity (GLN), Run Length Nonuniformity (RLN), Run Percentage (RP), Low Gray-Level Run Emphasis (LGRE), High Gray-Level Run Emphasis (HGRE), Short Run Low Gray-Level Emphasis (SRLGE), Short Run High Gray-Level Emphasis (SRHGE), Long Run Low Gray-Level Emphasis (LRLGE), and Long Run High Gray-Level Emphasis (LRHGE).7 Wilcoxon Rank Sum Tests were used to assess statistical significance between Control and CF. In addition, VDP and GLRLM features were correlated using Pearson coefficient to test the influence of VDP on GLRLM features.Results
Figure 1 displays a Box-and-whisker plot of VDP with relative means and standard deviations showing the significant difference between CF and controls (P<0.001). Figure 2 shows the results of a Wilcoxon Rank Sum Test for each of the GLRLM texture metrics between CF and controls. 7 of the 11 texture parameters showed significant differences between the two cohorts (P<0.05). Figure 3 displays the Box-and-whisker plots of these 7 metrics showing the significant difference between the two cohorts. Figure 4 illustrates a linear regression of the 7 significant metrics compared to the VDP of the CF cohort. LRE and LRLGE showed a significant correlation (P<0.001) to VDP. Representative slices of 129Xe ventilation from an individual healthy and CF subject with near-equivalent VDPs were shown in Figure 5. However, texture analysis showed larger percent differences between these individual healthy and CF subjects in the same 5 GLMRM metrics (highlighted in red, Figure 5) that were group-wise statistically significant (>10% difference).Discussion
VDP has been demonstrated to be a sensitive biomarker to quantify lung function, but in individual patients, VDP can be insensitive to subtle changes in lung function, especially at early stages of the disease. In this study, we implemented texture analysis, which can provide additional information to VDP to quantify 129Xe ventilation images. More specifically, higher SRHGE and HGRE in CF suggest an increased number of small areas of higher signal intensity or an increase in visually ‘patchy’ areas within the image. Lower VDP difference and percent difference in LRE and LRLGE are consistent with our linear regression analysis; these metrics have a high correlation with VDP, indicating this approach yields commentary information.Conclusion
GLRLM texture analysis provides additional information beyond VDP analysis. Additionally, some metrics show correlation with VDP which indicates the robustness of this approach when quantifying 129Xe ventilation images.Acknowledgements
The authors acknowledge the following sources for research funding and support: Cincinnati Children’s Research Foundation and NIH (R01HL131012, R01HL143011, and R00HL138255).References
1. Walkup LL, Woods JC. Translational applications of hyperpolarized 3He and 129Xe. NMR in Biomedicine. 2014;27(12):1429-1438.
2. Goodson BM. Nuclear magnetic resonance of laser-polarized noble gases in molecules, materials, and organisms. Journal of Magnetic Resonance Imaging: An Official Journal of the International Society for Magnetic Resonance in Medicine. 2002;155(2):157-216.
3. Ruppert K. Biomedical imaging with hyperpolarized noble gases. Reports on Progress in Physics. 2014;77(11):116701.
4. Bdaiwi AS, Niedbalski PJ, Hossain MM, et al. Improving hyperpolarized (129) Xe ADC mapping in pediatric and adult lungs with uncertainty propagation. NMR Biomed. 2021:e4639.
5. Tang X. Texture information in run-length matrices. IEEE transactions on image processing. 1998;7(11):1602-1609.
6. Zha, Nanxi, et al. "Second-order Texture Measurements of 3He Ventilation MRI:: Proof-of-concept Evaluation of Asthma Bronchodilator Response." Academic radiology 23.2 (2016): 176-185.
7. Stocks, J., & Quanjer, P. H. (1995). Reference values for residual volume, functional residual capacity and total lung capacity. ATS Workshop on Lung Volume Measurements. Official Statement of The European Respiratory Society. European Respiratory Journal, 8(3), 492-506.
8. Tustison NJ, Avants BB, Cook PA, et al. N4ITK: improved N3 bias correction. IEEE Trans Med Imaging. 2010;29(6):1310-1320.
9. Roos JE, McAdams HP, Kaushik SS, Driehuys B. Hyperpolarized Gas MR Imaging: Technique and Applications. Magn Reson Imaging Clin N Am. 2015;23(2):217-229.
Figures
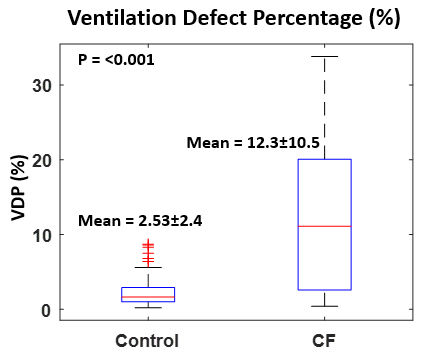
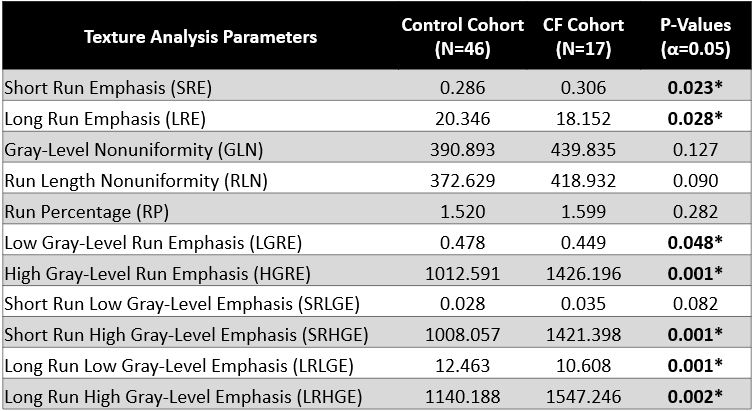
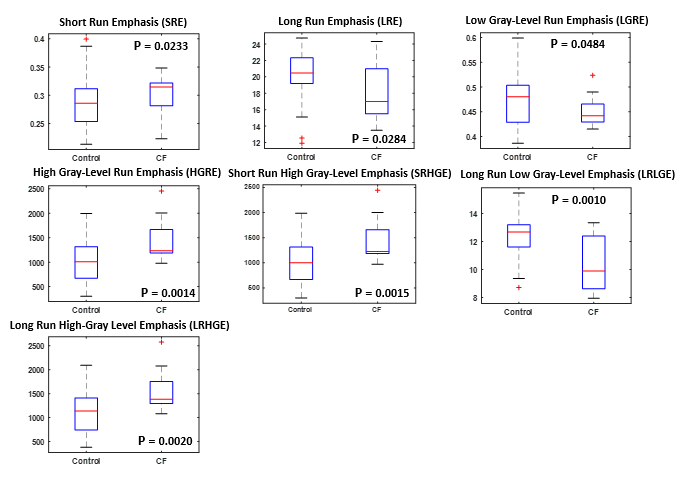
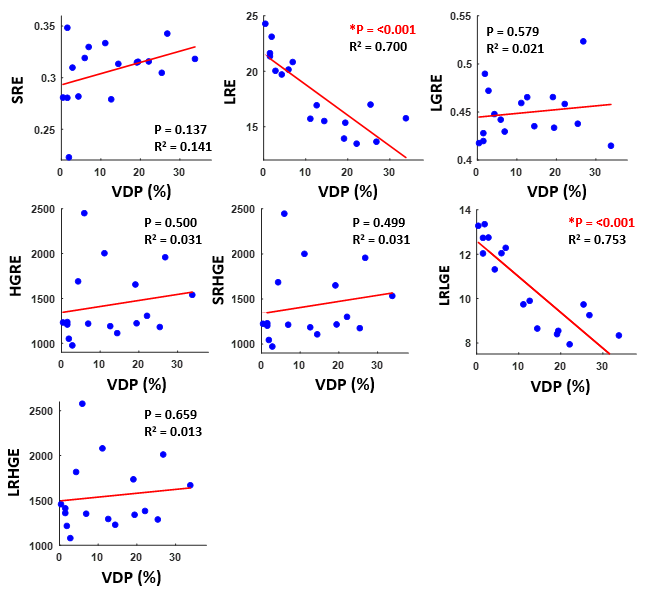
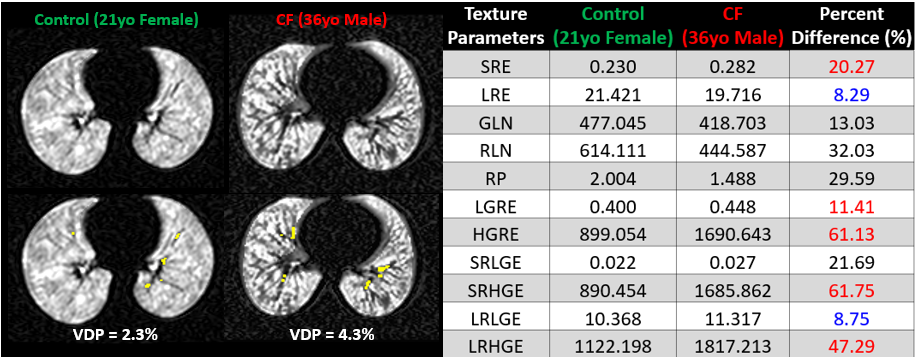
FIGURE 5: Left: A single representative 129Xe MRI ventilation slice from a Control and CF subject with highlights of ventilation defect regions (yellow) and overall VDP for all slices. Right: 11 texture analysis results for the corresponding subjects. Highlighted in red are texture metrics that were significant. Highlighted in blue are metrics that were significant and had strong correction with VDP.