1172
Assessing the Age Dependence of 129Xe Gas-exchange MRI for Individual Healthy Subjects1Pulmonary Medicine, Cincinnati Children's Hospital Medical Center, Cincinnati, OH, United States, 2Biomedical Engineering, University of Cincinnati, Cincinnati, OH, United States, 3Radiology, Cincinnati Children's Hospital Medical Center, Cincinnati, OH, United States, 4Pediatrics, University of Cincinnati Medical Center, Cincinnati, OH, United States, 5Physics, University of Cincinnati, Cincinnati, OH, United States
Synopsis
129Xe-MRI can quantify abnormal gas-exchange by defining thresholds derived from voxel-level gas-exchange distributions in healthy subjects. Previous studies assumed a constant healthy distribution independent of age. By fitting to Box-Cox Power Exponential distributions, normal distributions cannot be assumed, and the distributions vary significantly with age. The effect size of age (5-69 years) on healthy ventilation, barrier-uptake, and red-blood cell to barrier (ratio) signal distributions were 14 to 57%. Thus, age and distribution shape should be considered when defining reference distributions for gas-exchange metrics. By accounting for age-dependent variations, the reference distributions abnormal thresholds could be narrowed.
Introduction:
Hyperpolarized 129Xe-MRI is a sensitive tool to assess pulmonary ventilation, the uptake of 129Xe into the interstitial-tissues and blood-plasma, and the transfer of gas to the red blood cells (RBC). It is frequently compared to traditional pulmonary function tests (PFTs), such as spirometry and DLCO1–5. To enable comparisons between subjects, traditional PFTs attempt to account for expected differences in lung function due to demographic factors, including height, gender, ethnicity and age6,7. However, these well-known biological variances have yet to be incorporated meaningfully into 129Xe-MRI-derived metrics of lung function, including gas-exchange1,8,9. Thus, our aim was to determine which 129Xe gas-exchange MRI metrics display a significant age dependence, and to estimate the effect size of age on these metrics.Methods:
22 healthy subjects ranging in age from 5 to 69 years were imaged according to a protocol approved by our local Institutional Review Board (with FDA IND-123,577). 129Xe (86%-enriched) was polarized to 30-40% via a 129Xe hyperpolarizer (Polarean 9820A, Durham, NC)10.129Xe gas-exchange MRI was performed on Philips 3.0T scanners, using either a commercial (Clinical MR Solutions, Brookfield, WI) or custom-built dual-loop 129Xe coil11. Subjects inhaled a volume of 129Xe dosed to 1/6th of their height-predicted total lung capacity, up to 1L, for a 15 second breath-hold12. Gas-phase and dissolved-phase data were acquired using an interleaved 3D-radial sequence13. The dissolved-phase data were subsequently divided into barrier and RBC images using 1-point Dixon decomposition14,15. Imaging parameters included: FOV=325×325×325mm3, matrix=563, TR=15ms between same-frequency excitations, TE90≈0.46ms, dwell time=19.1µs, 950 radial-projections, and 58 readout-points.
Images were reconstructed in MATLAB using open-source reconstruction software16 with iterative density compensation to account for non-cartesian gridding [kernel sharpness value: σ=0.3 for ventilation images; σ=0.1 for dissolved-phase images]. Ventilation images were corrected for coil inhomogeneity using N4 bias correction17. Barrier-uptake and RBC-transfer were calculated by dividing the barrier and RBC images by the amount of gas-phase signal, respectively, while RBC:barrier were calculated by dividing the RBC image by the barrier image15.
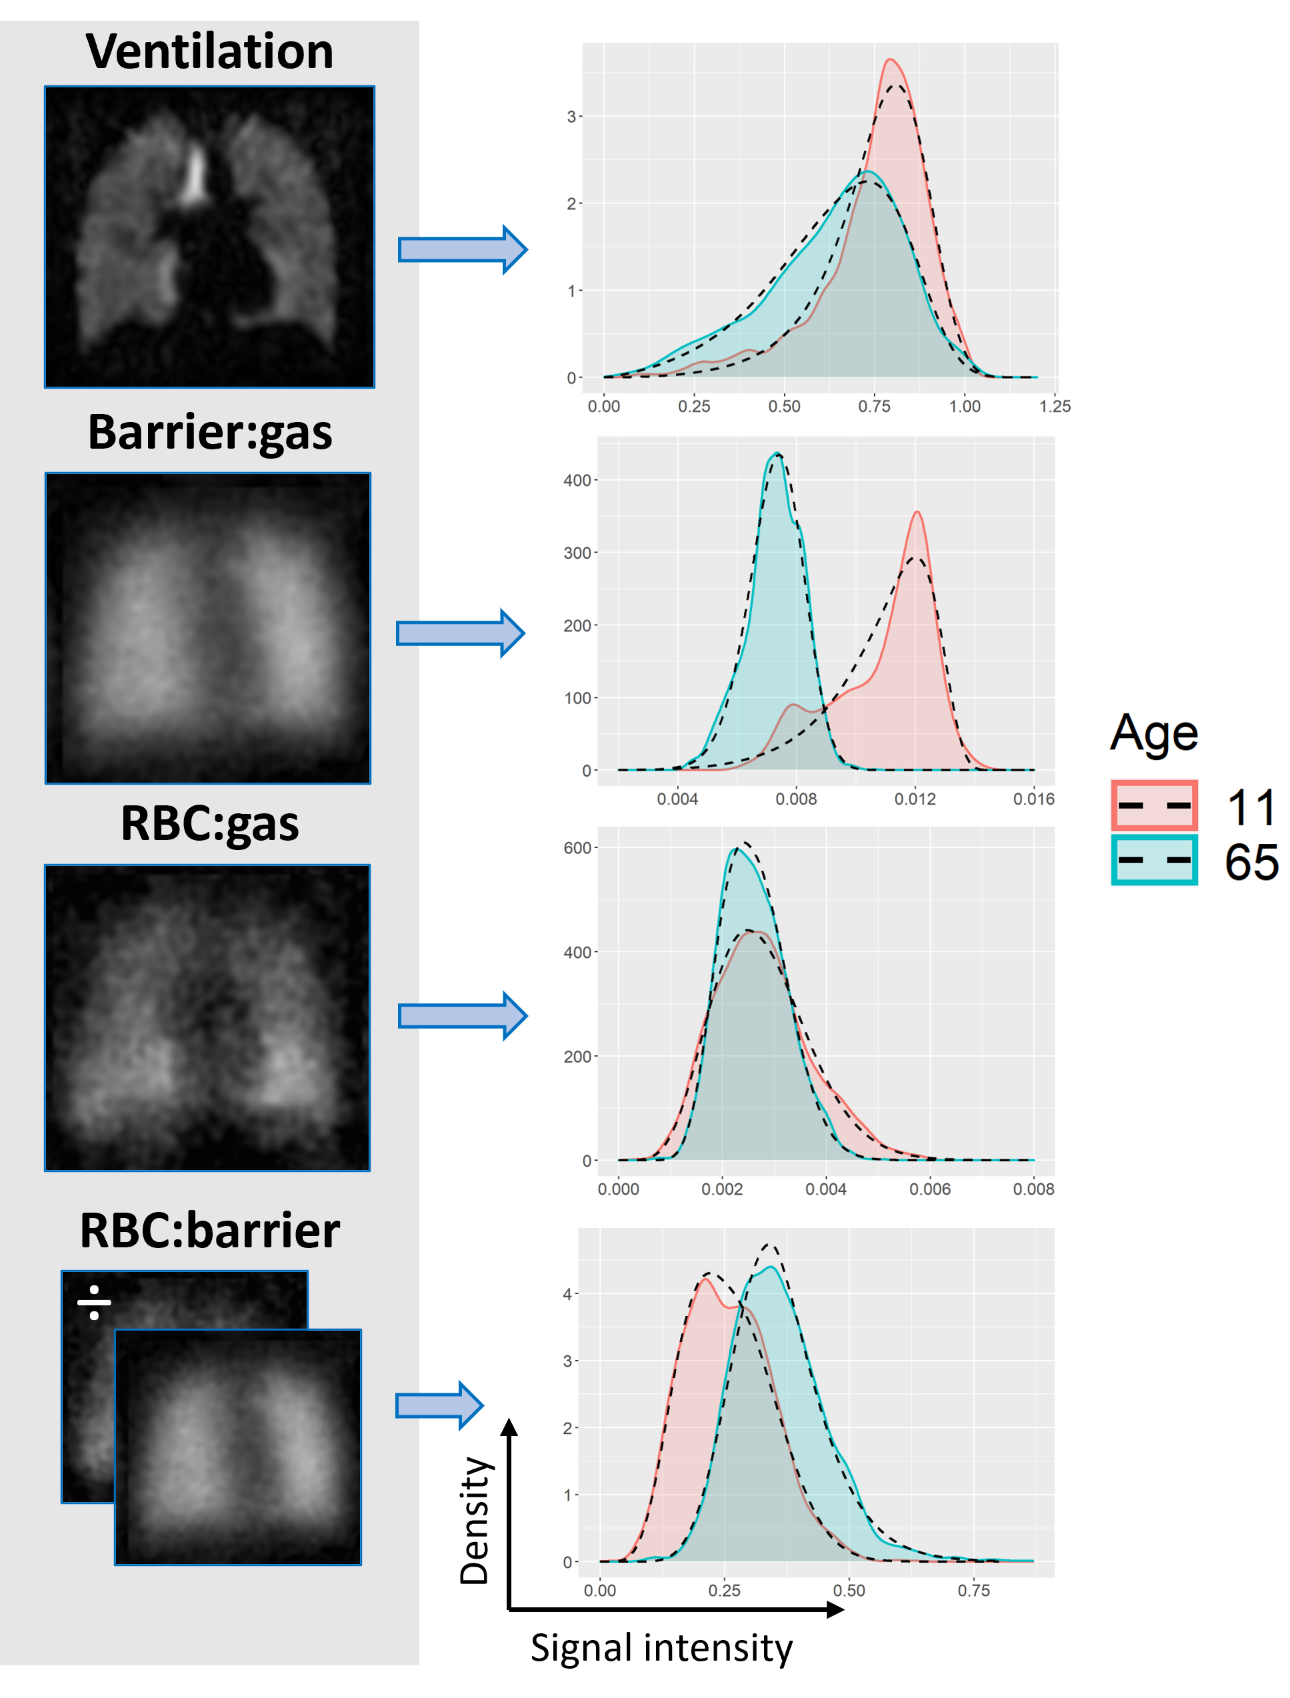
Some studies have accounted for non-normal reference cohorts by implementing a Box-Cox transform18. Thus, we use a Box-Cox Power Exponential (BCPE) 19 distribution to fit 2,000 random voxel-intensities per subject from each of the ventilation, barrier-uptake, RBC-transfer, and RBC:barrier maps via the Generalized Additive Model for Location, Scale and Shape (GAMLSS)20 software package in R (Fig. 1). This fitting permitted extraction of the location (mean, μ), scale (variation, σ ), and shape (skewness η, and kurtosis τ) distribution parameters, for each gas-exchange metric. The correlations between each subject’s distribution parameters and age were assessed by fitting a Generalized Additive Model using the GAM21 software package in R. Significant age dependence was determined by a p<.05 for the GAM fit. The effect sizes of age on each gas-exchange distribution parameter were determined by R2, where effect sizes of 4%, 25%, and 64% are termed small, medium, and large effects22.
Results:
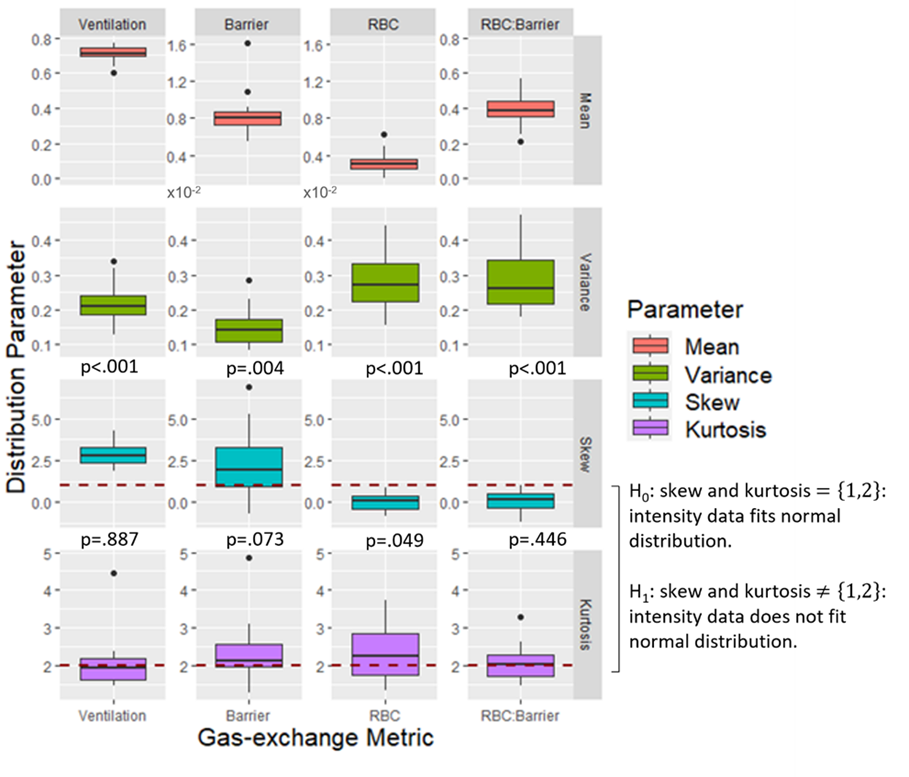
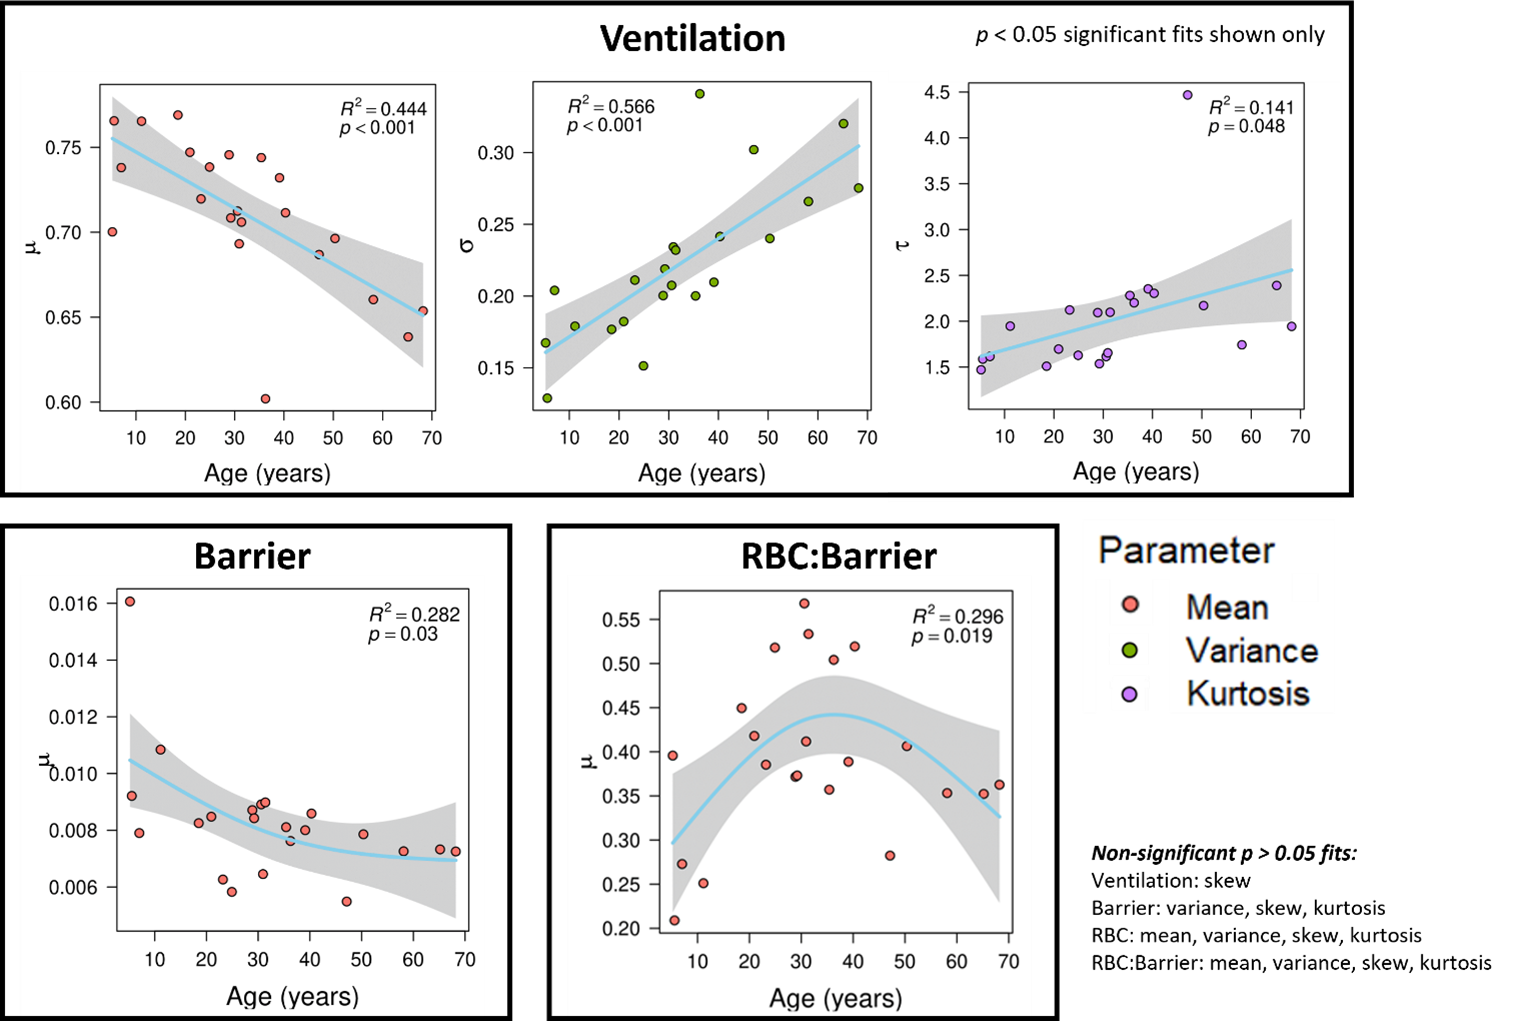
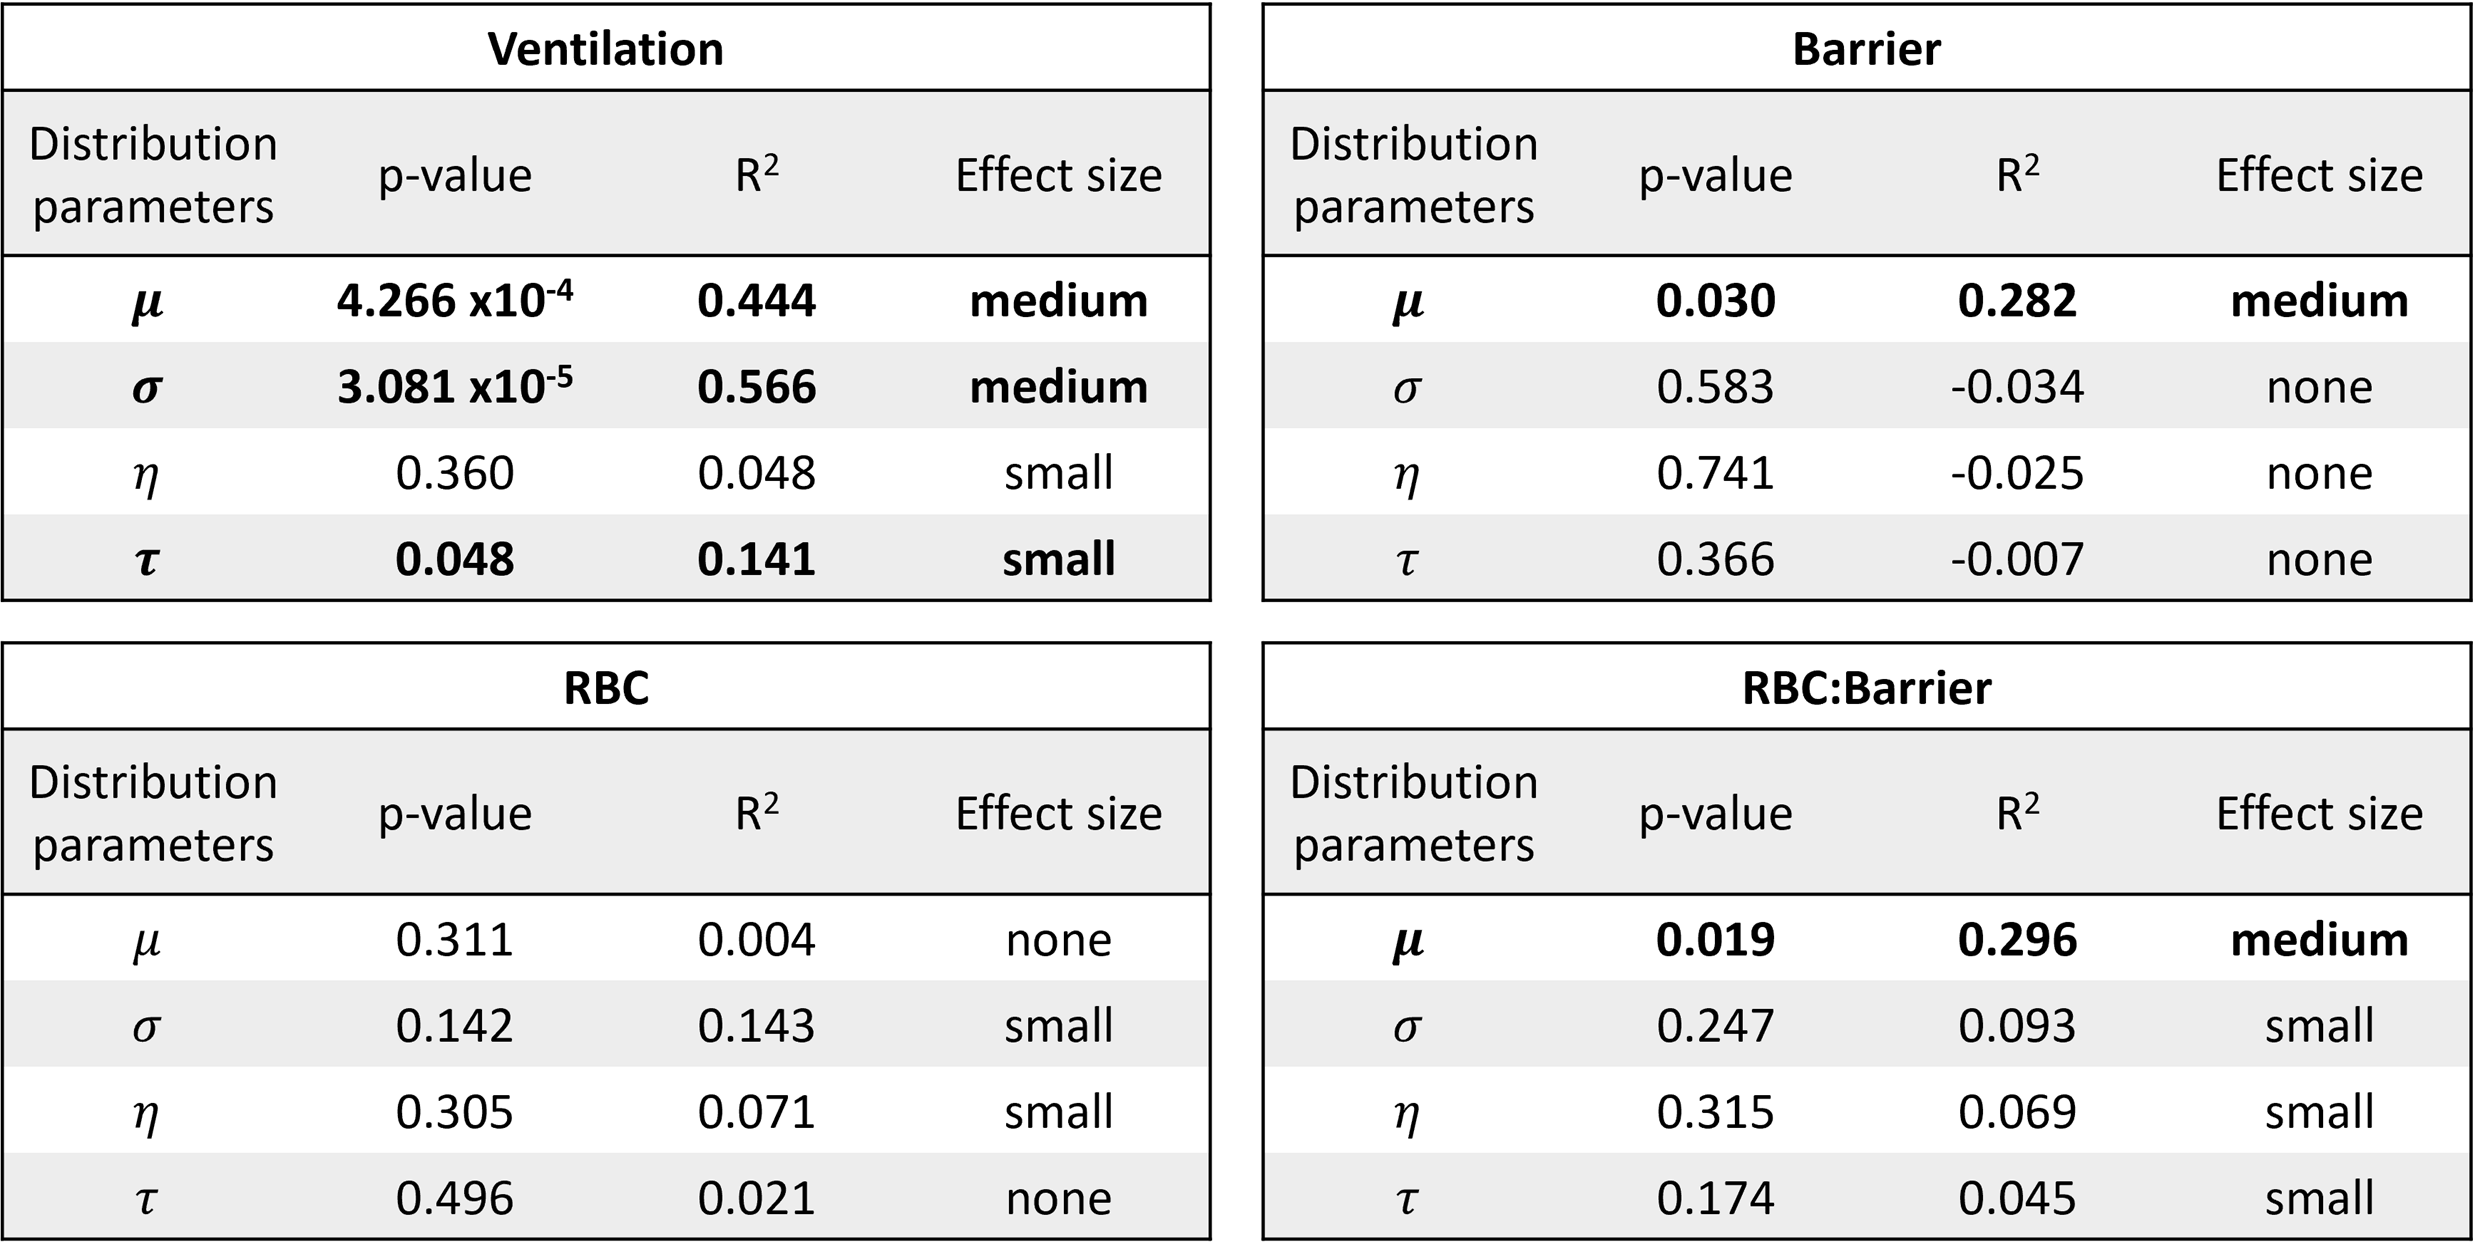
The BCPE distribution fits for each healthy subject found the average skew for the ventilation (p<0.001), barrier-uptake (p=0.004), RBC-transfer (p<0.001), and RBC:barrier (<0.001) gas-exchange metrics to be significant (Fig. 2). In comparison, the average subject only had a significant kurtosis for the RBC-transfer (p=0.049) gas-exchange metric. Thus, on an individual level, the healthy gas-exchange distributions are significantly different from a normal distribution (skew = 1, kurtosis = 2 for BCPE distribution), which should be accounted for in future analyses.5 of the 16 total gas-exchange distribution parameters showed a significant dependence on age (Fig. 3). These consist of: mean (p<.001), variance (p<.001), and kurtosis (p=.048) for ventilation; mean (p=.030) for barrier-uptake; and mean (p=.019) for RBC:barrier. Of these parameters, age had small effect-size on ventilation kurtosis (accounts for 14% of the variance in kurtosis). Medium effect-sizes for age were found for ventilation mean (44% of variance), ventilation variance (57% of variance), barrier-uptake mean (28% of variance), and RBC:barrier mean (30% of variance) (Fig. 4).
Discussion:
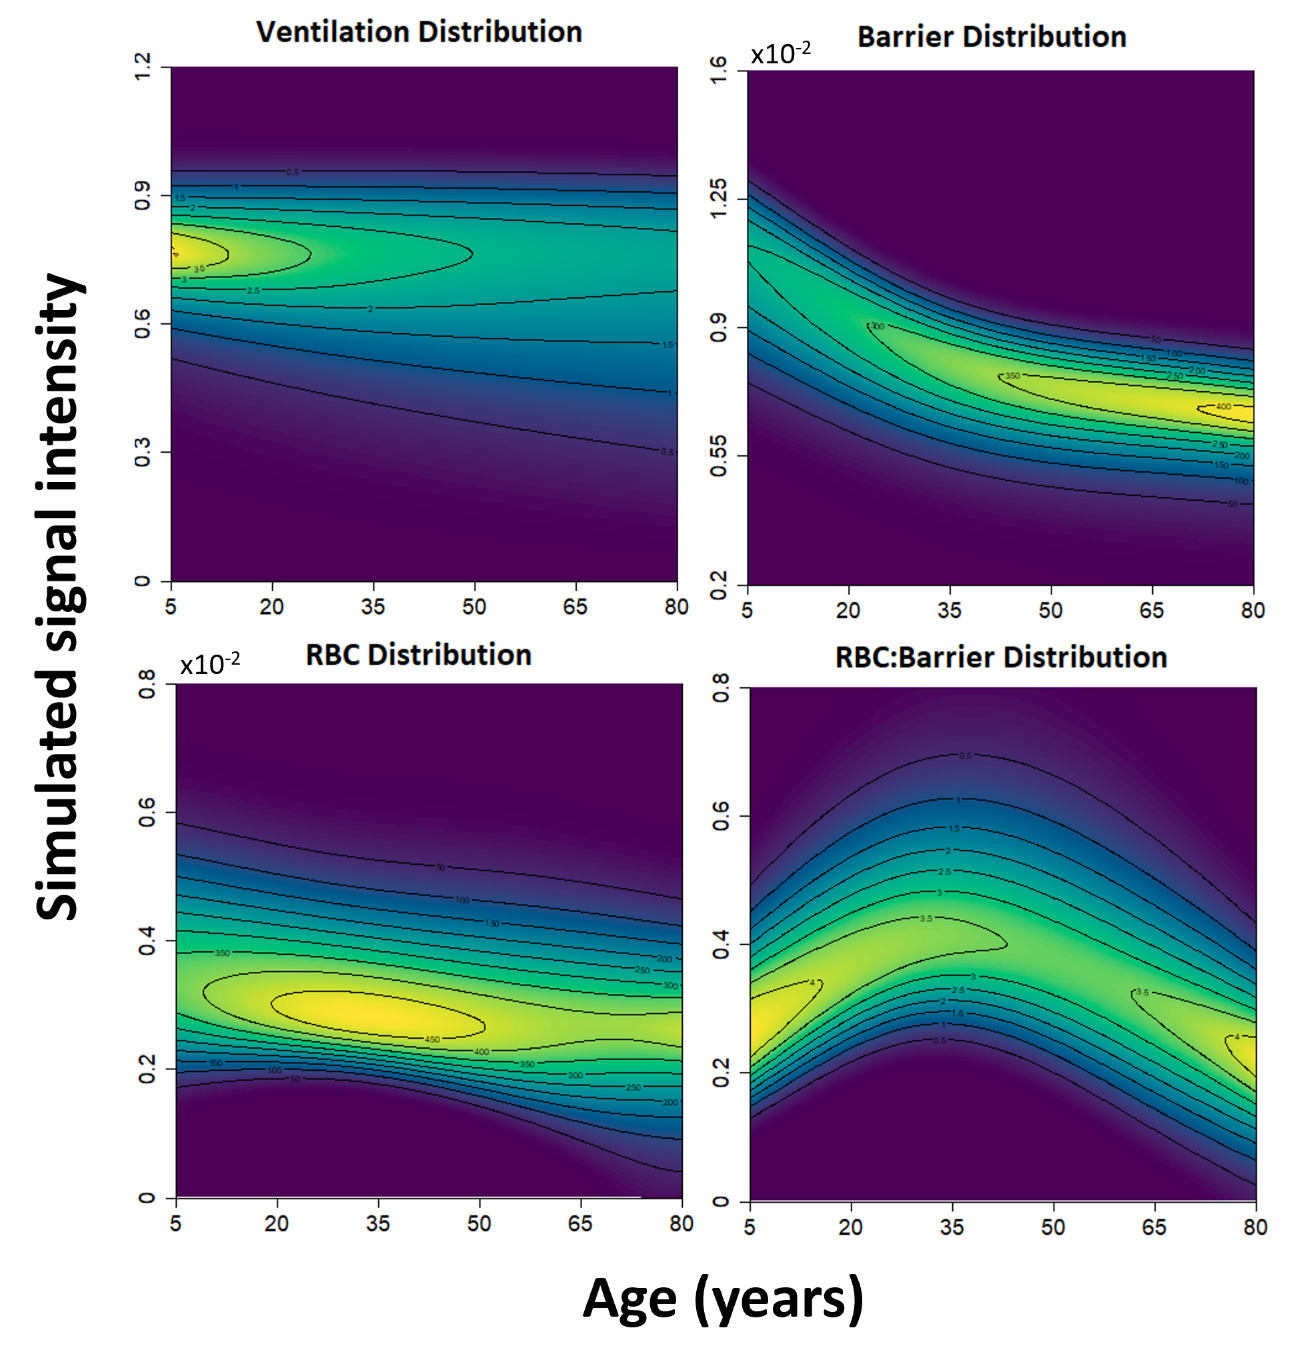
Many of the gas-exchange distributions were significantly different from a normal distribution. While this would supported by known physiological mechanics, such as the gravitational effect on the lung while supine23–25, it could also be confounded by experimental parameters such as polarization, acquisition, reconstruction, and processing settings – of which affect image quality. Ultimately, such findings should be accounted for when making gas-exchange comparisons.The mean and coefficient of variation are expected to have a significant impact on sensitivity due to how large of a role they play in determination of the normal thresholds, when being determined from a healthy reference distribution via a binned analysis approach. We show that such parameters vary significantly with age for the ventilation, barrier-uptake, and RBC:barrier distributions. This would lead to broadened healthy reference distributions and binning thresholds, reducing the sensitivity of the gas-exchange imaging metrics. The degree of this age variation for the average subject is visualized using model-simulated gas-exchange distributions in Fig. 5.
Conclusion:
129Xe gas-exchange MRI is a valuable technique to assess pulmonary function including ventilation and gas-exchange in a single breath-hold. However, healthy individual distributions are significantly not normally distributed. Additionally, age is a significant covariate for many of the gas-exchange metrics and should be considered in future analysis to increase sensitivity for early lung disease.Acknowledgements
The authors thank the following sources for research funding and support R01HL151588, R01HL143011, CFF WOODS19A0, R01HL131012, and R00HL138255.
References
1. Wang Z, Rankine L, Bier EA, et al. Using hyperpolarized 129Xe gas-exchange MRI to model the regional airspace, membrane, and capillary contributions to diffusing capacity. J Appl Physiol. 2021;130(5):1398-1409. doi:10.1152/japplphysiol.00702.2020
2. Rayment JH, Couch MJ, McDonald N, et al. Hyperpolarised 129Xe magnetic resonance imaging to monitor treatment response in children with cystic fibrosis. Eur Respir J. 2019;53(5). doi:10.1183/13993003.02188-2018
3. Virgincar RS, Cleveland ZI, Sivaram Kaushik S, et al. Quantitative analysis of hyperpolarized 129Xe ventilation imaging in healthy volunteers and subjects with chronic obstructive pulmonary disease. NMR Biomed. 2013;26(4):424-435. doi:10.1002/nbm.2880
4. Qing K, Mugler JP, Altes TA, et al. Assessment of lung function in asthma and COPD using hyperpolarized 129Xe chemical shift saturation recovery spectroscopy and dissolved-phase MRI. NMR Biomed. 2014;27(12):1490-1501. doi:10.1002/nbm.3179
5. Couch MJ, Thomen R, Kanhere N, et al. A two-center analysis of hyperpolarized 129Xe lung MRI in stable pediatric cystic fibrosis: Potential as a biomarker for multi-site trials. J Cyst Fibros. 2019;18(5):728-733. doi:10.1016/j.jcf.2019.03.005
6. Stanojevic S, Graham BL, Cooper BG, et al. Official ERS technical standards: Global Lung Function Initiative reference values for the carbon monoxide transfer factor for Caucasians. Eur Respir J. 2017;50(3). doi:10.1183/13993003.00010-2017
7. Stanojevic S, Wade A, Stocks J, et al. Reference ranges for spirometry across all ages: A new approach. Am J Respir Crit Care Med. 2008;177(3):253-260. doi:10.1164/rccm.200708-1248OC
8. Rankine L, Wang Z, Wang J, et al. 129Xe Gas Exchange MRI as a Potential Prognostic Marker for Progression of Idiopathic Pulmonary Fibrosis. Ann Am Thorac Soc. Published online 2019:1-12.
9. Hahn AD, Kammerman J, Evans M, et al. Repeatability of regional pulmonary functional metrics of Hyperpolarized 129Xe dissolved-phase MRI. J Magn Reson Imaging. 2019;50(4):1182-1190. doi:10.1002/jmri.26745
10. Plummer JW, Emami K, Dummer A, Woods JC, Walkup LL, Cleveland ZI. A semi-empirical model to optimize continuous-flow hyperpolarized 129Xe production under practical cryogenic-accumulation conditions. J Magn Reson. 2020;320:106845. doi:10.1016/j.jmr.2020.106845
11. Loew W, Thomen RP, Giaquinto R, et al. A dual loop T/R-xenon coil for homogenous excitation with improved comfort and size. In: Proc. 24th Annu. Meet. ISMRM. ; 2016.
12. Stocks J, Quanjer PH. Reference values for residual volume, functional residual capacity and total lung capacity: ATS Workshop on Lung Volume Measurements Official Statement of the European Respiratory Society. Eur Respir J. 1995;8(3):492-506. doi:10.1183/09031936.95.08030492
13. Willmering MM, Cleveland ZI, Walkup LL, Woods JC. Removal of off-resonance xenon gas artifacts in pulmonary gas-transfer MRI. Magn Reson Med. 2021;86(2):907-915. doi:10.1002/mrm.28737
14. Kaushik SS, Freeman MS, Yoon SW, et al. Measuring diffusion limitation with a perfusion-limited gas-Hyperpolarized 129Xe gas-transfer spectroscopy in patients with idiopathic pulmonary fibrosis. J Appl Physiol. 2014;117(6):577-585. doi:10.1152/japplphysiol.00326.2014
15. Wang Z, Robertson SH, Wang J, et al. Quantitative analysis of hyperpolarized 129Xe gas transfer MRI. Med Phys. 2017;44(6):2415-2428. doi:10.1002/mp.12264
16. Robertson SH, Virgincar RS, He M, Freeman MS, Kaushik SS, Driehuys B. Optimizing 3D noncartesian gridding reconstruction for hyperpolarized 129Xe MRI-focus on preclinical applications. Concepts Magn Reson Part A Bridg Educ Res. 2015;44(4):190-202. doi:10.1002/cmr.a.21352
17. Tustison NJ, Avants BB, Cook PA, et al. N4ITK: Improved N3 Bias Correction. IEEE Trans Med Imaging. 2010;29(6):1310-1320. doi:10.1109/TMI.2010.2046908
18. He M, Wang Z, Rankine L, et al. Generalized Linear Binning to Compare Hyperpolarized 129Xe Ventilation Maps Derived from 3D Radial Gas Exchange Versus Dedicated Multislice Gradient Echo MRI. Acad Radiol. 2020;27(8):e193-e203. doi:10.1016/j.acra.2019.10.016
19. Rigby RA, Stasinopoulos DM. Smooth centile curves for skew and kurtotic data modelled using the Box-Cox power exponential distribution. Stat Med. 2004;23(19):3053-3076. doi:10.1002/sim.1861
20. Rigby RA, Stasinopoulos DM, Lane PW. Generalized additive models for location, scale and shape. J R Stat Soc Ser C Appl Stat. 2005;54(3):507-554. doi:10.1111/j.1467-9876.2005.00510.x
21. Hastie T, Tibshirani R. Exploring the Nature of Covariate Effects in the Proportional Hazards Model. Biometrics. 1990;46(4):1005. doi:10.2307/2532444
22. Sullivan GM, Feinn R. Using Effect Size—or Why the P Value Is Not Enough. J Grad Med Educ. 2012;4(3):279-282. doi:10.4300/JGME-D-12-00156.1
23. Mugler JP, Altes TA, Ruset IC, et al. Simultaneous magnetic resonance imaging of ventilation distribution and gas uptake in the human lung using hyperpolarized xenon-129. Proc Natl Acad Sci U S A. 2010;107(50):21707-21712. doi:10.1073/pnas.1011912107
24. Cleveland ZI, Cofer GP, Metz G, et al. Hyperpolarized 129Xe MR imaging of alveolar gas uptake in humans. PLoS One. 2010;5(8):1-8. doi:10.1371/journal.pone.0012192
25. Kaushik SS, Freeman MS, Cleveland ZI, et al. Probing the regional distribution of pulmonary gas exchange through single-breath gas-and dissolved-phase 129Xe MR imaging. J Appl Physiol. 2013;115(6):850-860. doi:10.1152/japplphysiol.00092.2013
Figures