1167
129Xe MRI patterns of lung function in patients with asthma and/or COPD in the NOVELTY study1Department of Infection, Immunity and Cardiovascular Disease, University of Sheffield, Sheffield, United Kingdom, 2Priory Medical Group, York, United Kingdom, 3Evidence Delivery, BioPharmaceuticals Medical, Biopharmaceuticals Business Unit, AstraZeneca, Gothenburg, Sweden, 4Translational Science and Experimental Medicine, Research and Early Development, Respiratory & Immunology, Biopharmaceuticals R&D, AstraZeneca, Cambridge, United Kingdom, 5Clinical Development, Research and Early Development, Respiratory & Immunology, AstraZeneca, Cambridge, United Kingdom
Synopsis
There is a need for biomarkers to guide appropriate treatment in patients with clinical features of both asthma and COPD. A broadly-defined population of 164 patients with asthma and/or COPD taking part in the NOVELTY study were recruited from primary care and scanned with 129Xe MRI (ventilation, acinar microstructure and gas exchange measurements). 129Xe MRI global and regional metrics showed significant differences between patients with asthma, asthma+COPD and COPD. 129Xe MRI metrics remained sensitive to diagnosis sub-groups when only patients with normal pulmonary function tests were considered.
Introduction
There is a need for biomarkers to guide appropriate treatment in patients with clinical features of both asthma and COPD. 129Xe MRI is highly sensitive to lung function abnormalities and may be able to assist in phenotyping patients. Increased ventilation heterogeneity in asthma1 and COPD2, and elevated acinar dimensions3 and reduced gas exchange4 in COPD have been observed in multiple studies. However, most study populations are well-defined and specific to either asthma or COPD. Patients with combined asthma and COPD have poorer quality of life5 and increased hospitalisations6 compared to patients with asthma or COPD alone. In this work we aimed to study the 129Xe MRI characteristics of a broad, real-world population of patients with asthma and/or COPD.Methods
164 patients (aged 21-82 years) with asthma and/or COPD taking part in the NOVELTY study7 (NCT02760329), were recruited from 2 primary care centres in the UK.Patients were scanned using a 1.5T whole body MRI system (GE HDx) and 129Xe transmit-receive vest coil (CMRS) at breath-hold after inhaling a mix of hyperpolarised 129Xe and N2. 3D SSFP 129Xe ventilation images8, 3D multiple b-value 129Xe diffusion images9 and 3D dissolved-phase 129Xe spectroscopic images10 were acquired. Patients also performed spirometry, body plethysmography, and gas transfer during the same visit.
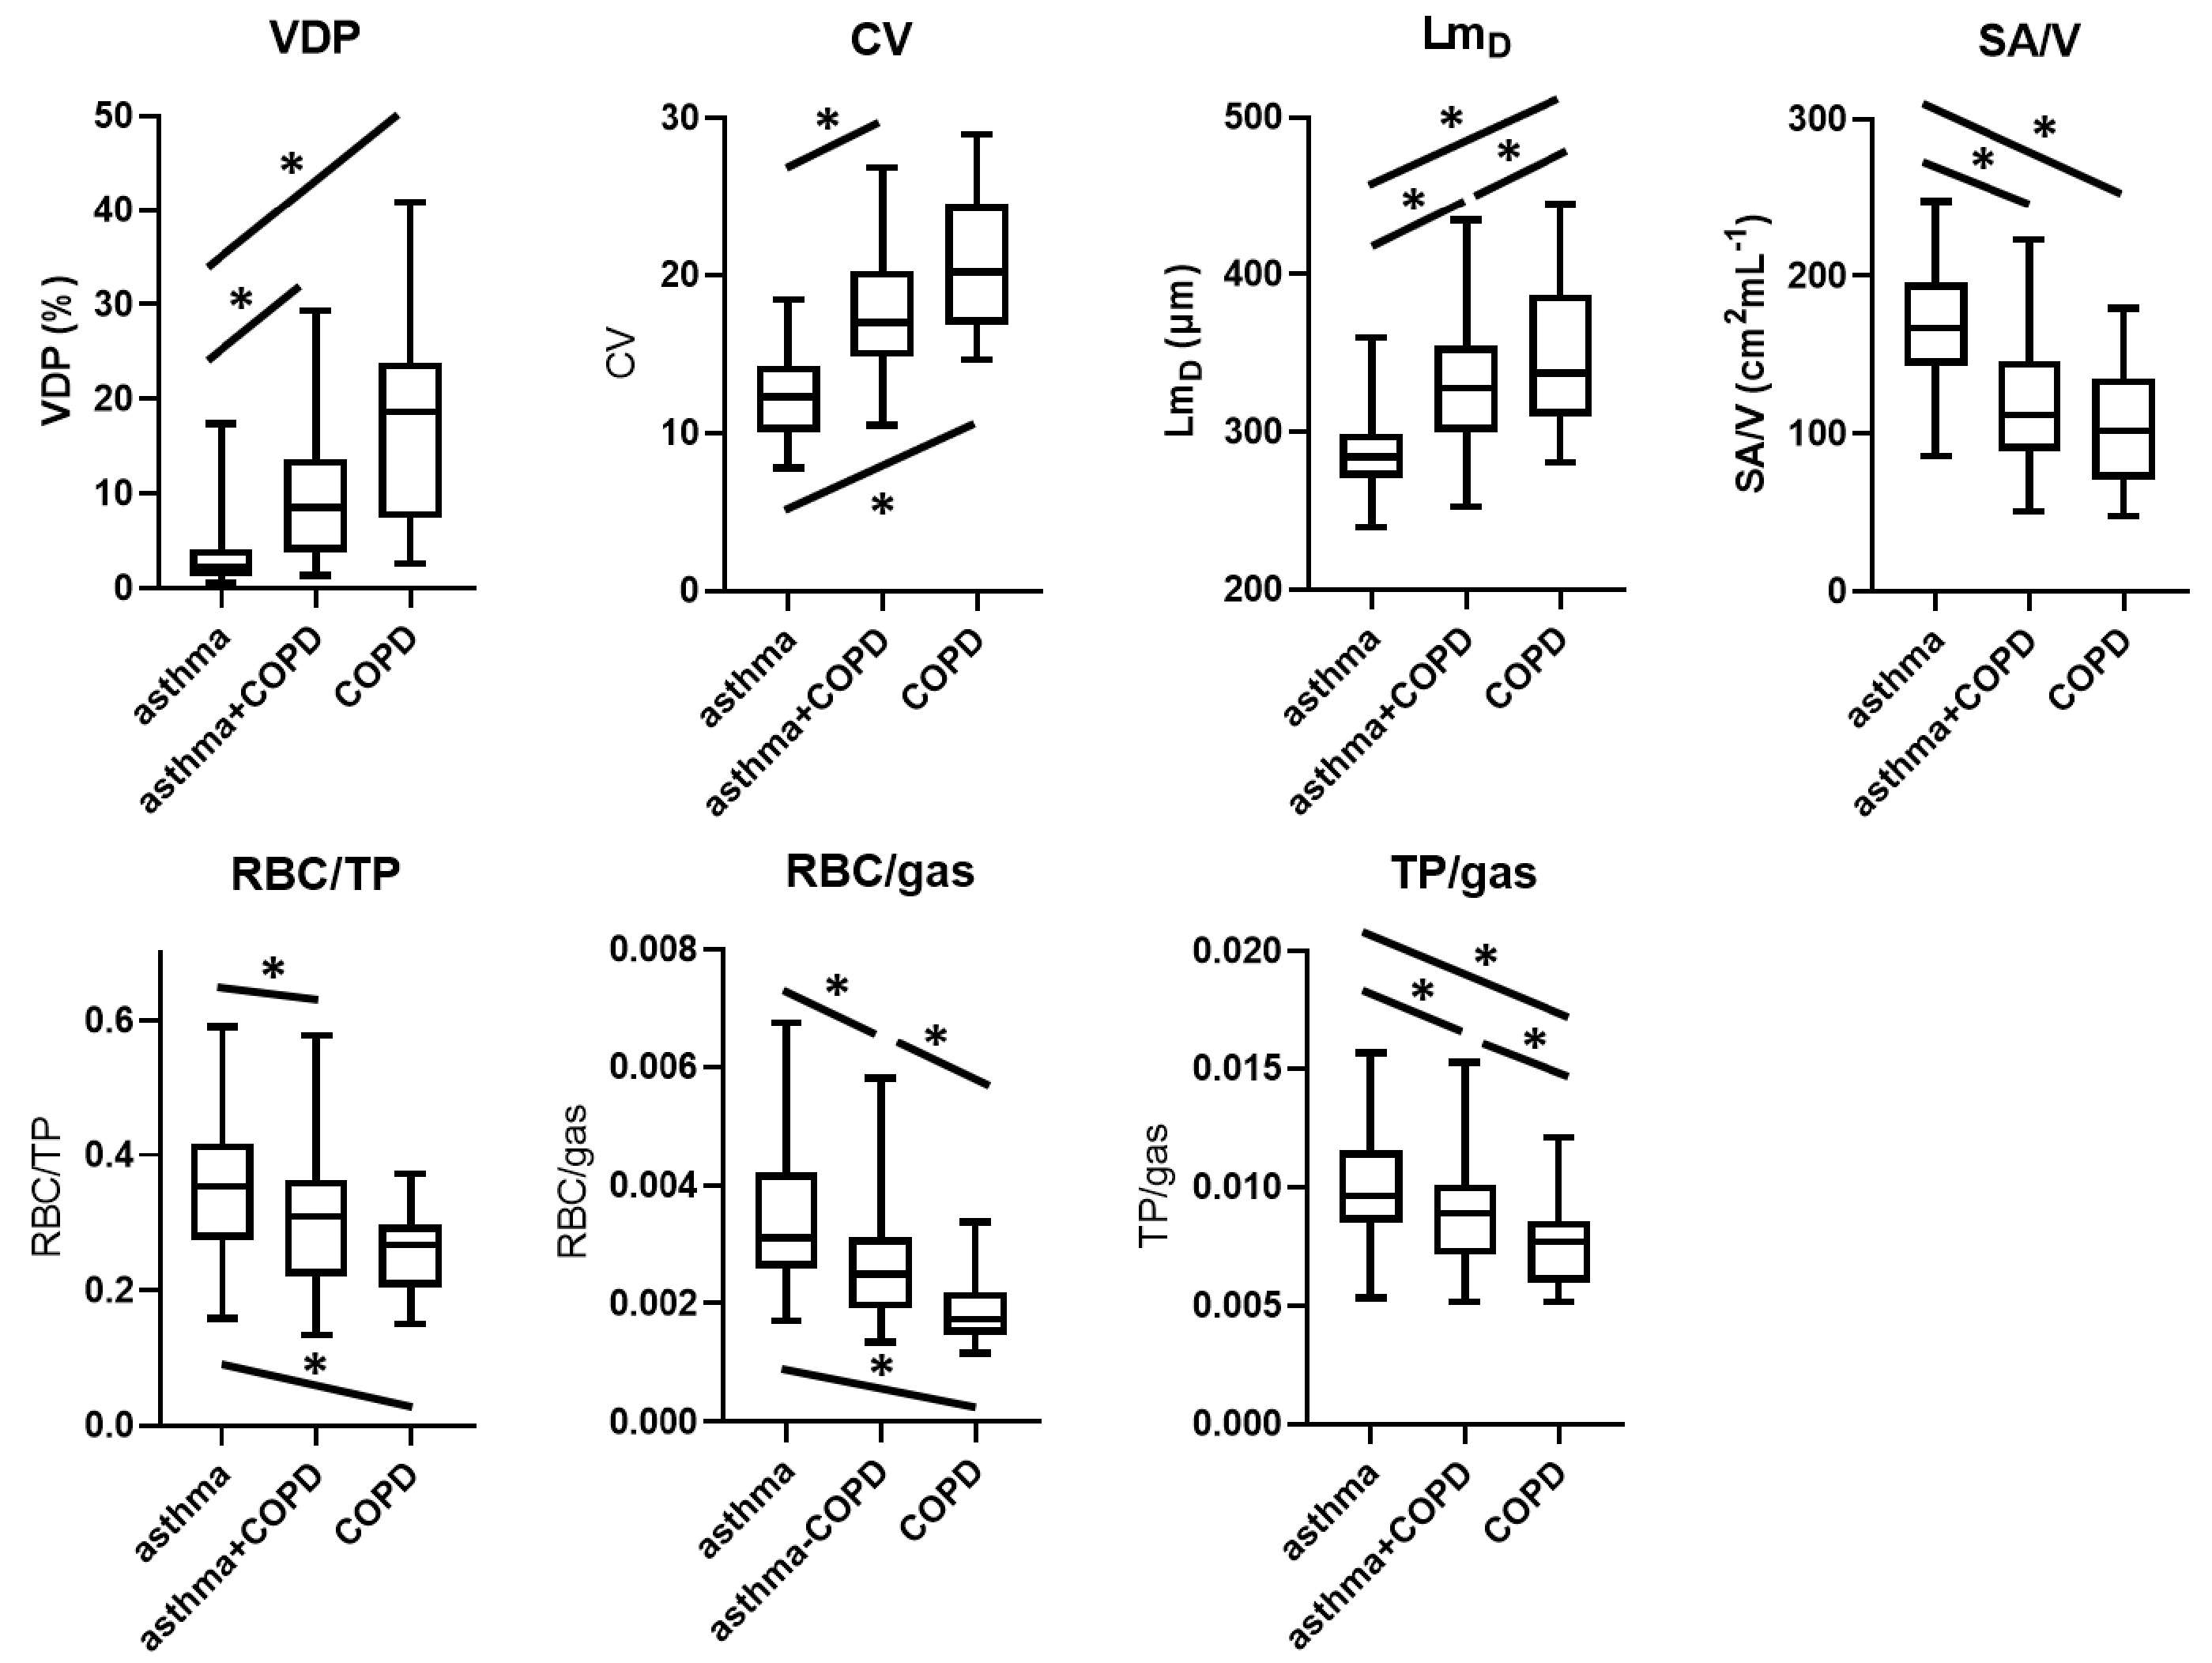
The following metrics were calculated: ventilation defect percentage11 (VDP), coefficient of variation of signal intensity12 (CV, a measure of ventilation heterogeneity within ventilated regions), mean diffusive length scale9 (LmD, a measure of acinar dimension), alveolar surface area to volume ratio13 (SA/V), ratio of 129Xe dissolved in blood to gaseous 129Xe in the airspaces (RBC/gas), ratio of 129Xe dissolved in lung tissue and plasma to gas (TP/gas), and RBC/TP (measures of alveolar gas exchange10). Diffusion and gas transfer images were segmented into anterior and posterior regions, peripheral and proximal regions, and superior, middle and inferior regions.
Patients were divided into three groups based on physician-assigned diagnosis; asthma, asthma+COPD and COPD. Kruskal-Wallis analysis assessed differences between groups and Spearman’s correlations were performed.
Results and Discussion
82 patients with asthma, 55 patients with asthma+COPD and 27 patients with COPD were assessed. 79% of patients had a normal FEV1 z-score and 53% had a normal FEV1/FVC z-score.Example images are shown in figure 1. Patients with asthma+COPD had greater ventilation heterogeneity (VDP and CV), increased acinar dimensions (LmD), reduced alveolar SA/V, reduced gas exchange (RBC/TP, RBC/gas) and reduced tissue uptake (TP/gas) compared to patients with asthma only. COPD patients had greater ventilation heterogeneity, lower alveolar SA/V and lower RBC/TP than patients with asthma. In COPD patients acinar airway dimensions were increased, gas exchange was reduced, and alveolar barrier contribution was reduced compared to both asthma patients and asthma+COPD patients (figure 2).
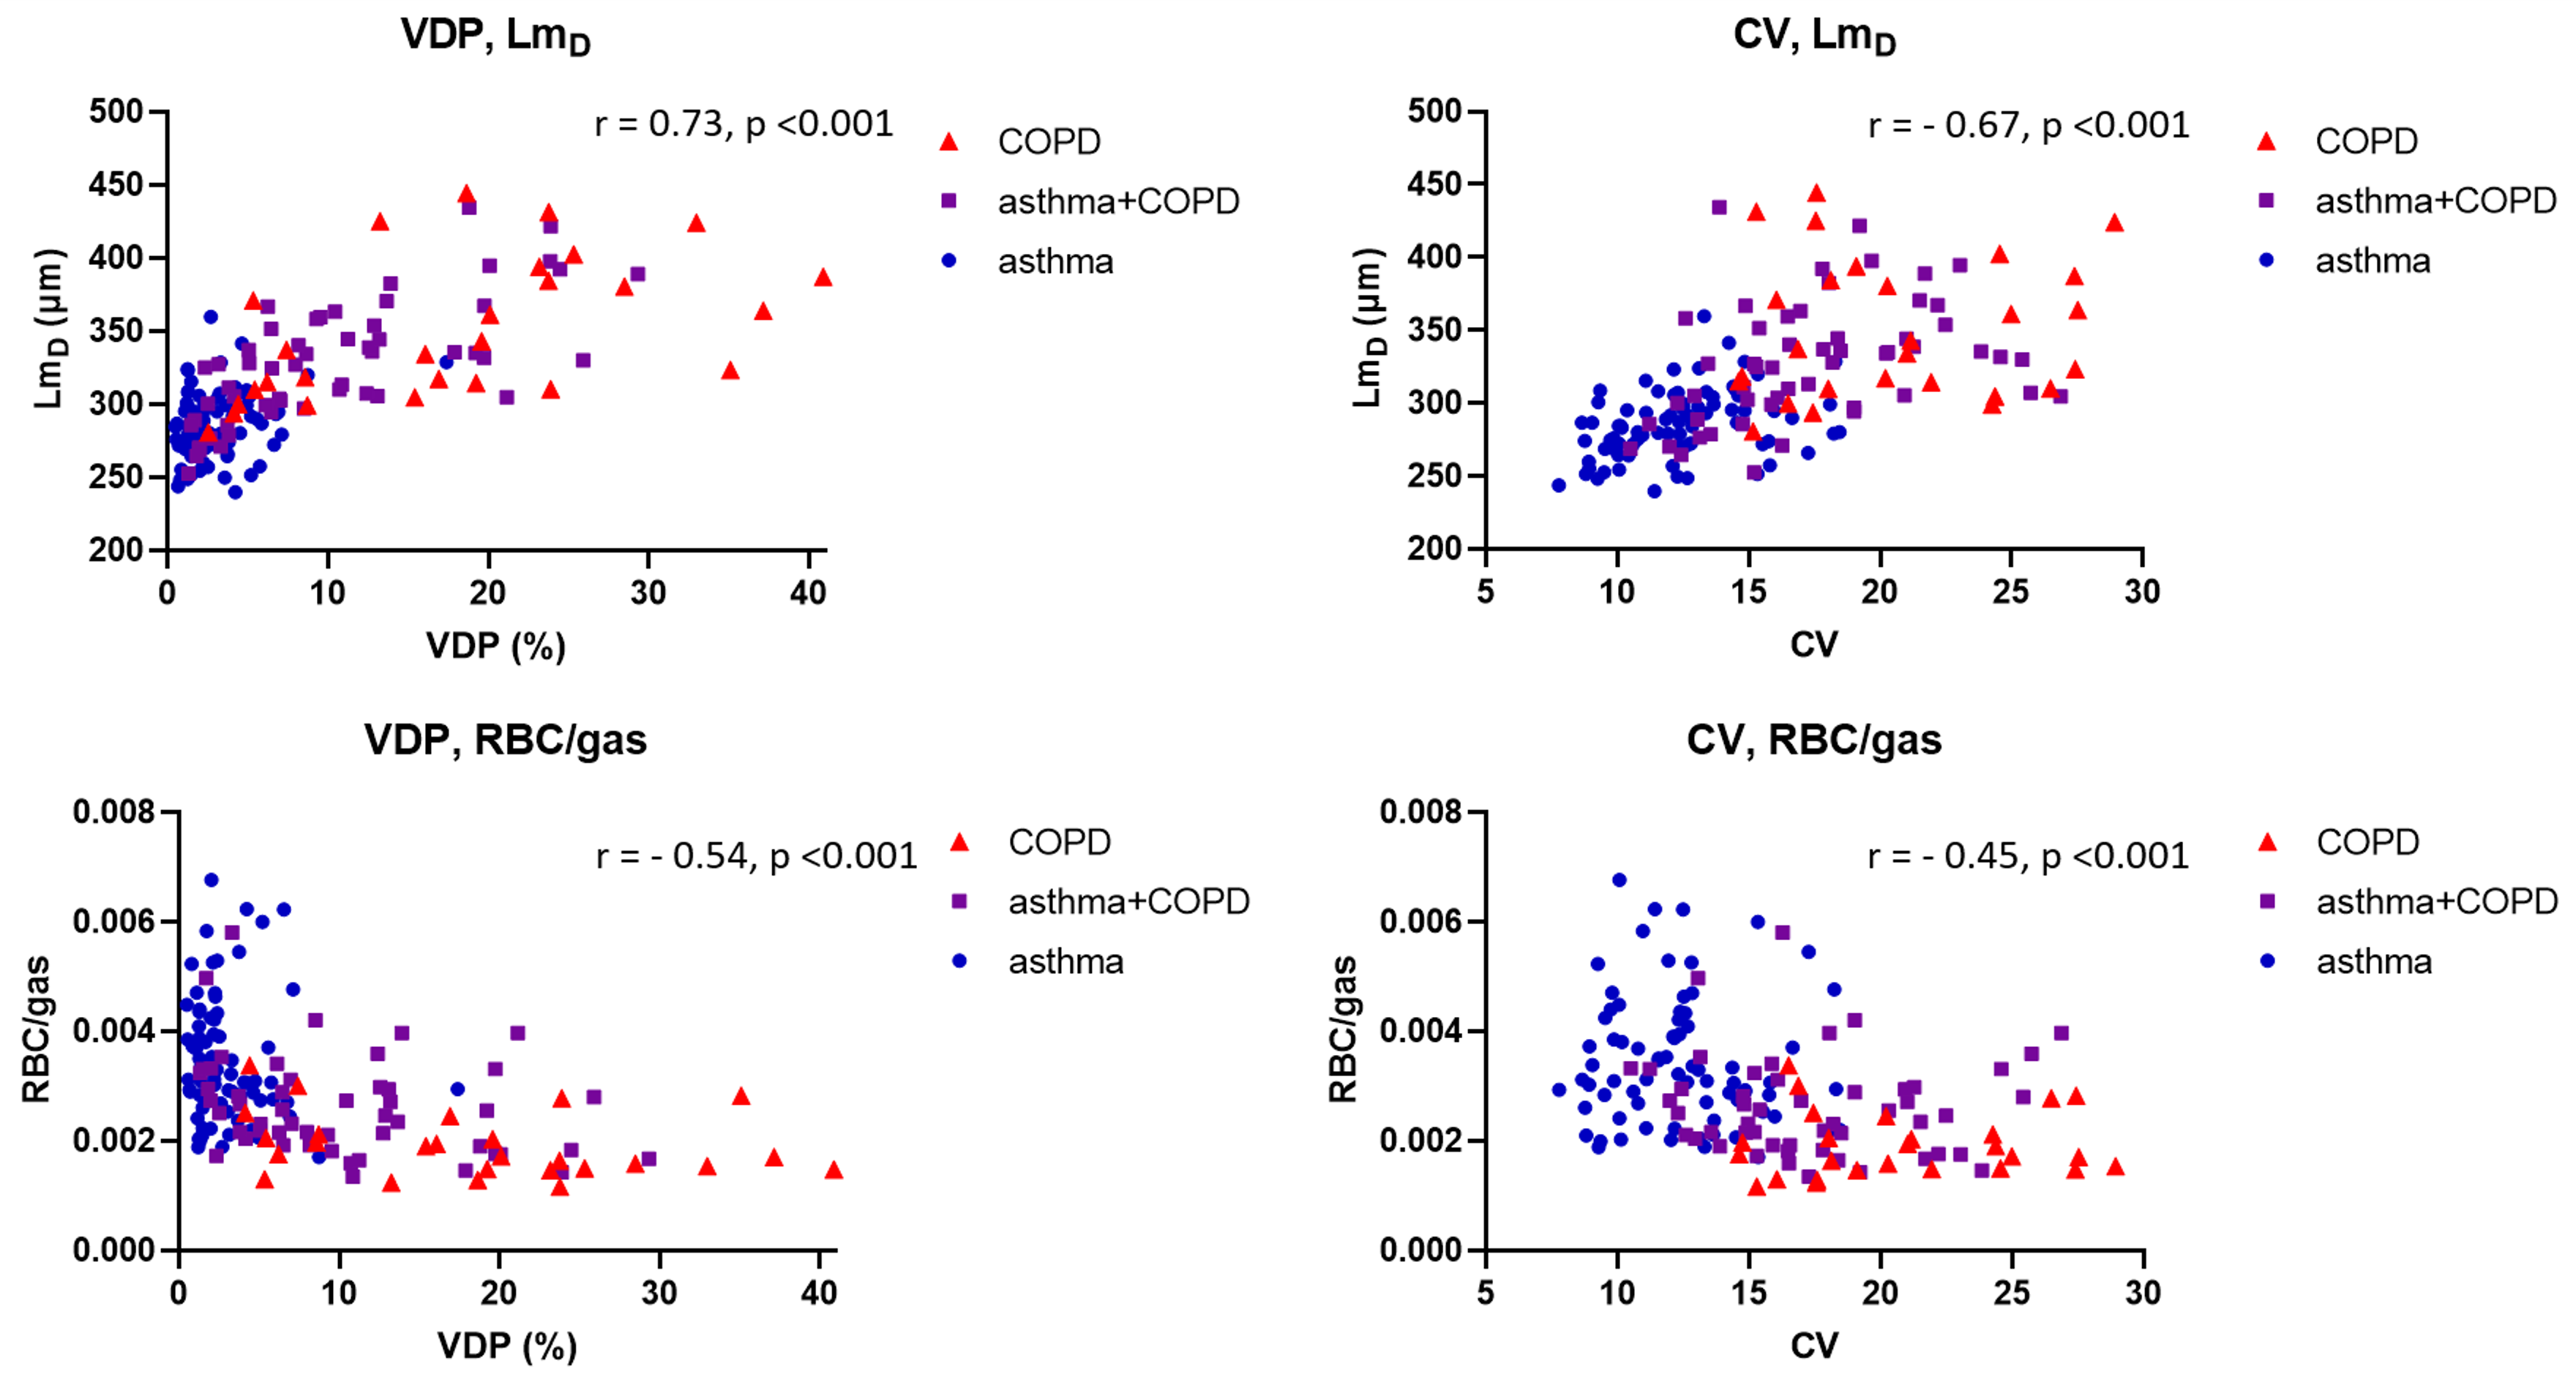
There were moderate-strong correlations between all 129Xe MRI metrics. XY plots of 129Xe MRI metrics (figures 3 and 4) showed they were able to distinguish asthma from COPD, suggesting that 129Xe MRI metrics could aid in the classification of patients with asthma+COPD into more asthma-like or more COPD-like disease, potentially guiding management.
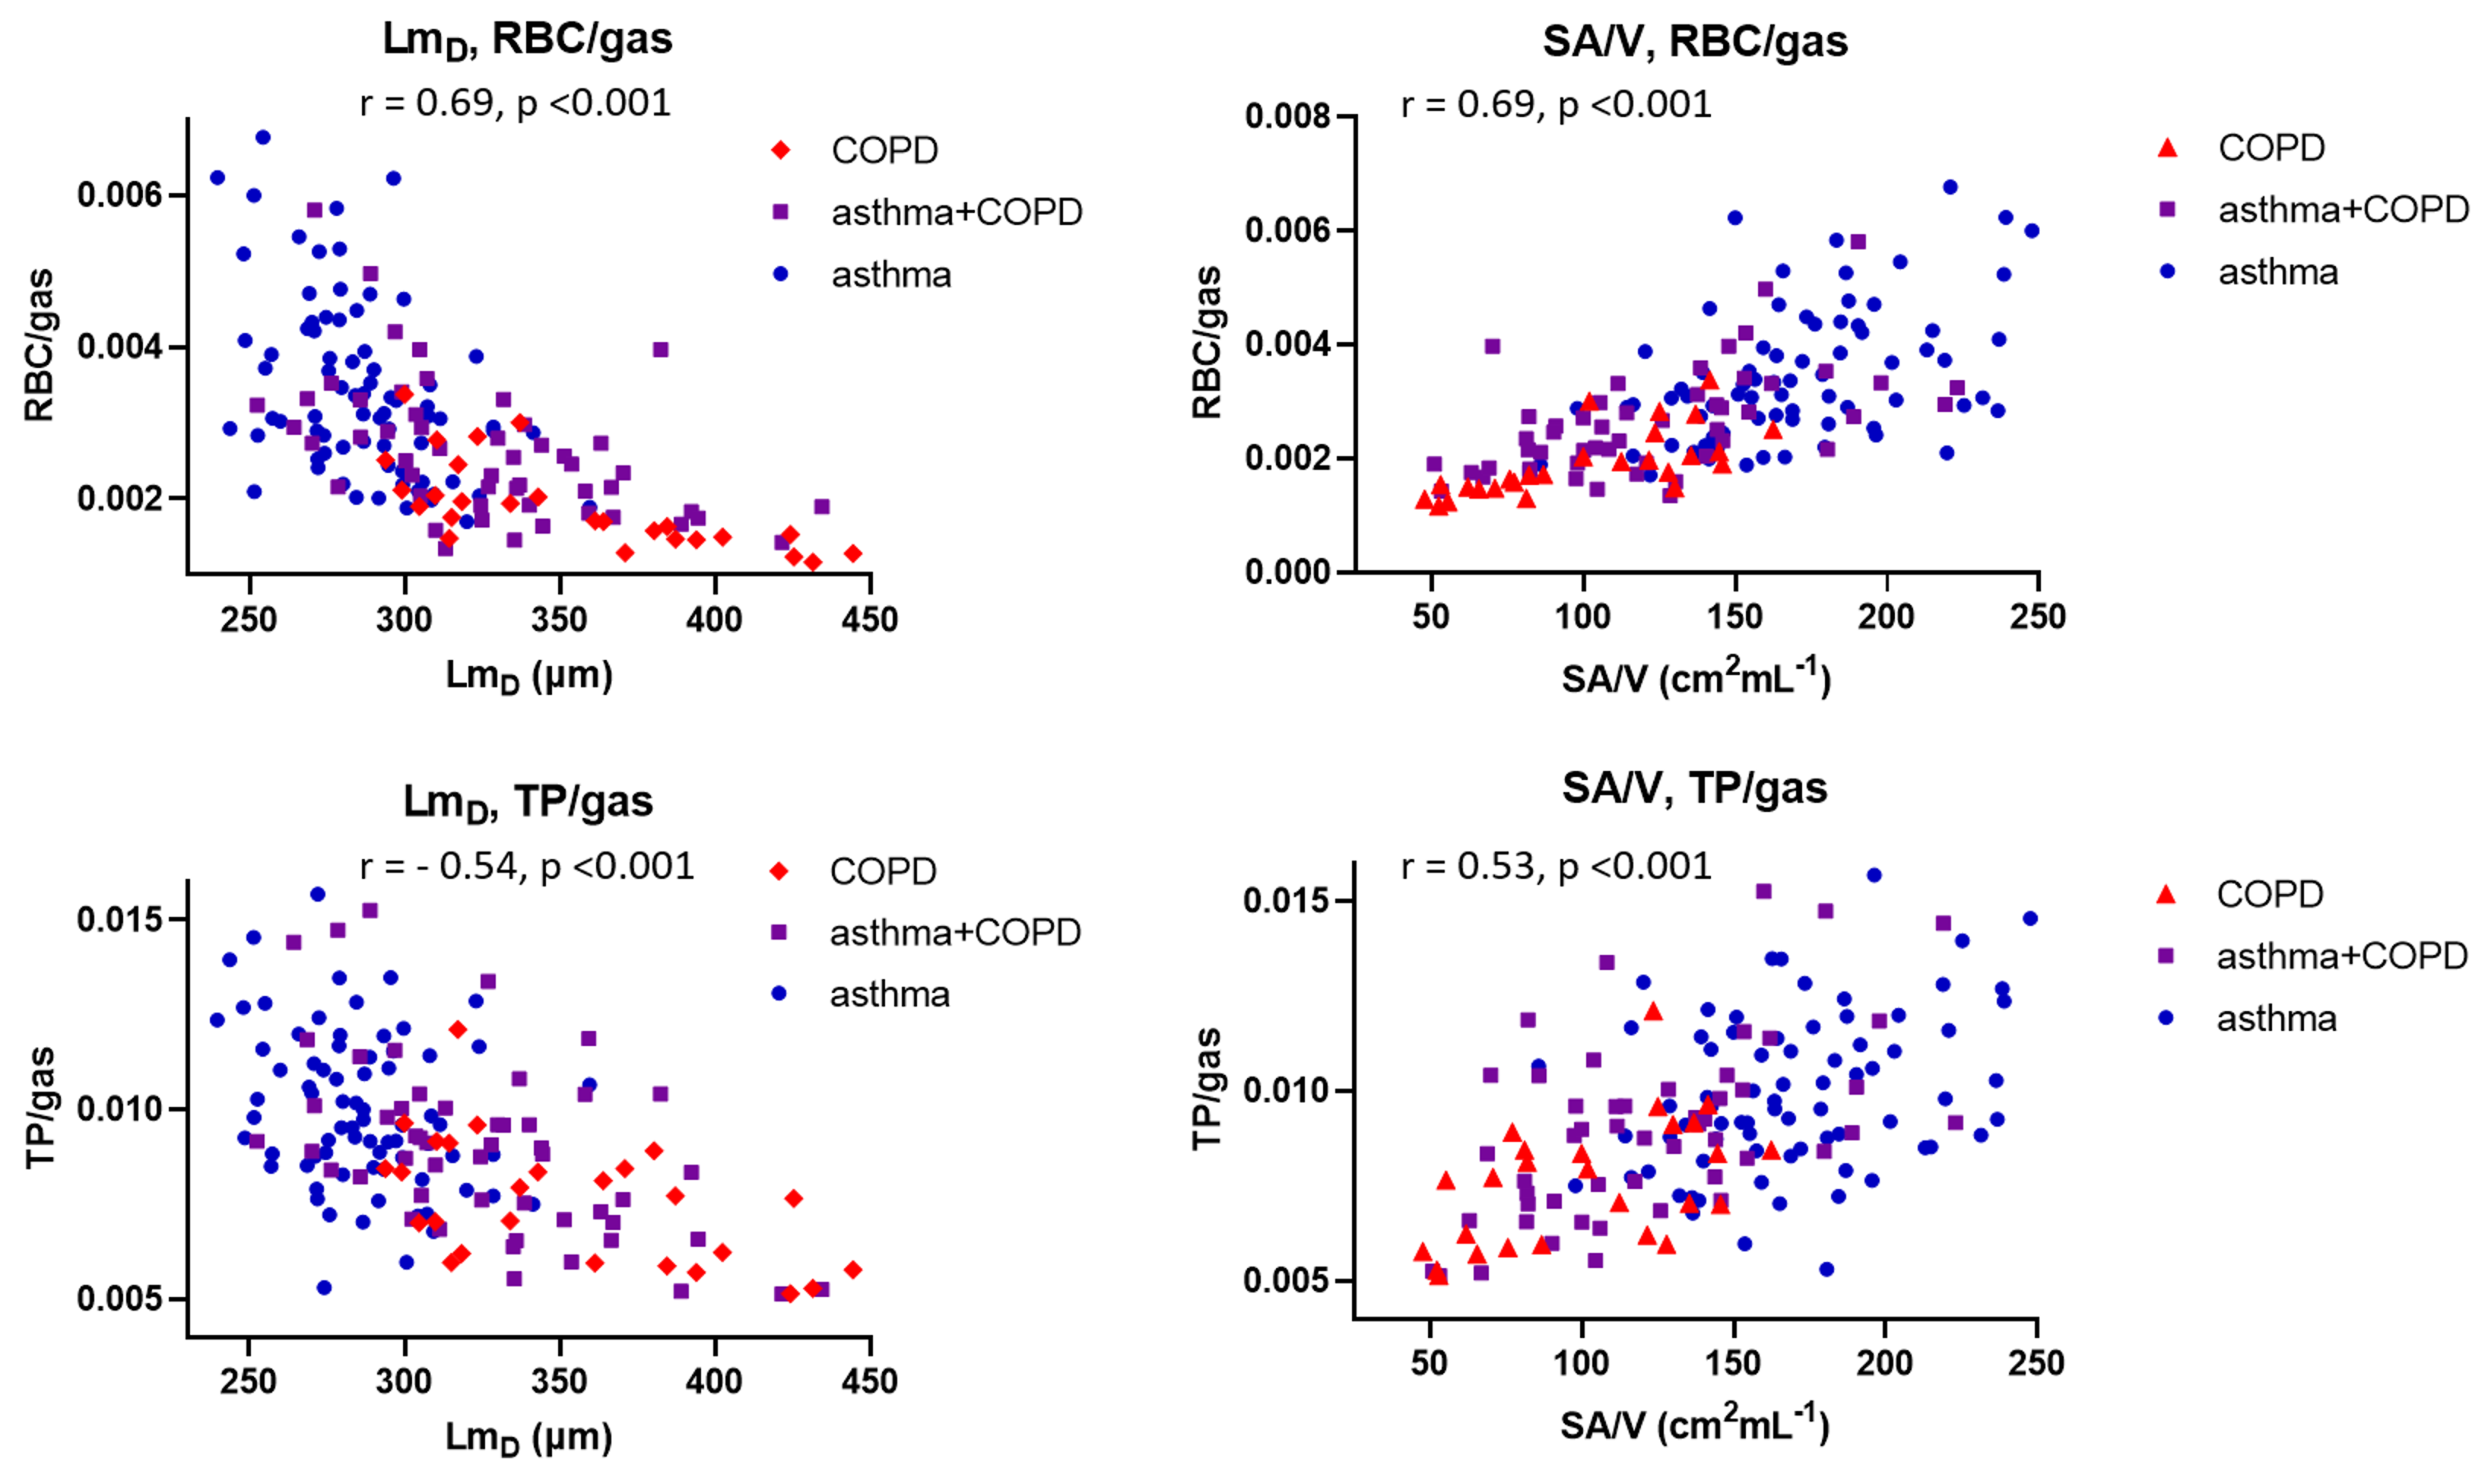
Plots of acinar microstructure and gas transfer metrics (figure 4) show the direct influence of lung microstructure on gas exchange. In patients with increased acinar dimensions the reduction in alveolar SA/V was associated with reduced signal contribution from the tissue-plasma component (TP/gas) and impaired transport of 129Xe into the blood (RBC/gas).
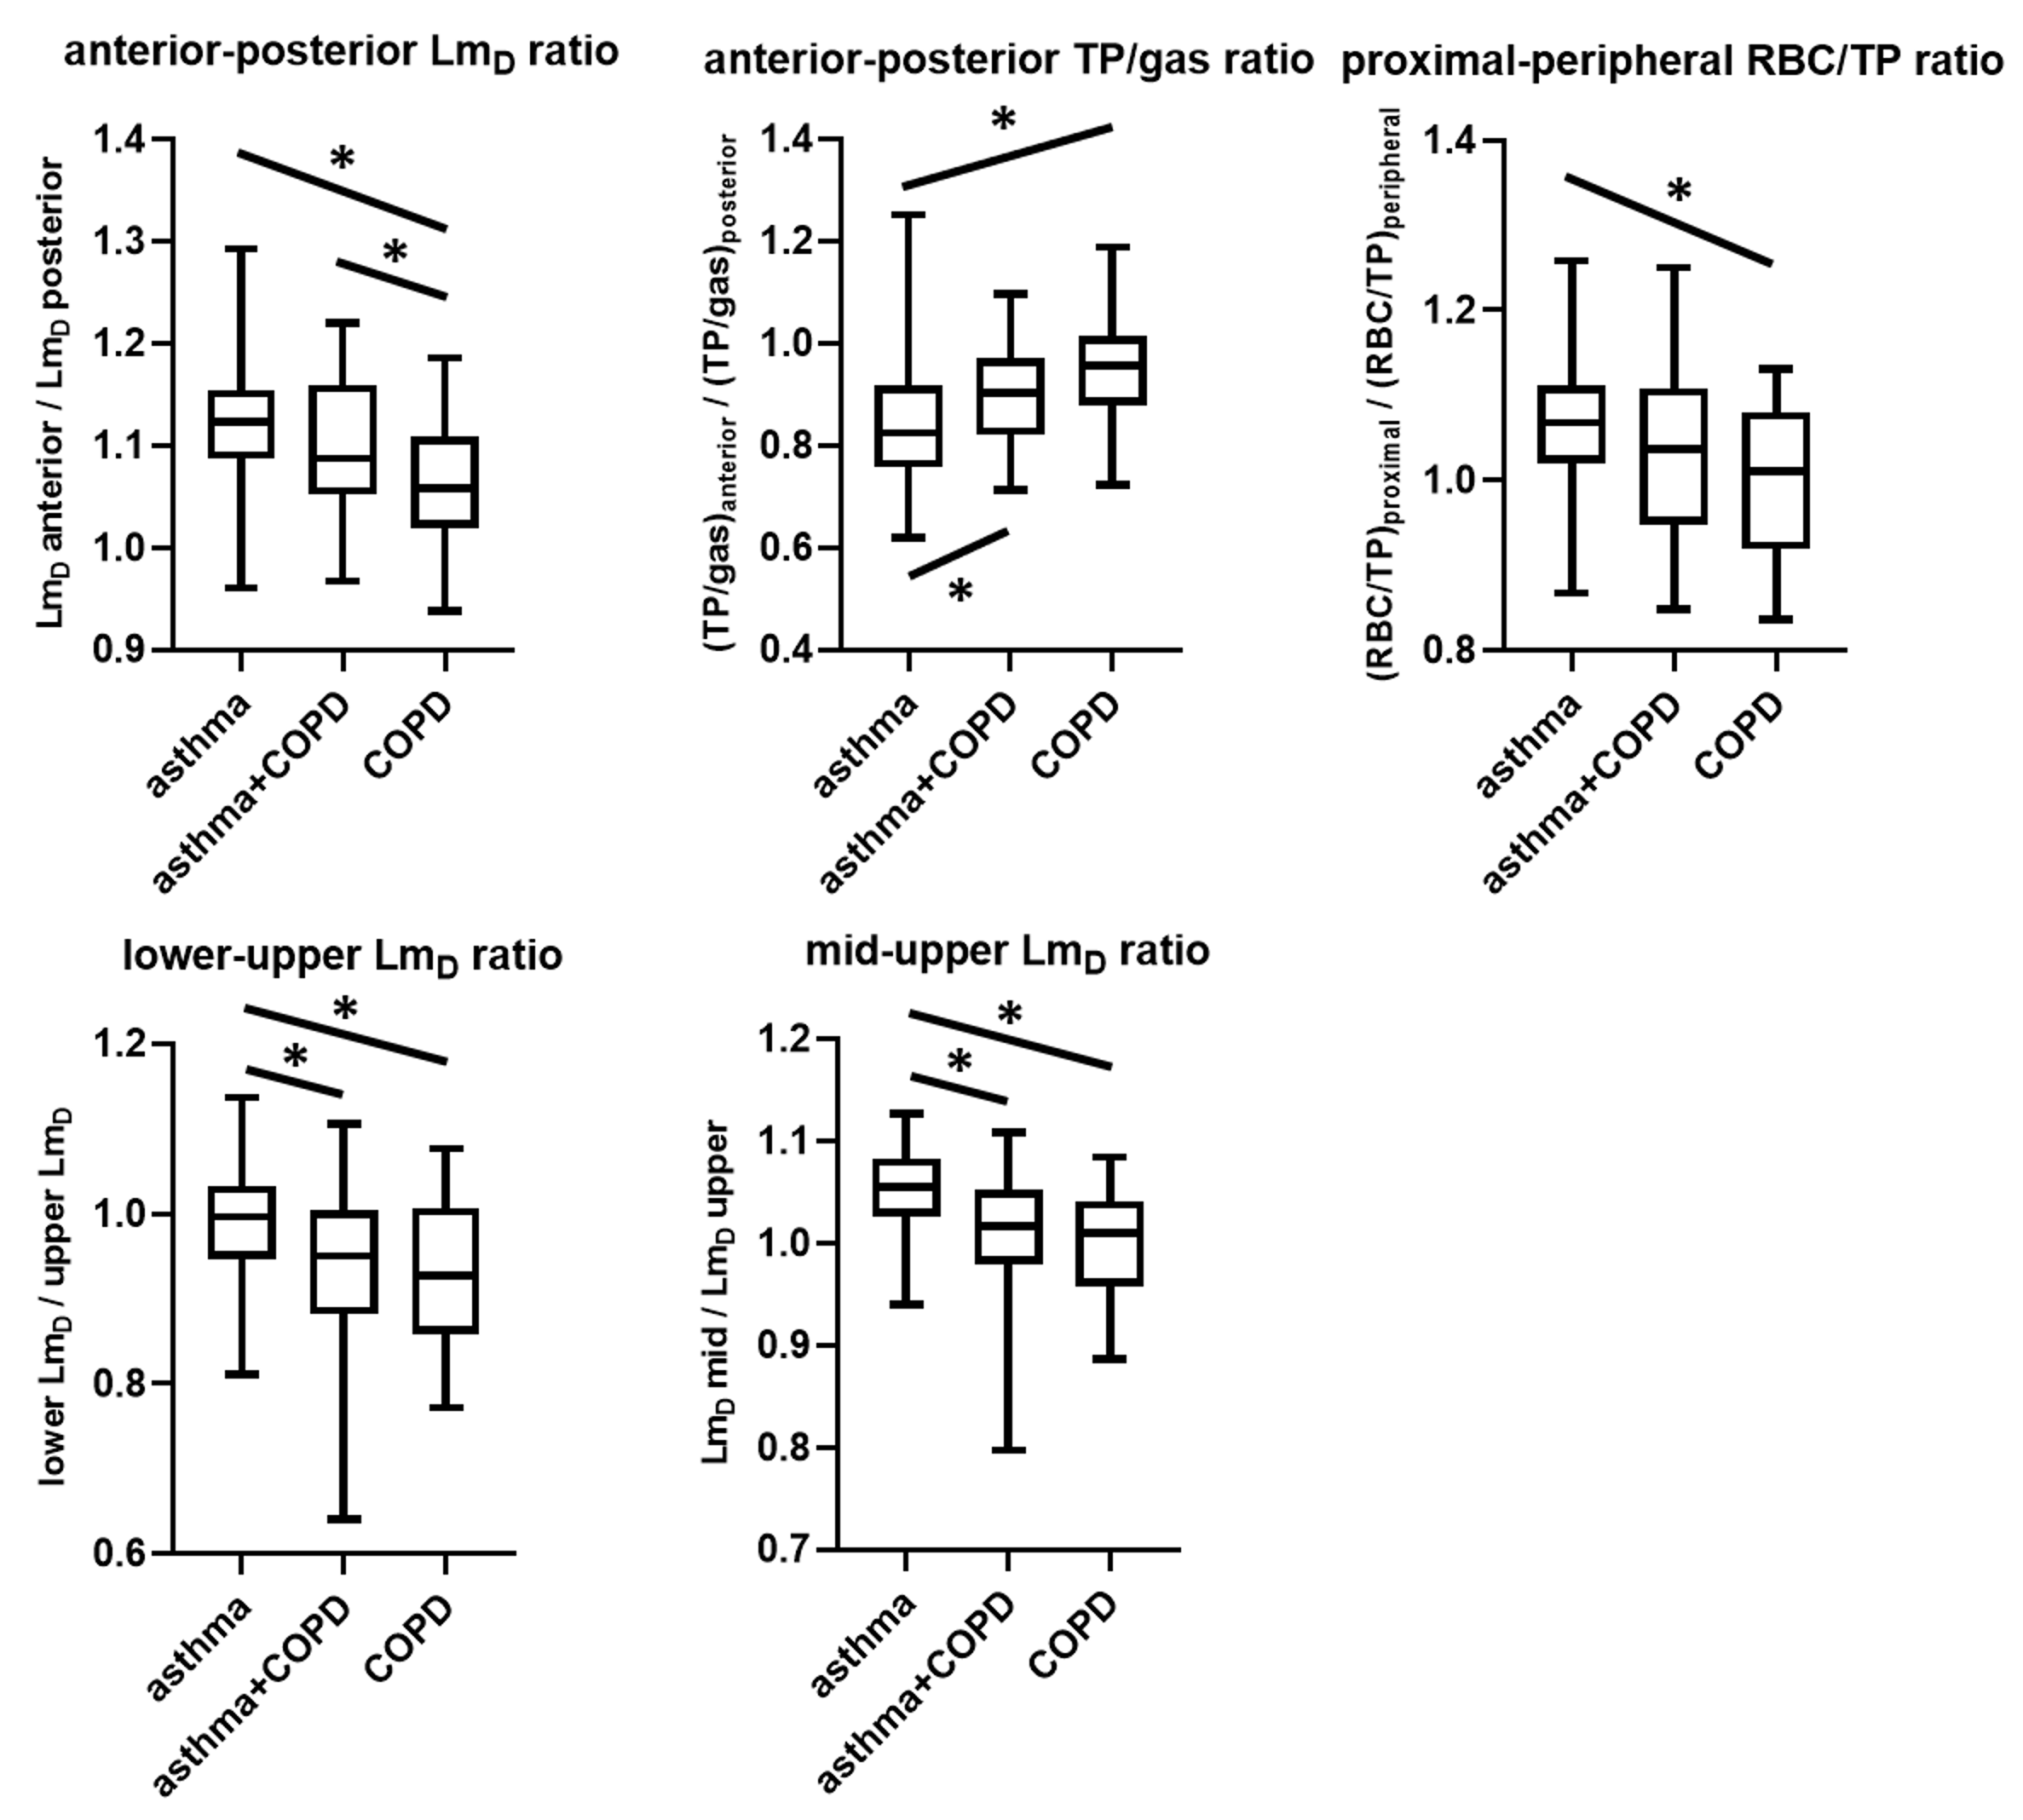
Regional analysis (figure 5) showed that anterior-posterior differences between LmD and TP/gas were more pronounced in asthma than COPD, reflecting normal tissue compression due to gravity in the supine posture in asthma, the gradient of which decreased in asthma+COPD and COPD. It has previously been reported that the anterior-posterior gradient of apparent diffusion coefficient was lower in COPD patients than healthy volunteers3.
The ratio of proximal RBC/TP to peripheral RBC/TP was greater in asthma patients than COPD patients. Proximal RBC/gas was previously found to be greater than peripheral RBC/gas in healthy volunteers10.
The ratios of lower/upper LmD, and middle/upper LmD, were reduced in asthma+COPD and COPD compared to asthma which is likely related to the upper-lobe predominance of emphysema in some patients with COPD. Elevated ADC in the upper lobes of patients with COPD has previously been reported3.
In patients with normal FEV1, ventilation defects were prevalent and ventilation MRI metrics showed significant differences between asthma (n=78) and asthma+COPD (n=37), and between asthma and COPD (n=10). In patients with normal TLco and normal Kco, MRI gas exchange (RBC/gas) was significantly reduced and acinar dimensions (LmD) were significantly enlarged in asthma+COPD (n=35) compared to asthma (n=67) and in COPD (n=10) compared to asthma.
To our knowledge this is the largest study with 129Xe MRI to date and the first to directly investigate patients with clinical features of both asthma and COPD.
Conclusion
Ventilation, acinar dimension and gas exchange 129Xe MRI metrics can aid in the differentiation of asthma from COPD. LmD, RBC/gas and TP/gas were significantly different between all diagnosis groups (asthma, asthma+COPD and COPD). Regional distributions of acinar dimensions and gas exchange were altered in patients with COPD and asthma+COPD compared to patients with asthma. 129Xe MRI metrics remained sensitive to diagnosis sub-groups when only patients with normal pulmonary function tests were considered.Acknowledgements
Study supported by AstraZenecaReferences
1 Svenningsen, S. et al. Hyperpolarized (3) He and (129) Xe MRI: differences in asthma before bronchodilation. J Magn Reson Imaging 38, 1521-1530, doi:10.1002/jmri.24111 (2013).
2 Kirby, M. et al. Hyperpolarized 3He and 129Xe MR imaging in healthy volunteers and patients with chronic obstructive pulmonary disease. Radiology 265, 600-610, doi:10.1148/radiol.12120485 (2012).
3 Kaushik, S. S. et al. Diffusion-weighted hyperpolarized 129Xe MRI in healthy volunteers and subjects with chronic obstructive pulmonary disease. Magn Reson Med 65, 1154-1165, doi:10.1002/mrm.22697 (2011).
4 Qing, K. et al. Regional mapping of gas uptake by blood and tissue in the human lung using hyperpolarized xenon-129 MRI. J Magn Reson Imaging 39, 346-359, doi:10.1002/jmri.24181 (2014). 5 Kauppi, P. et al. Overlap syndrome of asthma and COPD predicts low quality of life. J Asthma 48, 279-285, doi:10.3109/02770903.2011.555576 (2011).
6 Andersen, H., Lampela, P., Nevanlinna, A., Saynajakangas, O. & Keistinen, T. High hospital burden in overlap syndrome of asthma and COPD. Clin Respir J 7, 342-346, doi:10.1111/crj.12013 (2013).
7 Reddel, H. K. et al. Prospective observational study in patients with obstructive lung disease: NOVELTY design. ERJ Open Res 5, doi:10.1183/23120541.00036-2018 (2019).
8 Stewart, N. J., Norquay, G., Griffiths, P. D. & Wild, J. M. Feasibility of human lung ventilation imaging using highly polarized naturally abundant xenon and optimized three-dimensional steady-state free precession. Magn Reson Med 74, 346-352, doi:10.1002/mrm.25732 (2015).
9 Chan, H. F., Stewart, N. J., Norquay, G., Collier, G. J. & Wild, J. M. 3D diffusion-weighted (129) Xe MRI for whole lung morphometry. Magn Reson Med 79, 2986-2995, doi:10.1002/mrm.26960 (2018).
10 Collier, G. J. et al. Dissolved (129) Xe lung MRI with four-echo 3D radial spectroscopic imaging: Quantification of regional gas transfer in idiopathic pulmonary fibrosis. Magn Reson Med 85, 2622-2633, doi:10.1002/mrm.28609 (2021).
11 Collier, G. J., Acunzo, L. & Smith, L. in International Society for Magnetic Resonance in Medicine 2018. 4482.
12 Hughes, P. J. C. et al. Assessment of the influence of lung inflation state on the quantitative parameters derived from hyperpolarized gas lung ventilation MRI in healthy volunteers. J Appl Physiol (1985) 126, 183-192, doi:10.1152/japplphysiol.00464.2018 (2019).
13 Yablonskiy, D. A. et al. Quantification of lung microstructure with hyperpolarized 3He diffusion MRI. J Appl Physiol (1985) 107, 1258-1265, doi:10.1152/japplphysiol.00386.2009 (2009).
Figures