1160
Denoising Diffusion MRI with Self-supervised Learning on Coresets via Matrix Sketching1Indiana University Bloomington, Bloomington, IN, United States, 2Purdue University, West Lafayette, IN, United States
Synopsis
Diffusion MRI typically has a low SNR on account of the noise from a variety of sources corrupting the data. The state-of-the-art denoiser Patch2Self proposed a self-supervised learning technique that uses patches from all the voxels to learn the denoising function which in practice can be resource-intensive. We, therefore, propose Patch2Self2 which performs self-supervised denoising using coresets constructed via matrix sketching, resulting in significant speedups and reduced memory usage. Our results showed that sampling-based sketching via leverage scores gave the best performance. Remarkably, leverage scores can be directly used as a statistic for interpreting influential regions hampering the denoising performance.
Introduction
Patch2Self (P2S)1 is a recently proposed self-supervised denoiser that suppresses different types of noise beyond thermal fluctuations giving a state-of-the-art performance. The increasing size and dimensionality of higher resolution dMRI acquisitions can make P2S infeasible for large-scale analyses. This work exploits the redundancy imposed by P2S to alleviate its performance issues and inspect regions that influence the noise disproportionately. This work makes a two-fold contribution: 1) We present Patch2Self2 (P2S2), a method that uses matrix sketching to perform self-supervised denoising. By solving a sub-problem on a smaller sub-space, so-called, coreset, we show how P2S2 can yield a significant speedup in training time while using less memory. 2) We show how the so-called statistical leverage scores can be used to interpret the denoising of dMRI data. Our experiments are conducted on simulated and real data and clearly demonstrate that P2S2 does not lead to any loss in denoising quality while providing significant speedup and improved memory usage by training on a small fraction of the data. We also quantify the effect of different sketch sizes on the denoising speed and accuracy of the approximate solution (w̃) in comparison with the P2S solution (w*).Methods
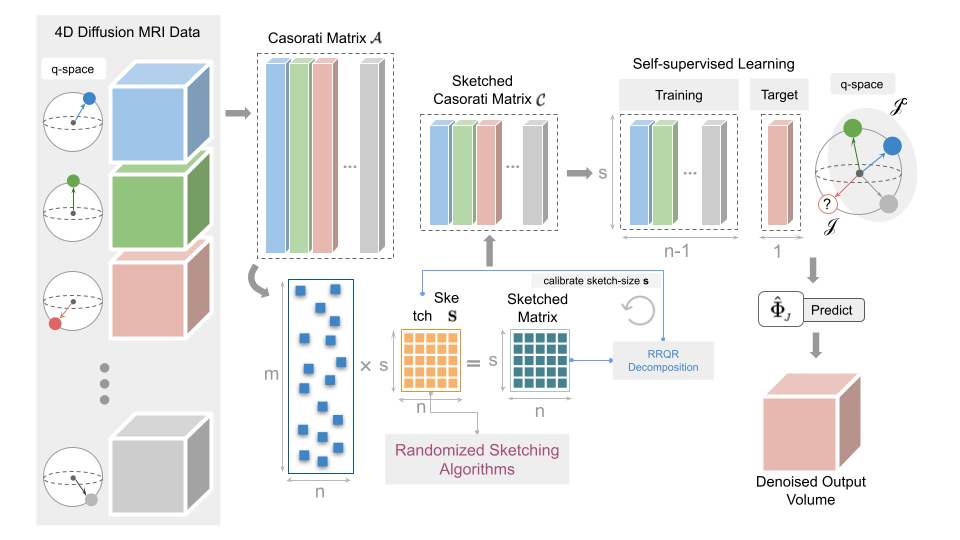
In the case of P2S, the J-invariant denoiser setup via the Casorati matrix is massively overconstrained, and has an added time complexity, since the regression is performed ‘d’ times given that each volume needs to be separately denoised. P2S indirectly imposes compressibility when representing each 3D volume as a combination of the remaining volumes. We exploit this by using matrix sketching to generate subspace embeddings for training Patch2Self. Matrix sketching does not hamper the J-invariance theorem1 assumption of P2S. In dMRI, we have ‘d’ a number of 3D volumes each with dimensionality: l×w×h. Each of the volumes is flattened to a 1D array (n=l×w×h) to form a column of the Casorati matrix A ∈ Rn×d. Next, we sketch this matrix A using the sketching matrix S (∈ Rs×n) to get a sketched Casorati matrix C=SA. We perform self-supervised denoising on this sketched matrix C by solving the sub-problem: minw̃‖C−jw̃−Cj‖2. The key idea here is to solve a sub-problem w̃= argminw̃‖SA−jw̃−SAj‖2 such that ‖A-jw̃-Aj‖2 ≤ (1+eps)‖A−jw*−Aj‖2, where eps is the desired level of accuracy and S∈Rs×n with d≈s<<n is the so-called sketching matrix (See Fig. 1). To construct a suitable sketching matrix S, we explore 3 different matrix sketching strategies: Subsampled Randomized Fourier Transform9, CountSketch8 and Leverage Scores10. Leverage scores are a univariate statistic. When two rows of A have identical or similar leverage scores, it implies that the rows are highly correlated and therefore redundant in the construction of the sketched Casorati matrix C. Therefore P2S2 employs the Rank Revealing QR (RRQR) factorization, to flag such redundancies by ranking the rows of the matrix in order of independence.Results (Simulated and Real Data)
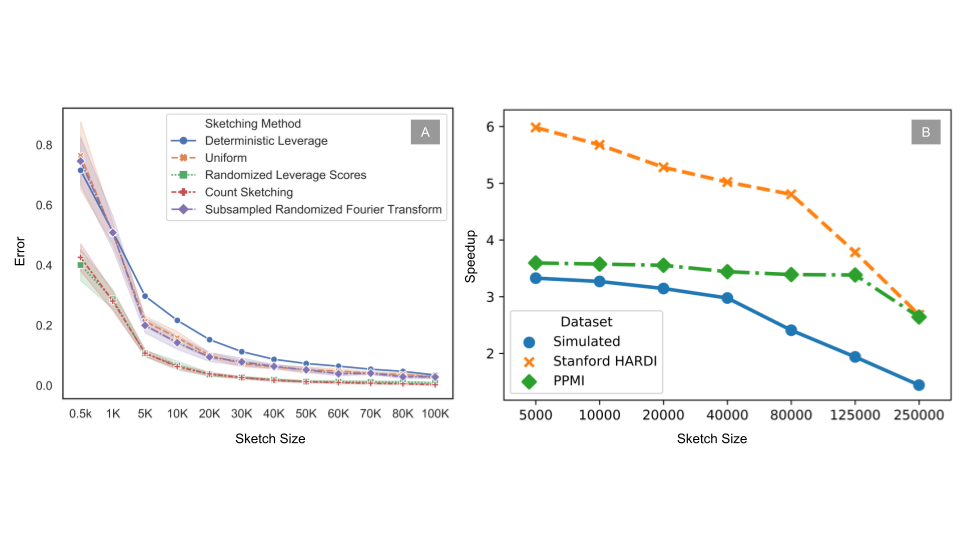
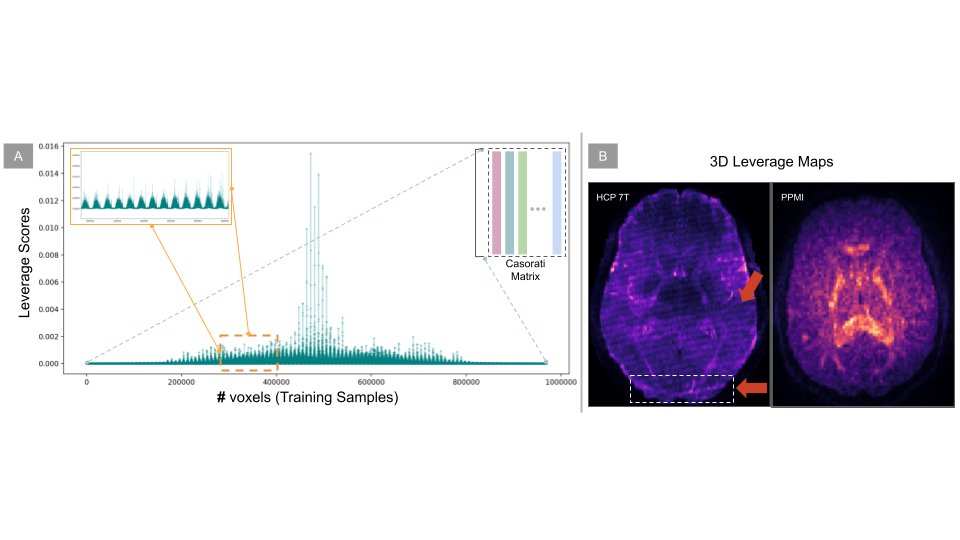
In order to compare the effect of the sketch size on the denoising performance, we compared different sketching methods such as SRFT9, CountSketch8, deterministic and randomized leverage scores10 against random sampling by iteratively increasing the sketch size. The experiment was also repeated 10 times (with 95% CI) to capture the variability of the sketch-and-solve mechanism on a control subject from the PPMI7. As Fig. 2A shows, the variability reduces with an increase in sketch size and leverage score sampling outperforms other sketching methods. In Fig. 3, we also show the leverage score maps and plot for the PPMI7 and HCP 7T6 data. The 3D leverage score maps in Fig. 3B show the influence of the different areas on Patch2Self2 denoiser. Leverage scores can be used as a much more correlation driven measure of the noise and artefacts in the data as opposed to the standard deviation proposed in MPPCA2 which is a coarser measure. We compared the performance of P2S2 with P2S on simulated data that contained 62 gradient directions (2 b0s, 30 gradient directions with b-value 1000 and 2000 each) with noise added to the real and imaginary part of each channel4. In Fig. 4 we show that the P2S2 performs as well as P2S. We computed the RMSE and R2 statistic between the ground truth and the denoised signal for P2S and P2S2 as shown in Tab. 1 evaluated at SNRs 10 to 25. We compare the denoising performance of P2S with P2S2 qualitatively on HCP 7T data. We see in Fig. 5A that the nature of the residuals and denoising performance are very similar to one another. We also compare P2S and P2S2 on DKI11 fitting and on HCP 7T data via mean and radial kurtosis as shown in Fig. 5B. With Fiber-to-Bundle12 coherence quantification in Fig. 5C, we show that the coherent tracks are preserved both by P2S and P2S2. With simulated and real data we show increased speedup with dimensionality in Fig. 2B.Discussion
Patch2Self2 proposed the use of matrix sketching as a tool for speeding up and alleviating memory issues in deploying denoisers, specifically Patch2Self. It will be made available to the community via DIPY5 along with a separate module for sketching mechanisms such as SRFT, CountSketch and Leverage Scores.Acknowledgements
No acknowledgement found.References
[1] Fadnavis, Shreyas, Joshua Batson, and Eleftherios Garyfallidis. "Patch2Self: Denoising Diffusion MRI with Self-Supervised Learning." Advances in Neural Information Processing Systems 33 (2020).
[2] Veraart, Jelle, et al. "Denoising of diffusion MRI using random matrix theory." Neuroimage 142 (2016): 394-406.
[3] Gu, Ming, and Stanley C. Eisenstat. "Efficient algorithms for computing a strong rank-revealing QR factorization." SIAM Journal on Scientific Computing 17.4 (1996): 848-869.
[4] Graham, Mark S., Ivana Drobnjak, and Hui Zhang. "Realistic simulation of artefacts in diffusion MRI for validating post-processing correction techniques." NeuroImage 125 (2016): 1079-1094.
[5] Garyfallidis, Eleftherios, et al. "Dipy, a library for the analysis of diffusion MRI data." Frontiers in neuroinformatics 8 (2014): 8.
[6] Van Essen, David C., et al. "The Human Connectome Project: a data acquisition perspective." Neuroimage 62.4 (2012): 2222-2231.
[7] Marek, Kenneth, et al. "The Parkinson progression marker initiative (PPMI)." Progress in neurobiology 95.4 (2011): 629-635.
[8] Clarkson, Kenneth L., and David P. Woodruff. "Low-rank approximation and regression in input sparsity time." Journal of the ACM (JACM) 63.6 (2017): 1-45.
[9] Drineas, Petros, et al. "Faster least squares approximation." Numerische mathematik 117.2 (2011): 219-249.
[10] Drineas, Petros, Michael W. Mahoney, and Shan Muthukrishnan. "Sampling algorithms for l 2 regression and applications." Proceedings of the seventeenth annual ACM-SIAM symposium on Discrete algorithm. 2006.
[11] Jensen, Jens H., and Joseph A. Helpern. "MRI quantification of non‐Gaussian water diffusion by kurtosis analysis." NMR in Biomedicine 23.7 (2010): 698-710.
[12] Portegies, Jorg M., et al. "Improving fiber alignment in HARDI by combining contextual PDE flow with constrained spherical deconvolution." PloS one 10.10 (2015): e0138122.
Figures
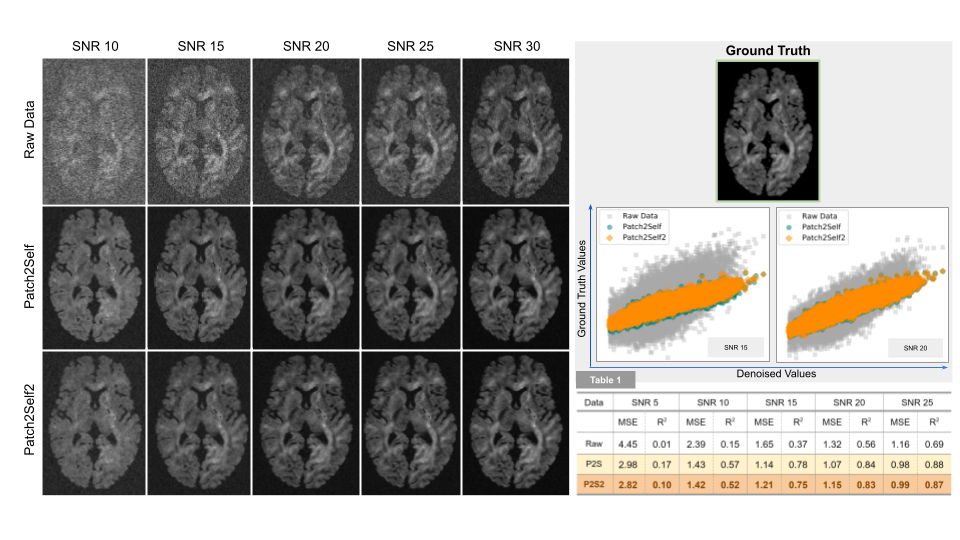
Shows a qualitative comparison of denoising performance between P2S and P2S2 (trained on 20K samples, i.e. 7% of the data). P2S2 closely approximates P2S via scatter plots at SNRs 15&20. Table. 1: Quantitative comparison of Raw, P2S and P2S2 denoised data via MSE and R2 metrics.
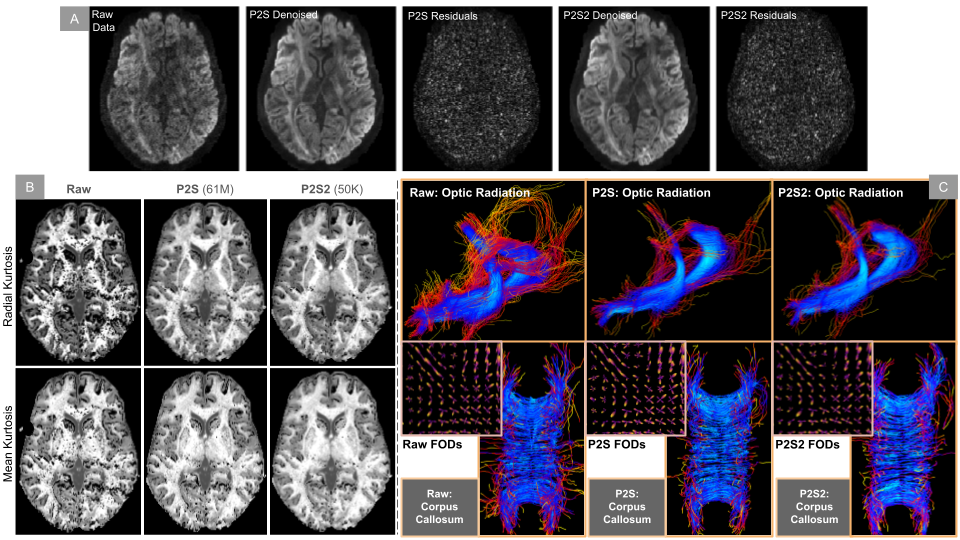
(A) Shows the residual maps computed after denoising the same subject via P2S and P2S2. Note that both show very similar noise suppression resulting in approximately the same denoised data and residual maps. (B) Quantifies the effect of P2S and P2S2 denoising on HCP 7T data modeled using DKI. Derived Radial Kurtosis and Mean Kurtosis metrics are shown for both P2S and P2S2. (C) We compare the performance via fiber-to-bundle coherence quantification of the optic radiation and corpus callosum bundles. Also shows a cross-section of underlying spherical harmonic representations (FODs).