1156
Predicting isocitrate dehydrogenase mutation status using contrastive learning and graph neural networks1Department of Clinical Neurosciences, University of Cambridge, Cambridge, United Kingdom
Synopsis
The isocitrate dehydrogenase (IDH) gene mutation status is a prognostic biomarker for gliomas. As an alternative approach to the invasive gold standard of IDH mutation detection, radiogenomics approaches using features of MRI showed promising results in the same task. Here, we proposed an approach to predict the IDH status based on the image and morphology features extracted using contrastive learning. We then constructed a large patient graph based on the extracted features, which could predict the IDH mutation using graph neural networks. The results showed the proposed method outperforms the classifiers which leverage either image or morphology features only.
Introduction
The mutation status of isocitrate dehydrogenase (IDH) gene is an important prognostic biomarker for glioma patients established by the World Health Organization1. Patients with IDH mutation generally have longer survival than patients with IDH wild-types. However, assessing IDH mutation status currently relies on the tumor tissue obtained using invasive approaches1.Recent radiogenomics studies showed that MRI could be used to predict the IDH mutation status 2. In addition to conventional texture and intensity features, morphology could provide useful information for characterizing tumor genotype3. In parallel, deep learning has shown promising performance to predict IDH status using convolutional neural networks (CNNs) based on MRI4. Moreover, recent development of graph neural networks (GNNs) showed state-of-the-art performance in geometric learning, which could potentially be leveraged to effectively extract morphology-based features from gliomas5. Particularly , GNNs also show excellent performance in classification tasks where patients are treated as nodes of the graph and edges describe their similarities6.
In this study, we hypothesized that integrating tumor image and morphology using deep learning models could better characterize glioma patients. First, we extracted imaging features using a contrastive learning approach. Next, we combined the extracted features to construct a large graph where each node represents a patient. Finally, we leveraged the GNN to predict IDH mutation status from the constructed graph.
Methods
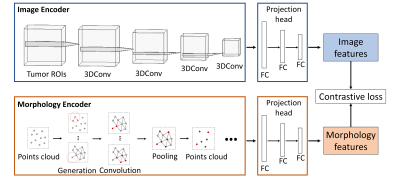
We included 389 glioma patients from both public and in-house datasets7-9. The MRI modalities include pre-contrast T1, post-contrast T1, T2, and T2-FLAIR. We excluded 17 patients due to the unavailable IDH mutation status or incomplete MRI modalities. All MRI were processed using a standard pipeline10 including co-registration, skull stripping, histogram-matching normalization, and denoising. We applied DeepMedic to segment the tumor and generated a binary tumor ROI after manual correction. MRI voxels within the ROI were fed into the image encoder for feature extraction. Additionally, the surface voxels of binary tumor ROI were sampled to point clouds and fed into the morphology encoder (Figure 1).The image features and morphology features were extracted from the corresponding encoders using contrastive learning (Figure 2). The image encoder has a three-dimensional CNN architecture with four input channels corresponding to the four MRI modalities and four batch-normalized convolutional layers. The morphology encoder based on GNN learns from points cloud. First, the points cloud is converted into a graph by linking points within a radius. In the graph, node features are coordinates and edge features indicate the difference between node features. Second, graph convolutional operators aggregate node and edge features to their center node11. Finally, nodes are sampled with pooling. Overall, we repeated those three steps four times. Both encoders are followed by three fully connected layers called projection heads to extract features. Finally, a contrastive loss was applied to maximize the agreement between features extracted from the image and morphology encoders across all patients. The contrastive loss is defined12:
$$L = \frac{1}{N}\sum _{i=1}^{N} \left( -\log\frac{\exp(\cos(v_i,u_i))}{\sum _{k=1}^{N} \exp(\cos(v_i,u_k))} -\log\frac{\exp(\cos(u_i,v_i))}{\sum _{k=1}^{N} \exp(\cos(u_i,v_k))} \right)$$
Where $$$v$$$, $$$u$$$ represent features of image and morphology; $$$cos$$$ represents cosine similarity; $$$N$$$ is the size of the min-batch. Specifically, the loss function is designed to maximize the mutual information between image features and morphological features of the same patient by predicting $$$(v_i, u_i)$$$ and $$$(u_i, v_i)$$$ as true pairs.
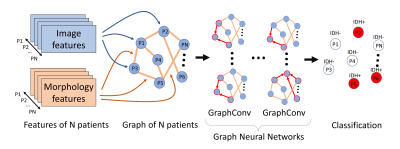
After feature extraction, the entire patient cohort was represented as a large graph, where node weights indicated image features, whereas the edge weights represented the cosine similarity score of morphology features between patient pairs (Figure 3). A GNN architecture was trained to classify the nodes in the generated large graph. The GNN consists of four graph convolutional layers11 that embed the graph information into nodes. The embedded nodes were then applied to predict the IDH mutation status using the cross entropy loss.
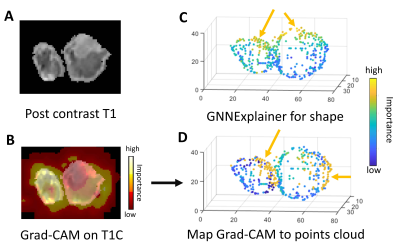
The Grad-CAM13 approach was applied to visualize the activation map of the image encoder on images while GNNExplainer14 was used to visualize the importance of points of points cloud from the morphology encoder.
We performed ablation experiments to validate the proposed method. The image and morphology encoders were converted to end-to-end classifiers respectively, by adding one fully connected layer to directly predict the IDH mutation status using a binary cross entropy loss instead of the contrastive loss.
Results
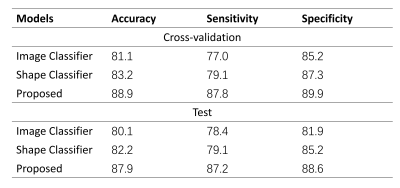
The visualization from the Grad-CAM and GNNExplainer showed that both the agreed and disagreed regions were identified as important for model prediction, suggesting that both encoders could capture both common and unique tumor characteristics (Figure 4).Results of performance experiments in Table 1 showed that the proposed method outperformed both the classifiers based on either image or morphology encoders only.
Discussion and Conclusion
Our approach showed improved classification performance, indicating the feasibility of integrating image and morphology features in radiogenomics analysis. The model interpretation results from the contrastive learning showed that both image and morphology encoders identified similar regions of interest, suggesting the potential internal association between tumor content and shape. In future work, image and morphology encoders could be replaced by deeper pre-trained neural networks to further improve the performance. In conclusion, contrastive learning and graph neural networks showed promising results for predicting IDH mutation status in glioma patients.Acknowledgements
This study was supported by the NIHR Brain Injury MedTech Co-operative. SJP acknowledges National Institute for Health Research (NIHR) Career Development Fellowship (CDF-18-11-ST2-003). The views expressed are those of the authors and not necessarily those of the NHS, the NIHR, or the Department of Health and Social Care.
CL acknowledges Cancer Research UK biomarker grant (CRUK/A19732).
References
- Louis, David N., et al. "The 2016 World Health Organization classification of tumors of the central nervous system: a summary." Acta neuropathologica 131.6 (2016): 803-820.
- Hyare, Harpreet, et al. "Modelling MR and clinical features in grade II/III astrocytomas to predict IDH mutation status." European journal of radiology 114 (2019): 120-127.
- Wu, Jia, et al. "Radiological tumour classification across imaging modality and histology." Nature Machine Intelligence 3.9 (2021): 787-798.
- Liang, Sen, et al. "Multimodal 3D DenseNet for IDH genotype prediction in gliomas." Genes 9.8 (2018): 382.
- Qi, Charles R., et al. "Pointnet: Deep learning on point sets for 3d classification and segmentation." Proceedings of the IEEE conference on computer vision and pattern recognition. 2017.
- Parisot, Sarah, et al. "Disease prediction using graph convolutional networks: application to autism spectrum disorder and Alzheimer’s disease." Medical image analysis 48 (2018): 117-130.
- Pedano, N., Flanders, A. E., Scarpace, L., Mikkelsen, T., Eschbacher, J. M., Hermes, B., … Ostrom, Q. (2016). Radiology Data from The Cancer Genome Atlas Low Grade Glioma [TCGA-LGG] collection. The Cancer Imaging Archive. http://doi.org/10.7937/K9/TCIA.2016.L4LTD3TK
- Scarpace, L., Mikkelsen, T., Cha, S., Rao, S., Tekchandani, S., Gutman, D., Saltz, J. H., Erickson, B. J., Pedano, N., Flanders, A. E., Barnholtz-Sloan, J., Ostrom, Q., Barboriak, D., & Pierce, L. J. (2016). Radiology Data from The Cancer Genome Atlas Glioblastoma Multiforme [TCGA-GBM] collection [Data set]. The Cancer Imaging Archive. https://doi.org/10.7937/K9/TCIA.2016.RNYFUYE9
- Pati, S., Verma, R., Akbari, H., Bilello, M., Hill, V.B., Sako, C., Correa, R., Beig, N., Venet, L., Thakur, S., Serai, P., Ha, S.M., Blake, G.D., Shinohara, R.T., Tiwari, P., Bakas, S. (2020). Data from the Multi-Institutional Paired Expert Segmentations and Radiomic Features of the Ivy GAP Dataset. DOI: https://doi.org/10.7937/9j41-7d44.
- Bakas, Spyridon, et al. "Advancing the cancer genome atlas glioma MRI collections with expert segmentation labels and radiomic features." Scientific data 4.1 (2017): 1-13.
- Kipf, Thomas N., and Max Welling. "Semi-supervised classification with graph convolutional networks." arXiv preprint arXiv:1609.02907 (2016).
- Zhang, Yuhao, et al. "Contrastive learning of medical visual representations from paired images and text." arXiv preprint arXiv:2010.00747 (2020).
- Selvaraju, Ramprasaath R., et al. "Grad-cam: Visual explanations from deep networks via gradient-based localization." Proceedings of the IEEE international conference on computer vision. 2017.
- Ying, Rex, et al. "Gnnexplainer: Generating explanations for graph neural networks." Advances in neural information processing systems 32 (2019): 9240.
Figures


