1155
Quality Assurance and Quality Control for HRMAS MRS Studies of Human Blood1Massachusetts General Hospital, Charlestown, MA, United States
Synopsis
The lack of a standard universal protocol for sample preparation in MRS experiments results in instrumental and biological variability across reported studies. The purpose of this experiment is to evaluate a quality assurance protocol for performing HRMAS 1H MRS experiments with human biofluid samples, such as blood serum. The research objective is to determine if the spectral results measured from pooled samples can be used to assess results from individual samples as controls. These findings will help better develop efficient standard protocols for researchers and clinicians to use in the future.
Introduction
The field of metabolomics has enabled studies to characterize, quantify, and measure the abundance of metabolites in association with physiology and pathology.1 Profiling these biochemical signatures has provided new insights into the inner workings of the human body.In recent years, HRMAS 1H MRS has become an innovative platform for metabolomics. By utilizing this technique, different biological samples can be analyzed, such as intact tissues, cell cultures, and biofluids. HRMAS 1H MRS has been employed extensively to study the underlying molecular mechanisms of diseases in animal models and humans.2,3 Although these techniques have resulted in several advancements in the field of metabolomics, there is no standard QA/QC protocol for sample preparation in MRS experiments. As the first step towards standardization, the purpose of this study is to evaluate a QA/QC protocol for performing HRMAS 1H MRS experiments with human blood specimens in the form of serum and plasma.
Methods
Measurements of human blood specimens are approved by our local IRB. Blood samples from prostate cancer patients and from Alzheimer’s disease patients were obtained from our local biospecimen repositories.The human prostate cancer cohort consisted of frozen blood serum samples from two patient groups: progressive (n=6) and non-progressive (n=6). From each of these two groups, three pooled control samples were made for each group. These samples were used to test the MRS serum measurement system stability by comparing the means of individual samples in each group with the pooled controls for 71 spectral regions; and the stability of the pooled control samples following multiple freezing-thawing processes.
A total of 45 frozen blood plasma samples from 35 AD patients (n=16) and non-AD subjects (n=19) were measured individually. Among the non-AD subjects, five cases were used to test within- vs. inter-subject metabolic differences, and the rest single time-point AD and non-AD plasmas were used to generate six pooled quality control samples. Finally, the MRS plasma system stability was measured by comparing the means of individual samples in each group with the pooled controls.
All samples were kept at -80°C. Before MRS measurements, all samples were allowed to thaw for approximately an hour on ice. After being vortexed, 10 uL of the sample was added to the rotor in addition to 2.5 uL of D2O. HRMAS MRS data were collected on a Bruker AVANCE III HD 600MHz instrument, at 4ºC, with a spinning rate of 3600 Hz, and with a rotor synchronized CPMG method. Spectra analyzed with Bruker Topspin 3.6.2 identified 36 common spectral regions among the individual samples. Statistical analyses on these regions were carried out on JMP from SAS.
Results
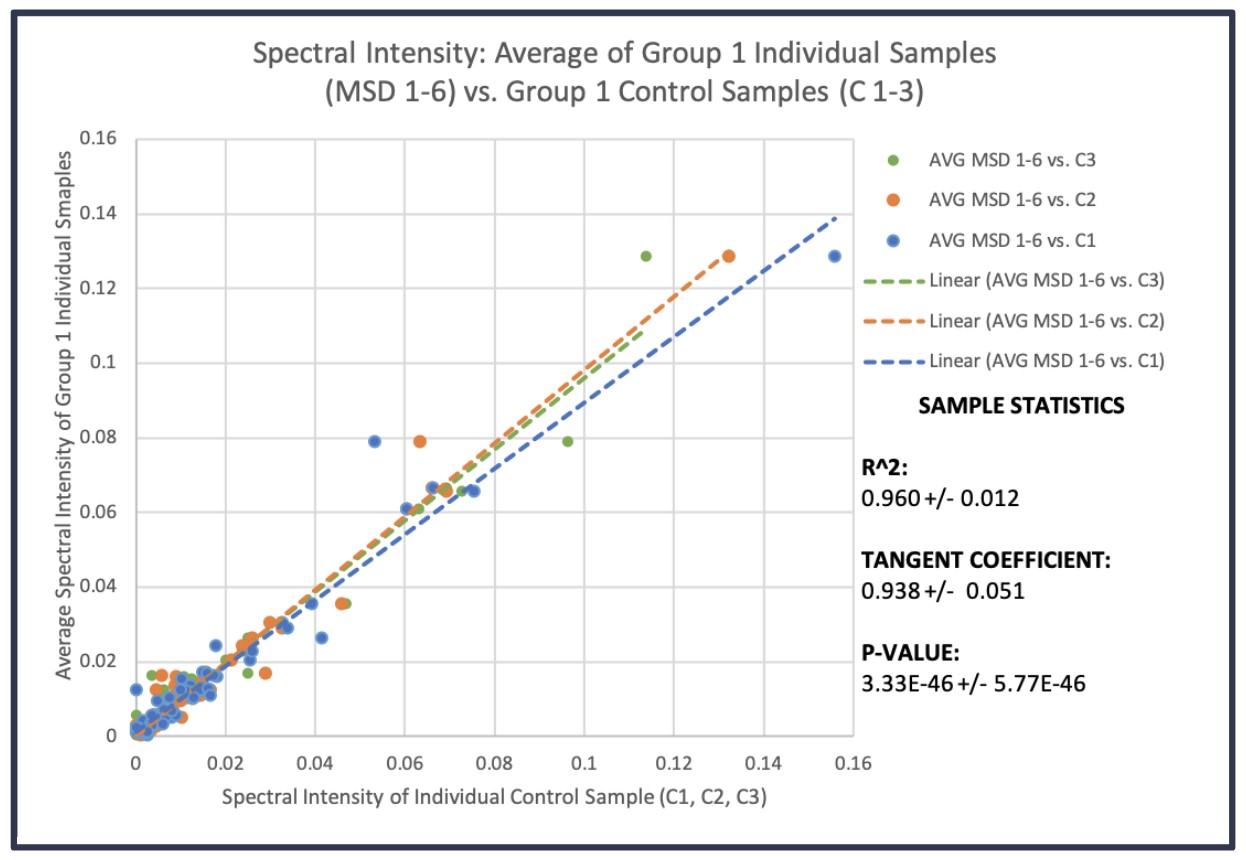
Fig 1 presented example data obtained of serum samples obtained from non-aggressive prostate cancer patients. Statistically significant linear correlations were observed when comparing the mean calculated from spectra of individual samples in the group with each of the pooled three controls, with tangent coefficients being close to 1 (0.938 +/- 0.051). This indicates that the intensities of the pooled control samples are nearly equivalent to the average intensities of the individual samples for the 71 measurable spectral regions. The standard deviation indicates minimal uncertainty in the measurements and the small p-value for the results indicates a high level of statistical significance.Using human plasma samples obtained from the same subject at different time points, we compared the differences of the means, the maximum variations of the means among subjects measured from the five subjects at three different time points, with the mean of the standard errors calculated for each subject according to three time points for all 36 identified spectral regions, as shown in Fig 2, which clearly shows that the former were 16.7±1.4 fold higher than the latter.
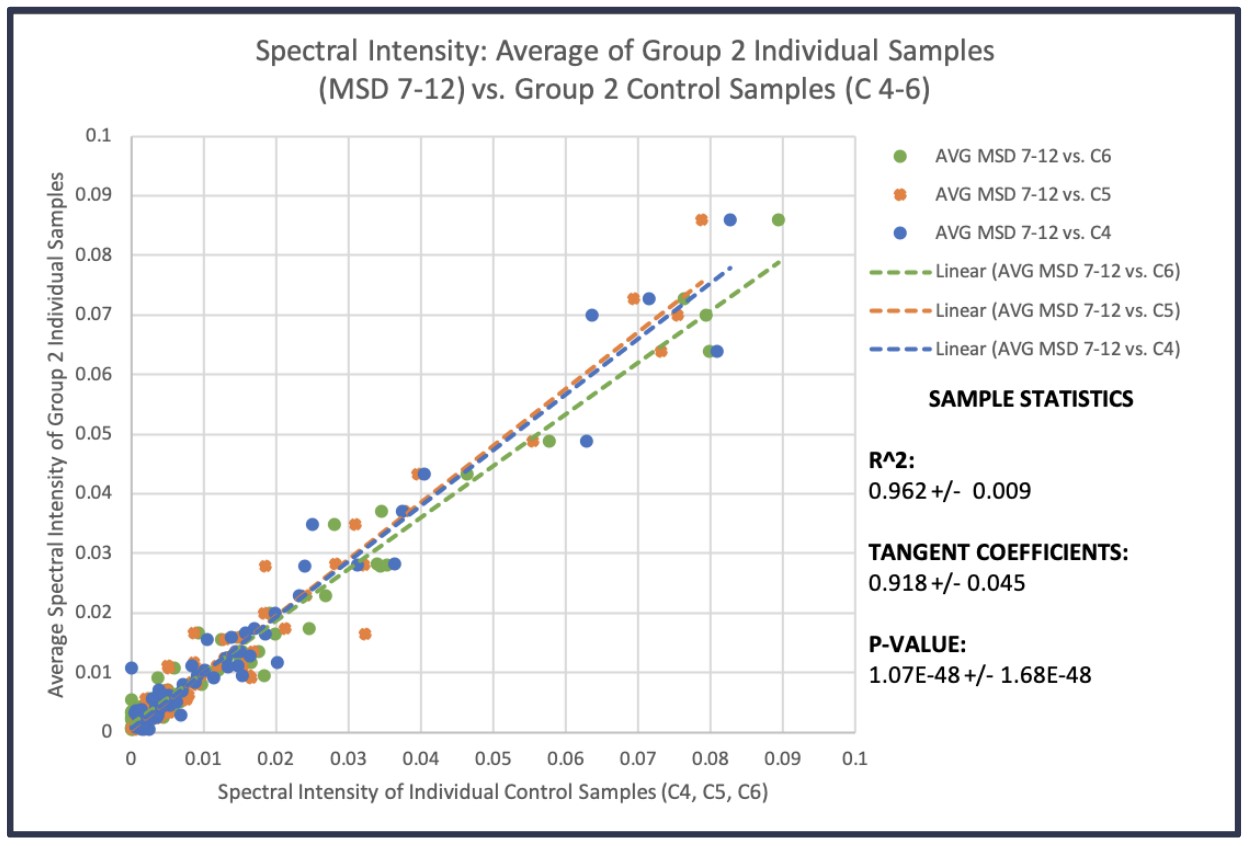
For human plasma samples, we further investigated the MRS system stability by comparing the means of individual samples in each group with the pooled controls for 36 spectral regions, as shown in Fig 3. The linear relationship presented in Fig 3 also demonstrates our reliable system of providing quantitative spectral data for metabolomic evaluations of blood plasma.
Discussion & Conclusion
Our findings demonstrate both blood and serum samples’ stability and the system’s reproducibility for analysis of biological specimens. The evaluations and the procedures designed for these evaluations are critical for the development of MRS based metabolomics for various disease of concern. The results of these tests will aid the current efforts in the metabolomics field to standardize study design and sample preparation procedures for MRS experiments with human biofluids. Developing standard quality assurance protocols will improve the accuracy of clinical pathology and the development of linkages between ex-vivo tumor evaluation and in-vivo non-invasive diagnosis for a wide range of human malignancies.Acknowledgements
This project received funding and resources from the following: National Institutes of Health grant S10OD023406, National Institutes of Health grant R21CA243255, National Institutes of Health grant R01AG070257, and the MGH A. A. Martinos Center for Biomedical Imaging.References
1. J. K. Nicholson and J. C. Lindon, “Metabonomics,” Nature, vol. 455, no. 7216, pp. 1054–1056, Oct. 2008, doi: 10.1038/4551054a.
2. N. Bar et al., “A reference map of potential determinants for the human serum metabolome,” Nature, vol. 588, no. 7836, pp. 135–140, Dec. 2020, doi: 10.1038/s41586-020-2896-2.
3. E. Kaebisch, T. L. Fuss, L. Vandergrift, K. Toews, P. Habbel, and L. L. Cheng, “Applications of High-Resolution Magic Angle Spinning MRS in Biomedical Studies I -- Cell Lines and Animal Models,” NMR Biomed, vol. 30, no. 6, p. 10.1002/nbm.3700, Jun. 2017, doi: 10.1002/nbm.3700.
Figures