1153
Simultaneous Measurement of Glu and GABA at 7T1Chemical and Biological Physics, Weizmann, Rehovot, Israel, 2Life Sciences Core Facilities, Weizmann, Rehovot, Israel, 3Brain Sciences, Weizmann, Rehovot, Israel
Synopsis
Glutamate (Glu) and γ‑aminobutyric-acid (GABA) are central neurotransmitters participating in many cognitive processes, and their combined measurement is of great relevance. Proton Magnetic Resonance Spectroscopy (1H-MRS) allows the no–invasive, in-vivo, measurement of GABA and Glu. At magnetic fields below 7T, GABA is detected by spectral editing strategies, while Glu is detected by non-editing strategies. We compared both edited and non‑edited approaches at 7T for simultaneously quantifying Glu and GABA from 21 volunteers, and found that non-edited sequences at TE=80ms provide better combined-reproducibility than either edited sequences at the same TE, or non-edited sequence at a shorter TE (42ms).
Background
The ratio of glutamate (Glu) to γ‑aminobutyric-acid (GABA), also known as the excitatory-inhibitory balance (E/I balance), modulates a wide range of cognitive and behavioral processes1.Proton Magnetic Resonance Spectroscopy (1H-MRS) remains the only method capable of safely and non-invasively measuring the concentrations of Glu and GABA in‑vivo. At 3T, MRS relies on spectral Mescher-Garwood (MEGA)2 editing techniques to distinguish GABA from its overlapping resonances. However, at ultrahigh field strengths (≥7T), and the increases in spectral resolution they afford, non-edited spectroscopic techniques become potential viable alternatives to MEGA based approaches, and address some of their shortcomings. We present a comprehensive comparison of edited and non‑edited strategies at 7T for simultaneously quantifying Glu and GABA, and evaluate their reproducibility and relative bias.Methods
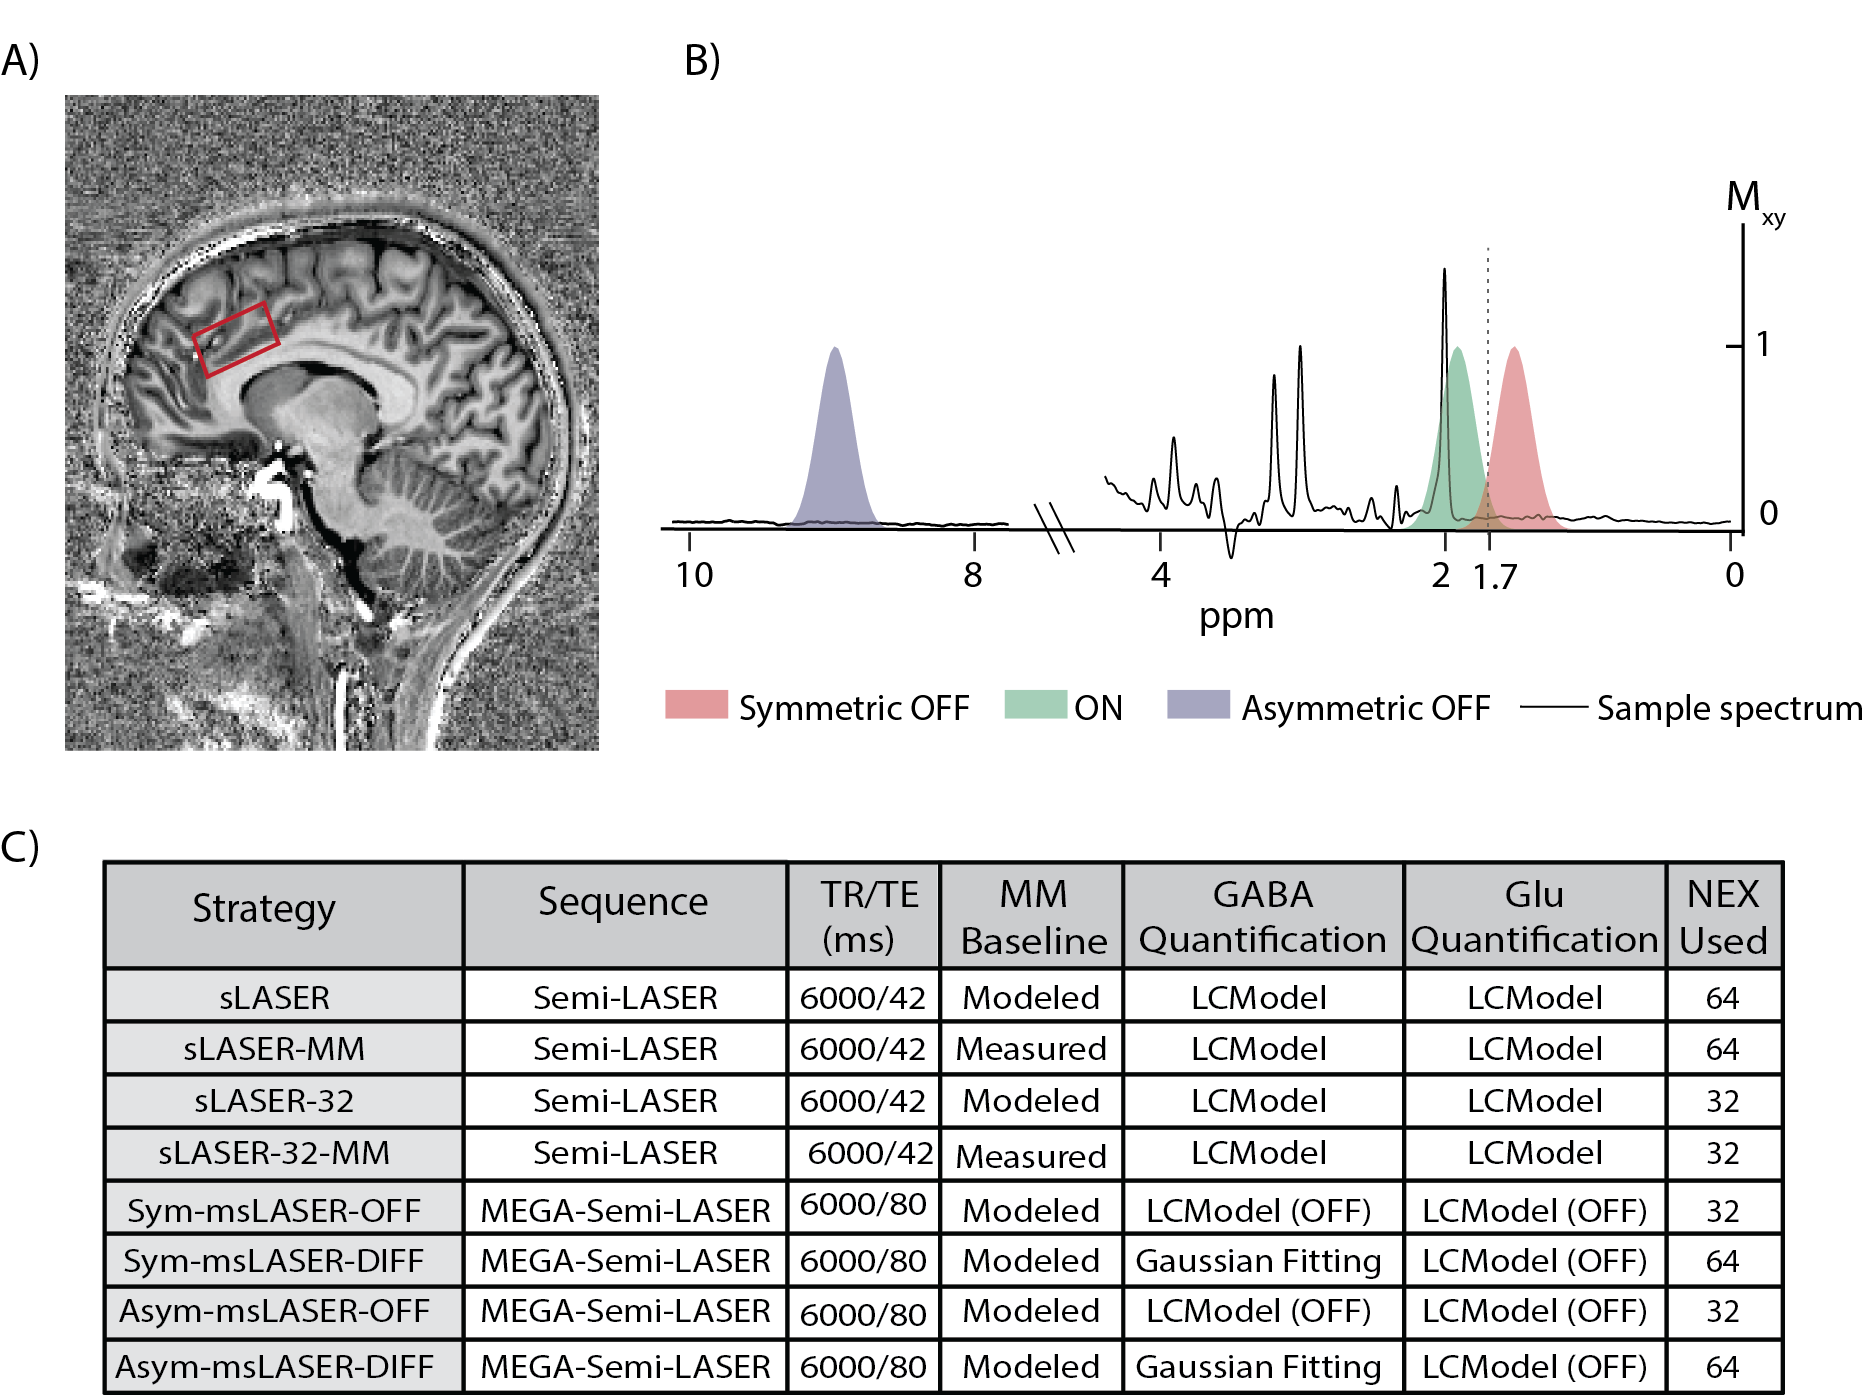
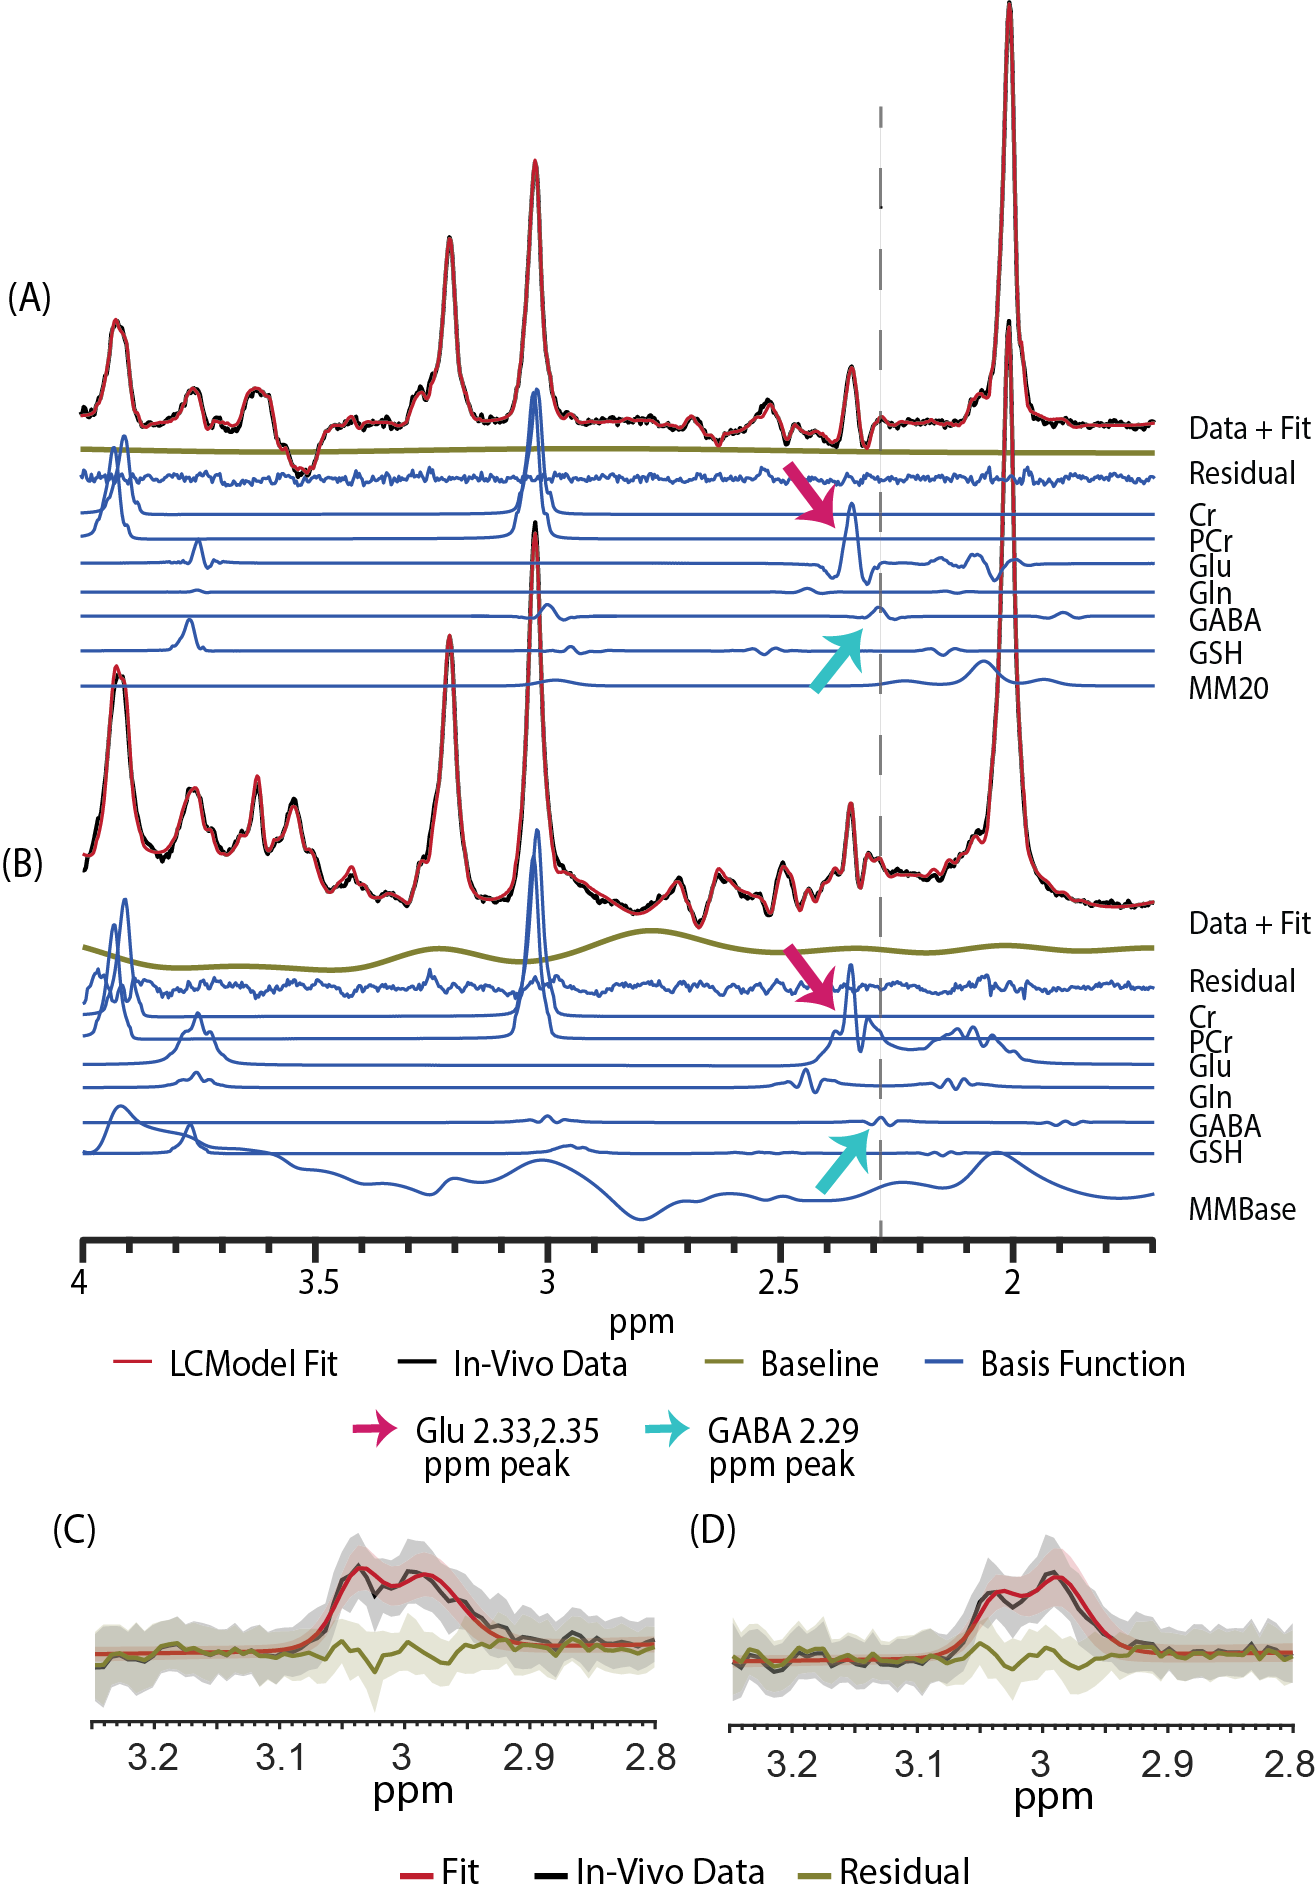
21 volunteers were scanned on a 7T scanner, using three single‑voxel MRS sequences (Fig. 1): SemiLASER (TE=42 ms), and symmetric and asymmetric MEGA‑SemiLASER (TE=80 ms). Once completed, each volunteer was removed from the scanner, repositioned, and rescanned for reproducibility estimation. We compared eight strategies (Fig. 1C) for simultaneously quantifying both GABA and Glu at 7T: LCModel‑fitted non edited sLASER at TE=42 ms without (sLASER) and with the inclusion of a measured macromolecule (MM) baseline3,4 (sLASER‑MM). LCModel‑fitted MEGA‑based sequences, using only the OFF data (Sym‑msLASER‑OFF; Asym‑msLASER‑OFF) (Fig. 2A-B), and double Gaussian fitted MEGA‑based sequences, which quantify only GABA, using the difference spectra (Sym‑msLASER-DIFF; Asym‑msLASER-DIFF) (Fig. 2C-D). To enable a fair comparison with the same signal to noise (SNR) between the sLASER and msLASER‑OFF datasets, the last two strategies repeated the spectral LCModel fitting for the sLASER acquisitions, with half the number of excitations (sLASER‑32, sLASER‑32‑MM). Metabolites concentrations were corrected for tissue fractions within the voxel and relaxation times. The intra-subject CV for each metabolite was calculated using the first and second scan of each volunteer, and averaging across volunteers. The combined CV of GABA and Glu was calculated as CVE/I=√(CVGABA2+CVGlu2).Results
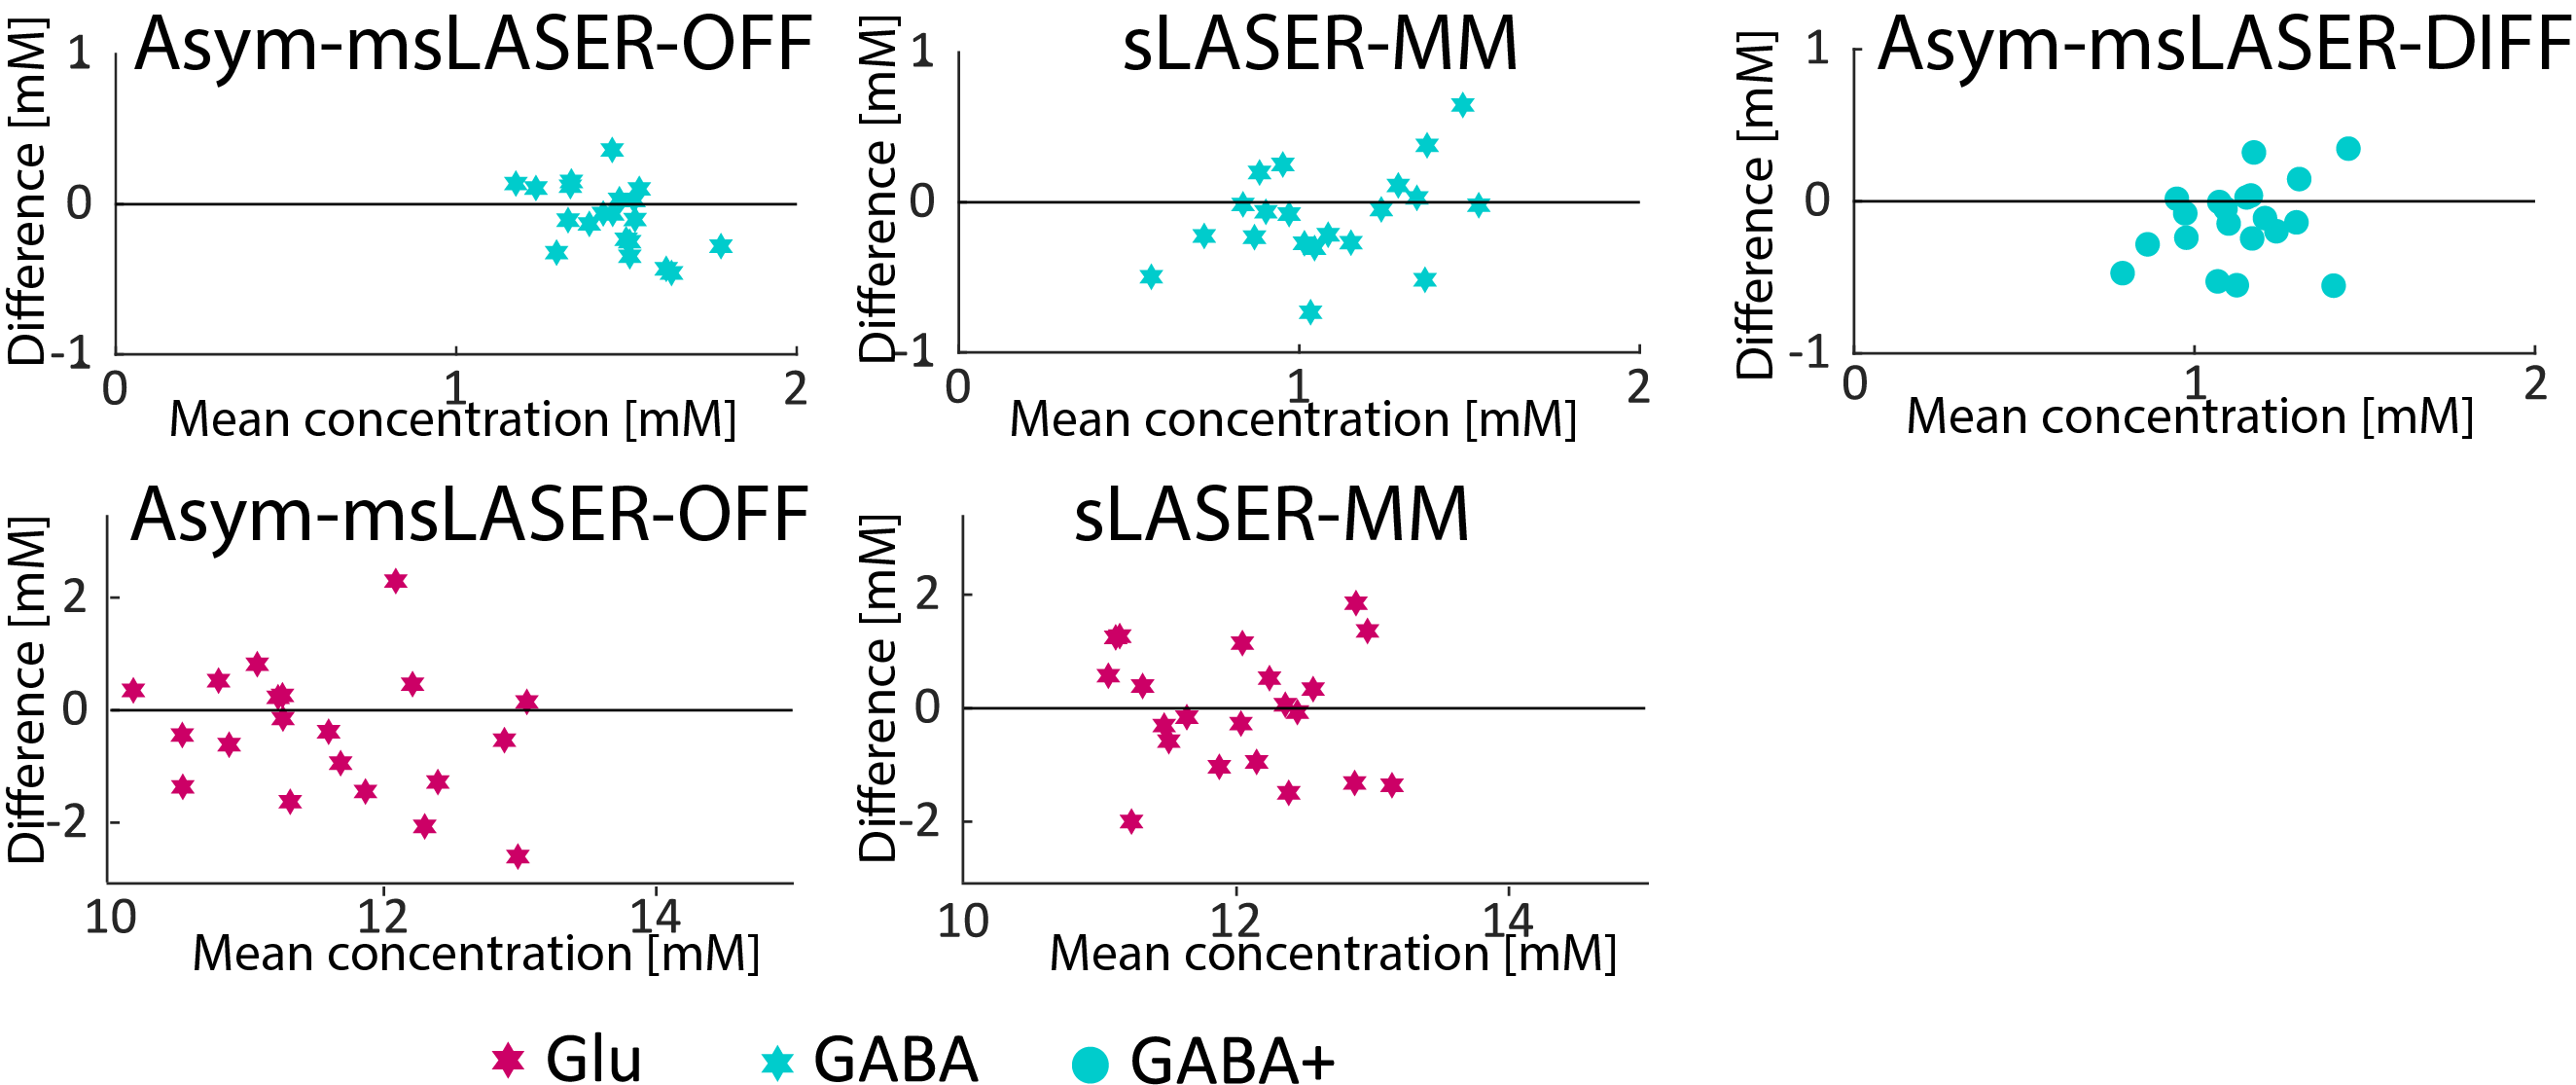
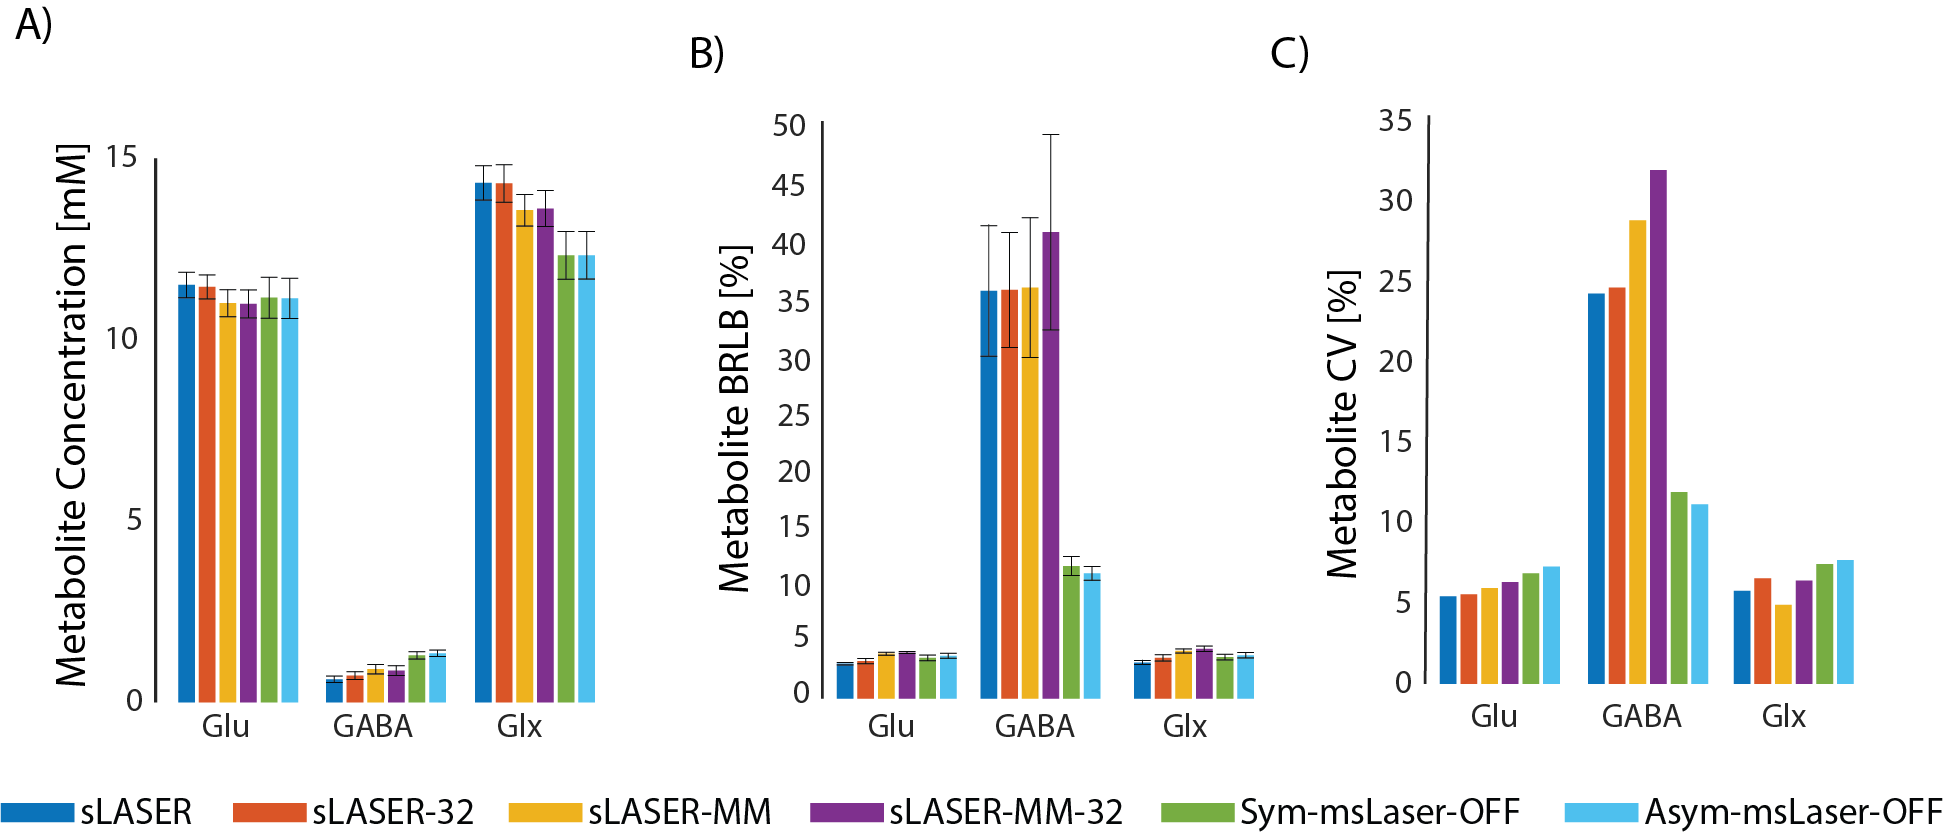
The first and second scans were unbiased (Fig. 3), meaning that the magnet, sequences and volunteers all remained stable between the two scans. Fig. 4 present GABA and Glu concentrations, CRLBs and CVs in the different quantification strategies. The best intra‑subject CV for GABA was observed for the Asym-msLASER‑OFF data. The reproducibility of Glu was better under sLASER, but not substantially. The msLASER‑OFF data exhibit the best CVE/I: 13.3% (Asym‑msLASER‑OFF) and 13.8% (Sym‑msLASER‑OFF), compared to much higher CVs for sLASER: 24.9% (sLASER), 29.5% (sLASER‑MM), 25.3% (sLASER‑32), 32.6% (sLASER‑32‑MM), 20.1% (Asym‑msLASER‑DIFF), and 21.0% (Sym‑msLASER‑DIFF). Inclusion of a MM baseline in sLASER slightly reduced the quantified concentration of Glu (11.5 mM vs. 11.0 mM), and increased GABA estimates from 0.64 mM to 0.92 mM. LCModel fitting of the Sym‑msLASER‑OFF and Asym‑msLASER‑OFF data resulted in similar estimates of Glu (11.1 mM and 11.2 mM), but a higher estimate of GABA: 1.30 mM and 1.35 mM. GABA quantification based on the edited spectra resulted in 1.13 mM for the Asym‑msLASER‑DIFF, and 1.06 mM for the Ssym‑msLASER‑DIFF. Significant change (P<0.01) was found between the symmetric and asymmetric approaches in the OFF based quantification, and between the OFF and DIFF approaches, yet non-significant change was found between the symmetric and asymmetric approaches in the DIFF based quantification.Conclusions
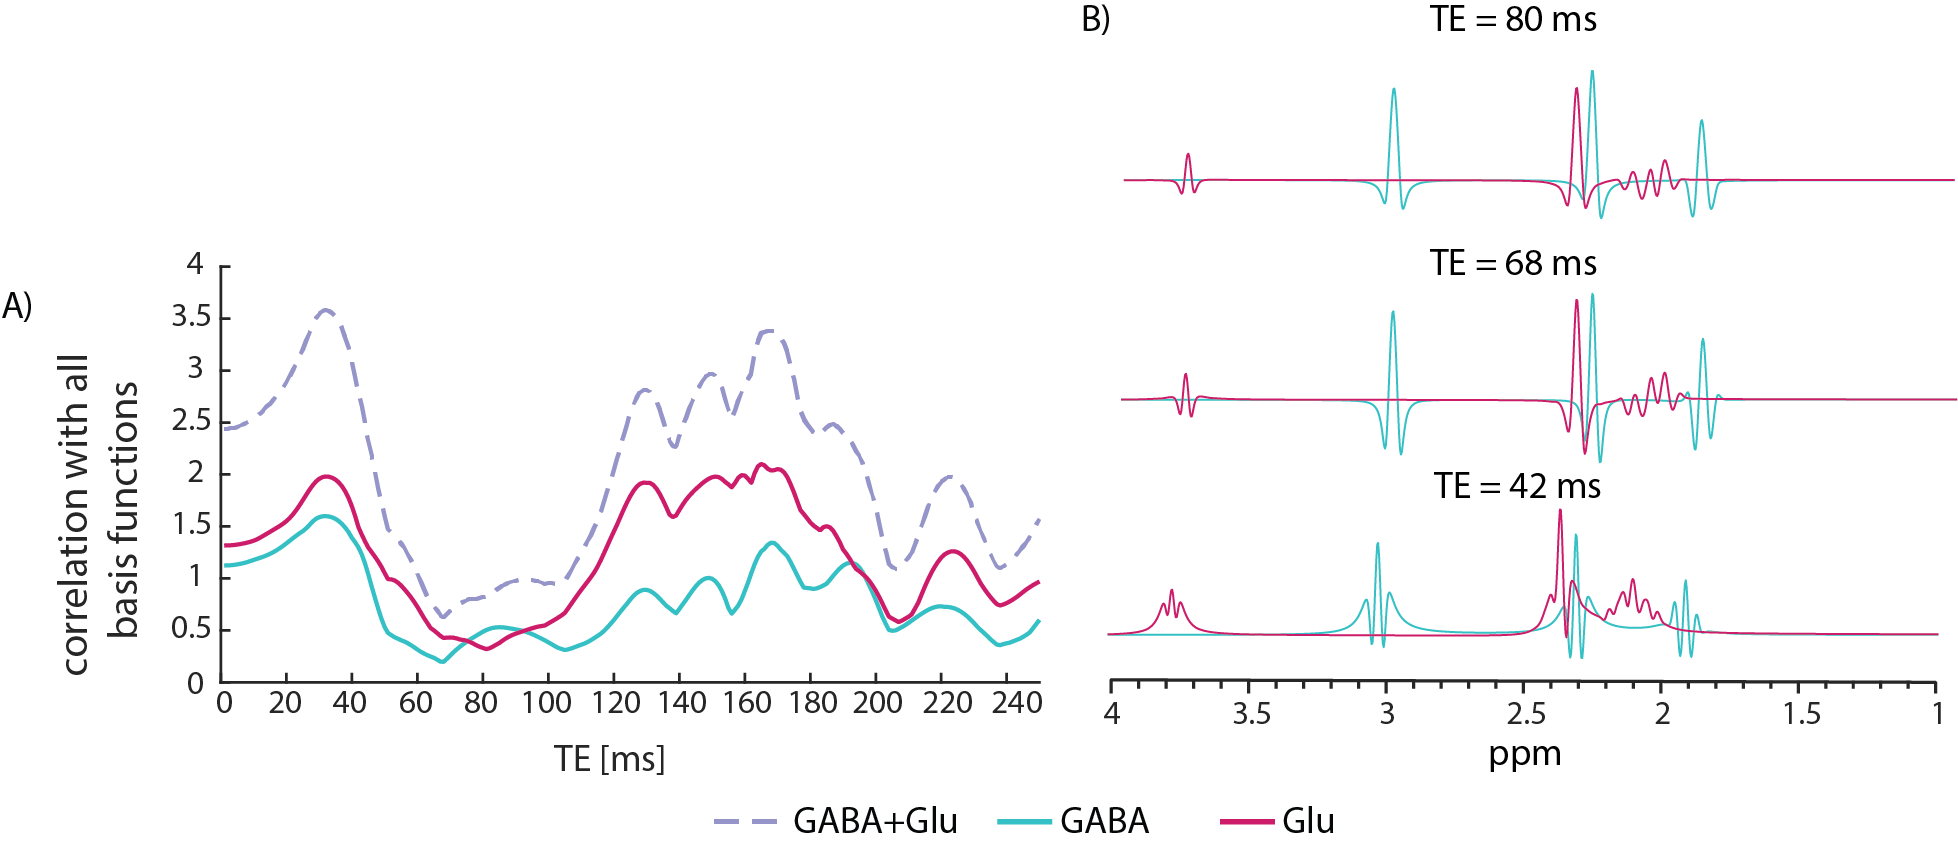
The MM elimination in the edited strategy did not affect the quantification, likely due to the narrow bandwidth of the spectral editing pulses (Fig. 1B). Non-edited sequences at TE=80 ms provide better reproducibility than either edited sequences at the same TE, or non-edited sequence at a shorter TE (42 ms); This is due to the judicious choice of echo time leads to a pseudo-singlet appearance for the GABA multiplets at 1.89 and 2.29 ppm (Fig. 5). Our results motivate a transition to non-edited MRS of GABA and glutamate at ultrahigh fields, provided the echo time is set appropriately.Acknowledgements
Assaf Tal acknowledges the support of the Monroy-Marks Career Development Fund, the historic generosity of the Harold Perlman Family, and the support of NIH grant R21NS112853 and Israeli Science Foundation personal grant 416/20. Dr. E. Furman-Haran holds the Calin and Elaine Rovinescu Research Fellow Chair for Brain Research. We would like to acknowledge Edward J. Auerbach, Ph.D. and Małgorzata Marjańska, Ph.D. (Center for Magnetic Resonance Research and Department of Radiology, University of Minnesota, USA) for the development of the pulse sequences for the Siemens platform which were provided by the University of Minnesota under a C2P agreement.References
1. Bezalel, V., Paz, R. & Tal, A. Inhibitory and excitatory mechanisms in the human cingulate-cortex support reinforcement learning: A functional Proton Magnetic Resonance Spectroscopy study. Neuroimage 184, 25–35 (2019).
2. Mescher, M., Merkle, H., Kirsch, J., Garwood, M. & Gruetter, R. Simultaneous in vivo spectral editing and water suppression. NMR Biomed. 11, 266–272 (1998).
3. Snoussi, K. et al. Comparison of brain gray and white matter macromolecule resonances at 3 and 7 Tesla. Magn. Reson. Med. 74, 607–613 (2015).
4. Schaller, B., Xin, L. & Gruetter, R. Is the macromolecule signal tissue-specific in healthy human brain? A 1 H MRS study at 7 tesla in the occipital lobe. Magn. Reson. Med. 72, 934–940 (2014).
Figures