1151
Comparison of in vivo hepatic metabolic quantitation by localized 31P MRS at 7T1Division of Endocrinology and Metabolism, Department of Medicine III, Medical University of Vienna, Vienna, Austria, 2High Field MR Centre, Department of Biomedical Imaging and Image-guided Therapy, Medical University of Vienna, Vienna, Austria, 3High Field MR Centre, Center for Medical Physics and Biomedical Engineering, Medical University of Vienna, Vienna, Austria, 4Christian Doppler Laboratory for Clinical Molecular MR Imaging, Vienna, Austria
Synopsis
This study focuses on the comparison of different in vivo data-acquisitions for quantifying hepatic 31P metabolite concentrations using a phantom replacement method. We have compared a 1D-slab localized DRESS, a single-voxel-spectroscopy (SVS) ISIS as well as a 3D-CSI 31P MRS acquisition at 7T. Each method has its own advantages and disadvantages and needs to be chosen according to the focus and design of the study.
Introduction/Purpose
The non-invasive assessment of hepatic 31P metabolites offers the characterization of hepatobiliary and diffuse liver pathologies on a molecular basis1. Quantifications using an internal reference (e.g. ATP) assume a constant reference concentration across the study group and measurement conditions2. The 31P content can also be determined by the phantom replacement method3-5. Different data acquisition approaches, e.g. 1D-slab localized (DRESS), single voxel ISIS and 3D-CSI 31P MRS, have been proposed and validated at different sites and MR systems. This study aims for comparison of the assessment of hepatic 31P metabolite concentrations using different data-acquisition sequences.Subjects/Methods
Four healthy subjects (age: 22–34y, BMI: 22.3±1.3kg.m-2) were measured in an overnight fasting state in a 7T scanner (MAGNETOM, Siemens Healthineers, Erlangen, Germany) using a 1H/31P surface coil (Ø=9.5cm/10.5cm, Rapid Biomedical, Rimpar, Germany). The volunteers were positioned over the RF-coil on the right lateral side with the liver above the measurement device.Three different sequences were applied to collect 31P MRS data:
- 3D-CSI (FOV=20x20x20cm³, matrix size: 12x12x12, TR=1800ms, acquisition delay: 0.9ms, 600µs RECT pulse, elliptically reduced k-space sampling, total measurement time: 15:34min, postprocessing: zerofilling to 16x16x16, Hamming filtering in k-space)5
- SVS ISIS (VOI=5x5x3cm³, TR=3000ms, acquisition delay: 0.4ms, 2500µs adiabatic-half-passage (AHP) pulse, 72 averages, total measurement time: 3:36min)4
- 1D-slab DRESS (slice thickness=25mm, TR=5000ms, acquisition delay: 0.9ms, 600µs SINC pulse, 32 averages, total measurement time: 2:40min)3
A set of 31P resonances were fitted using the AMARES algorithm in jMRUI6,7. For the 3D-CSI only voxels located in the liver (SNR≥17 and negligible PCr signal) were chosen for quantification. The molar in vivo metabolite concentrations were calculated by the comparison of in vivo and phantom signal, corrected for the coil loading and T1 relaxation. For the 1D-slab DRESS approach an additional sensitive volume correction for the overlay of hepatic parenchyma with the sensitive volume of the RF-coil was performed with 3D-Slicer8 in eight transversal images.
Results
For the 3D-CSI the number of voxels meeting the requested SNR conditions in vivo ranged from 38 to 59 voxels and thus covering a nominal volume of 99.1±17.5cm³ (Fig.2A). The VOI of the ISIS based SVS was 75cm³. The 1D-slab segmentation covered in vivo 193 to 199cm³ of hepatic parenchyma (Fig.2B) while in the phantom it adds up to 200cm³. Fig.3 shows typical in vivo spectra from the three different acquisitions. The quantitation was successful in all volunteers and approaches and mean concentrations of the 31P metabolites are given Tab.1.Discussion
The spectral quality of all three methods was sufficient and in good agreement with previous publications4,5. The DRESS sequence shows the highest SNR due to its large VOI. As the localization is done in one ‘shot’ it is very fast and many averages can be recorded in a short time.In numerical comparison for metabolites from γ-ATP and downfield the ISIS sequence overestimates the concentrations compared to the 3D-CSI sequence while the DRESS sequence tends to underestimate most metabolites. The α-ATP content assessed with the ISIS sequence results in low concentrations and does not match the γ-ATP concentration.
A major disadvantage of the DRESS approach is the necessary additional volume estimation which introduces a possible source of errors. Furthermore, the presence of the PCr signal is the indicator of signal contamination from adjacent muscle tissue, which should be treated by outer volume suppression in future studies.
The single voxel ISIS VOI can be well placed within hepatic parenchyma and avoiding signal contamination. Never-the-less, due to the lower SNR spectral fitting is more prone to errors, especially for less abundant metabolites. Differences in the ATP signals could result from inhomogeneous pulse profile of the AHP pulse being not able to reach the adiabatic condition in that frequency region at B0 used in this study9.
The VOI of the 3D-CSI sequence is individually chosen in the postprocessing by selecting voxels meeting desired conditions (e.g. location, SNR, signal contamination). As each spectrum is fitted separately possible fitting errors are reduced by averaging over the voxels. Additionally, the signal intensity and concentration distribution can be visualized. The major disadvantage is the long measurement time.
Conclusion
All three methods result in reasonable 31P metabolite concentrations with individual advantages and disadvantages. For interests in low abundant metabolites 3D-CSI and DRESS would be better choice, depending on the desired precision and measurement time. Single voxel ISIS localization offers the possibility for a fast assessment of certain metabolites with lower precision.Acknowledgements
This study was supported by the Project “lepTin” (KPKLI782FW).References
- Chmelík M, Krššák M. In-vivo31P-MRS of skeletal muscle and liver: A way for non-invasive assessment of their metabolism. Anal Biochem. 2017;15;529:193-215.
- Hernández EA, Kahl S, Seelig A, et al. Acute dietary fat intake initiates alterations in energy metabolism and insulin resistance. J Clin Invest 2017;127:695–708.
- Norén B, Lundberg P, Ressner M, et al. Absolute quantification of human liver metabolite concentrations by localized in vivo 31P NMR spectroscopy in diffuse liver disease. Eur Radiol. 2005 Jan;15(1):148-57.
- Laufs A, Livingstone R, Nowotny B, et al. Quantitative liver 31 P magnetic resonance spectroscopy at 3T on a clinical scanner. Magn Reson Med 2014;71:1670–1675.
- Pfleger L, Gajdošík M, Wolf P, et al. Absolute Quantification of Phosphor-Containing Metabolites in the Liver Using 31 P MRSI and Hepatic Lipid Volume Correction at 7T Suggests No Dependence on Body Mass Index or Age. J Magn Reson Imaging. 2019 Feb;49(2):597-607.
- Vanhamme L, van den Boogaart A, Van Huffel S. Improved method for accurate and efficient quantification of MRS data with use of prior knowledge. J Magn Reson 1997;129:35-43.
- Naressi A, Couturier C, Devos JM, et al. Java-based graphical user inter- face for the MRUI quantitation package. MAGMA 2001;12:141–152.
- Fedorov A, Beichel R, Kalpathy-Cramer J, et al. 3D slicer as an image computing platform for the quantitative imaging network. Magn Reson Imaging 2012;30:1323-1341.
- Chmelík M, Kukurová IJ, Gruber S, et al. Fully adiabatic 31P 2D-CSI with reduced chemical shift displacement error at 7 T--GOIA-1D-ISIS/2D-CSI. Magn Reson Med. 2013 May;69(5):1233-44.
Figures
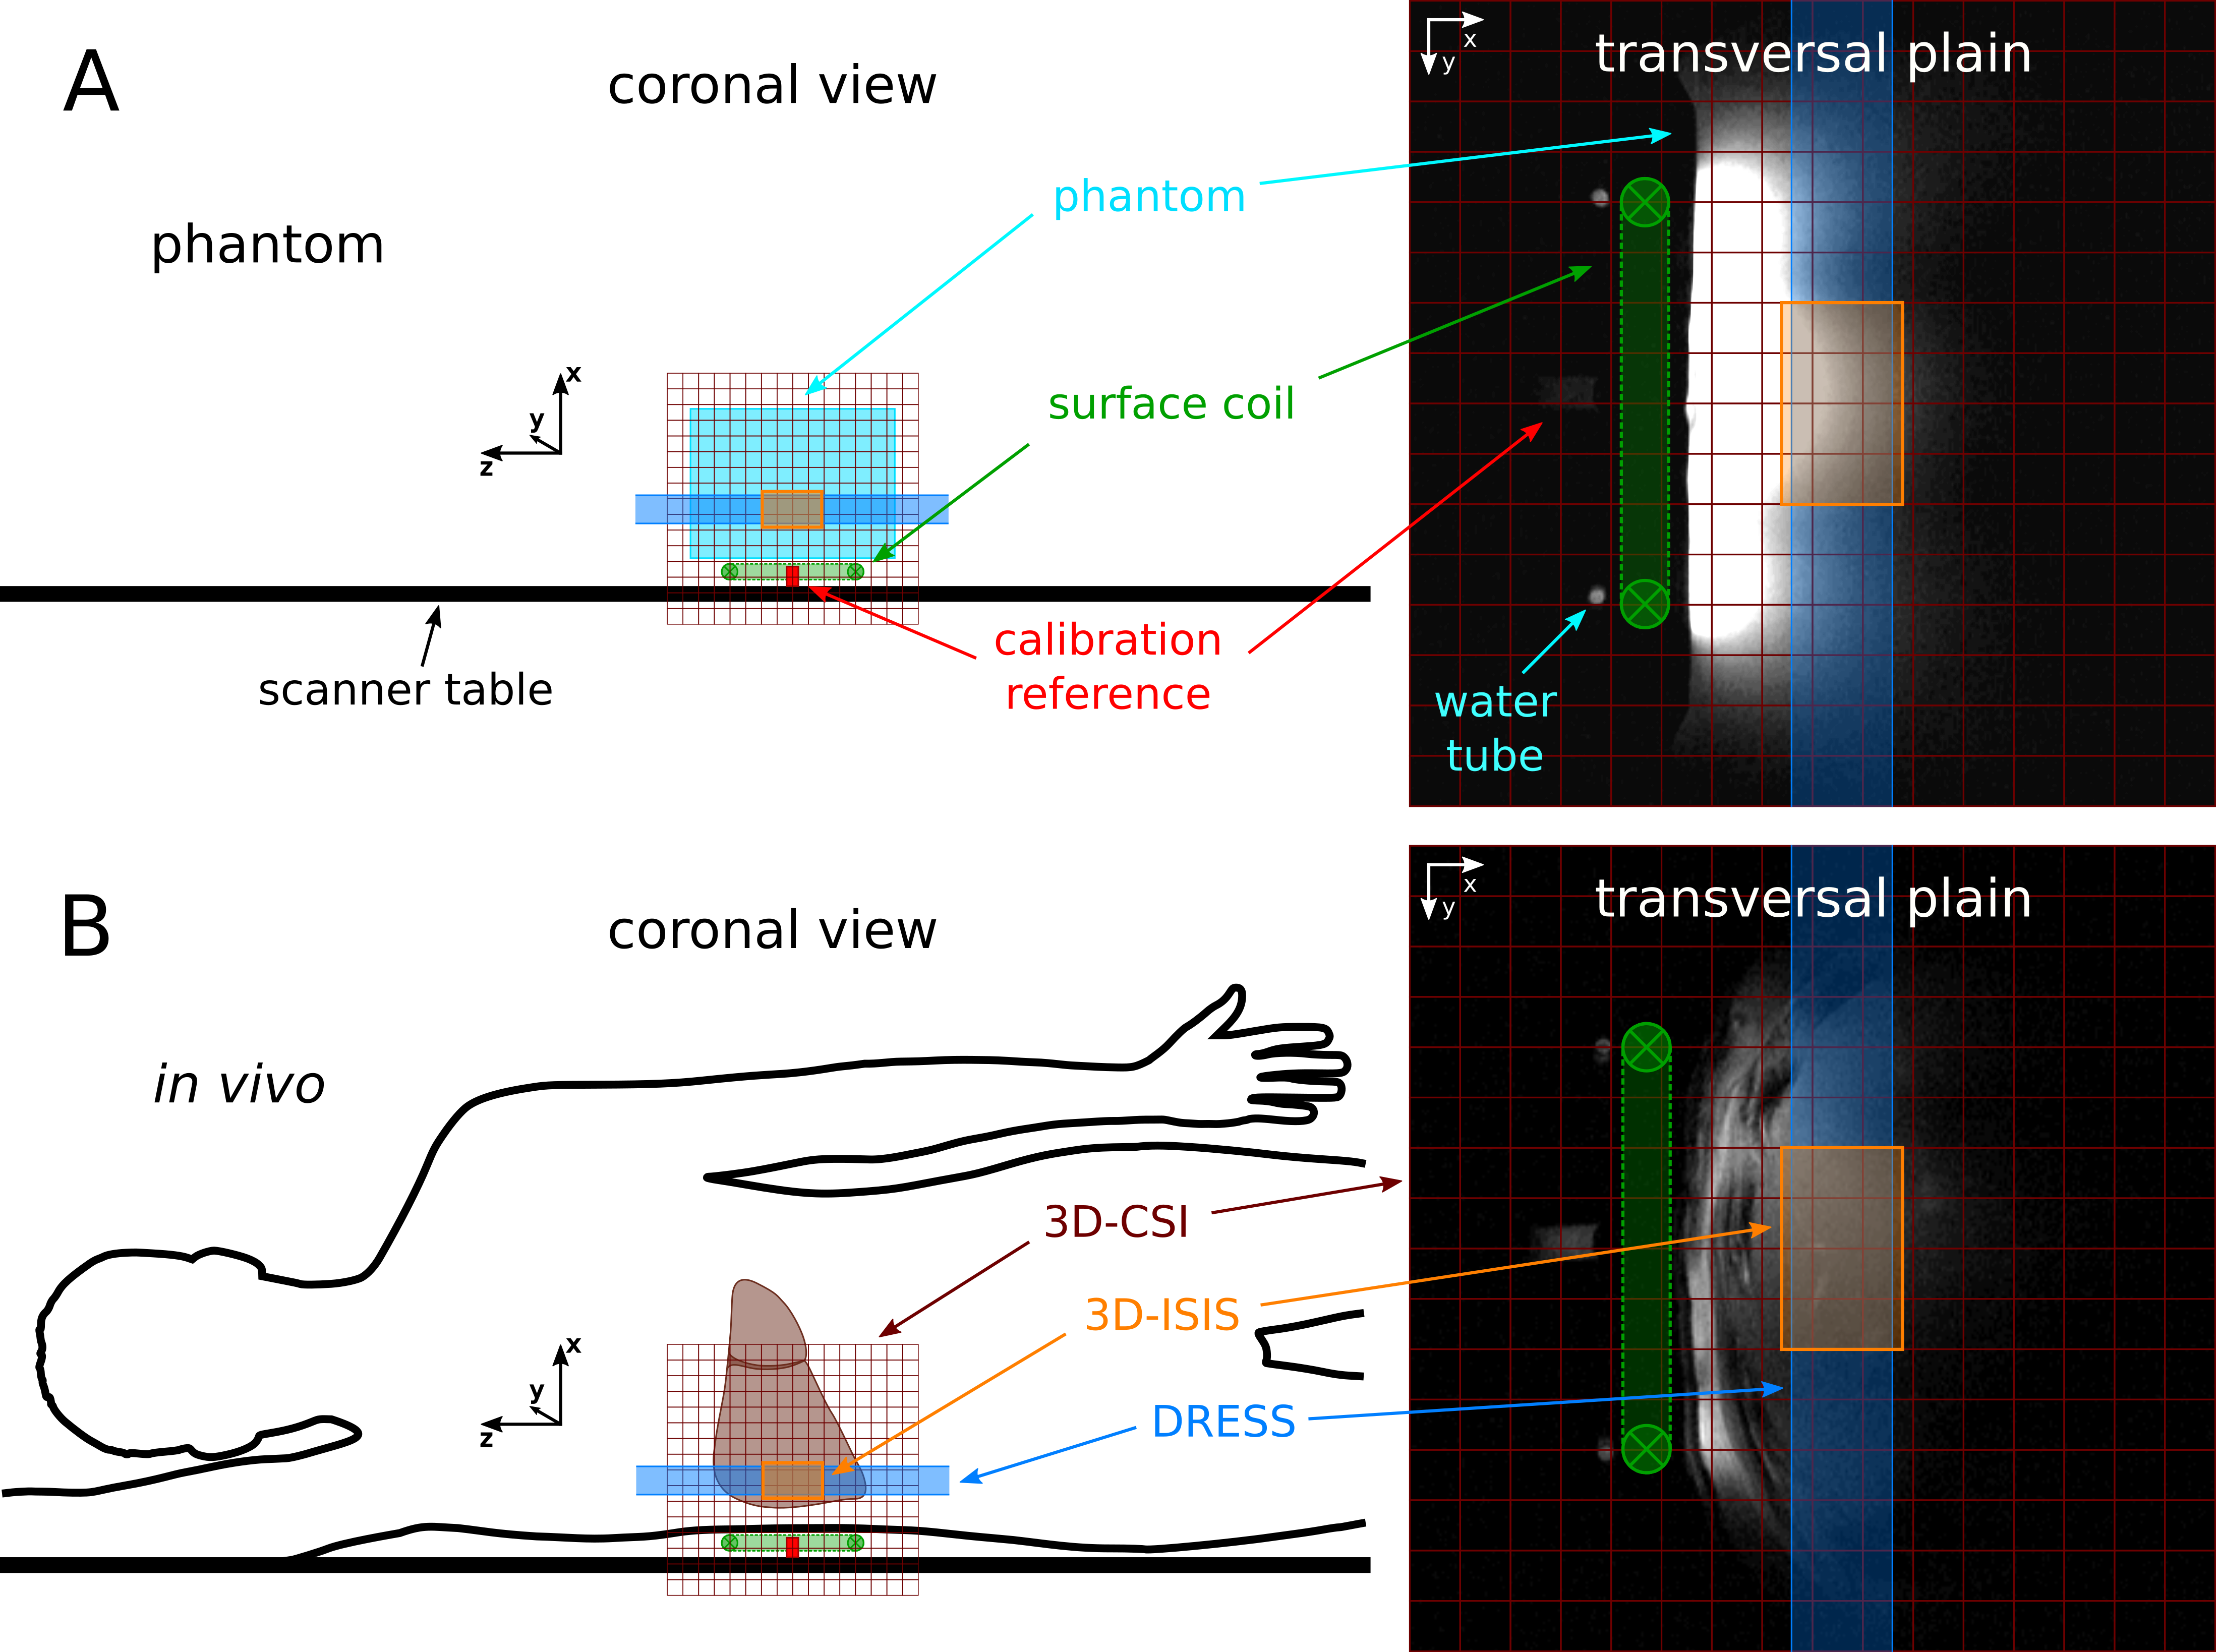
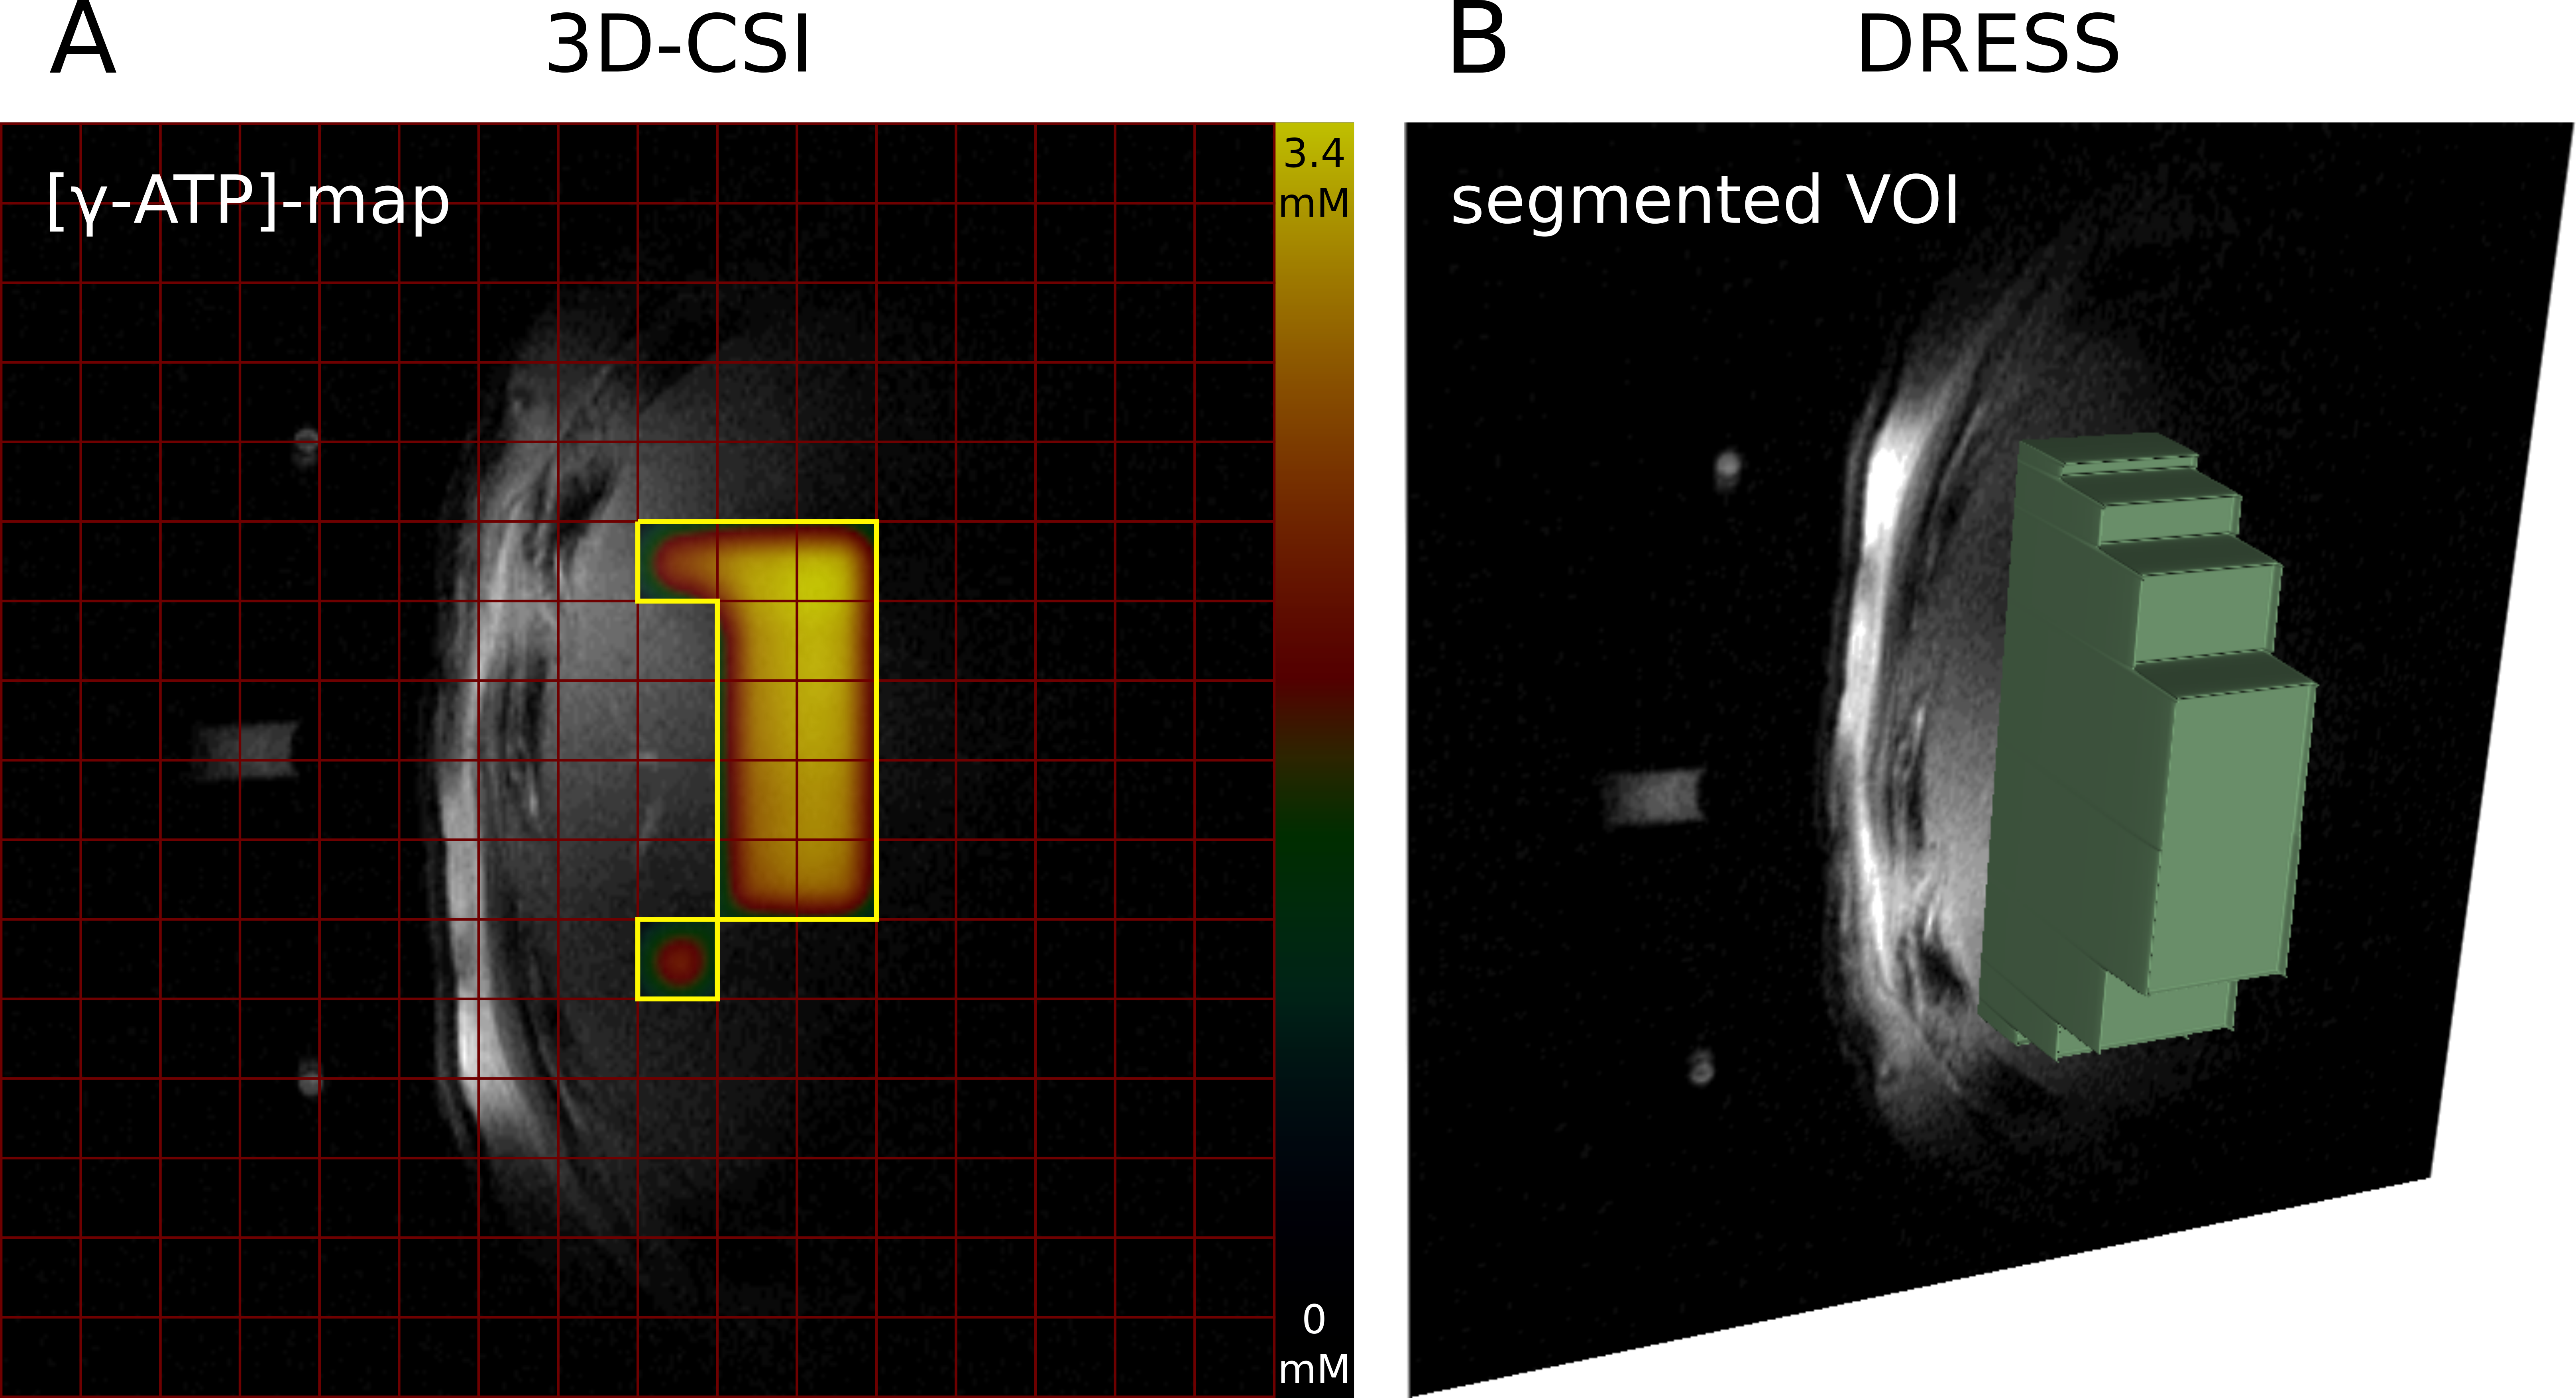
Figure 2: Central transversal images with the VOIs of the 3D-CSI (A, yellow framed voxels) and DRESS acquisition (B, green disk-shaped segmentation) depicted. The γ-ATP concentration distribution is overlain in the yellow framed area of A.
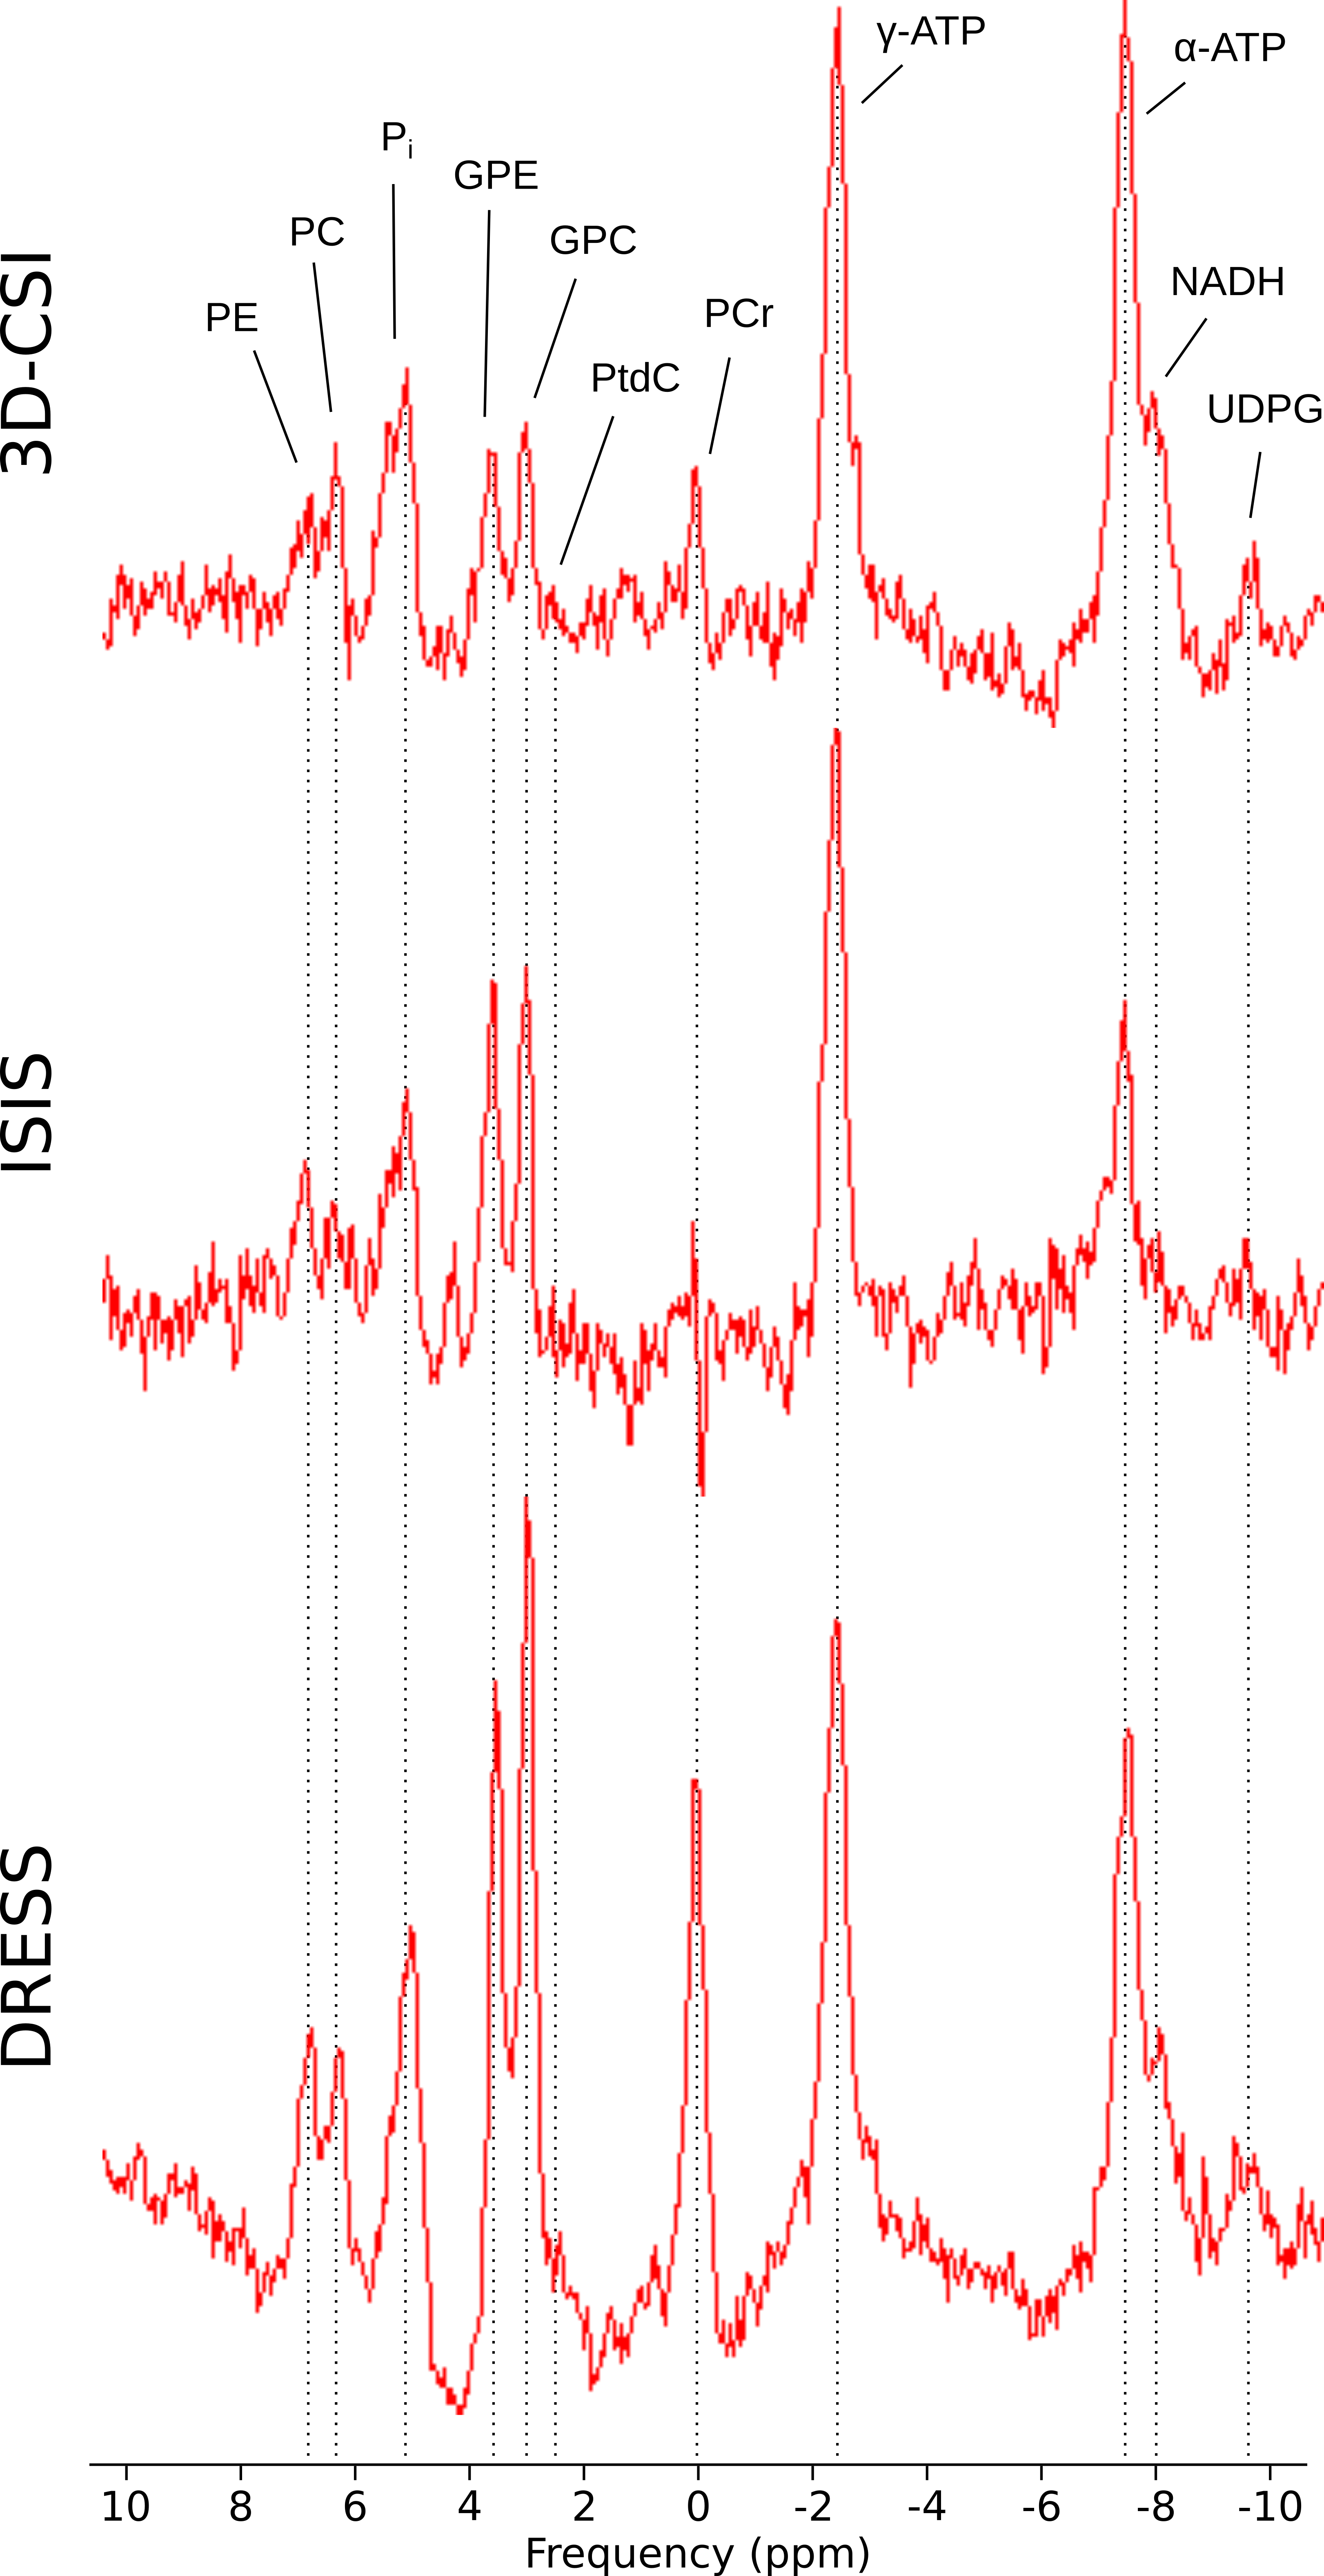

Table 1: Mean ± SD of the VOIs and 31P metabolite concentrations of the four subjects per acquisition method. All concentrations are given in mM.