1150
A spectrally interleaved magnetic resonance spectroscopic imaging sequence incorporating semi-adiabatic pulses at ultrahigh field1Biomedical Engineering and Imaging Institute, Icahn School of Medicine at Mount Sinai, New York, NY, United States, 2Radiology and Neurology, New York University, New York, NY, United States, 3Radiology, New York University, New York, NY, United States
Synopsis
A spectrally-interleaved semi-adiabatic magnetic resonance spectroscopic imaging sequence was developed to simultaneously acquire water and metabolite resonances within the same repetition time. A water interleave enables eddy current correction, absolute quantification through water reference and thermometry using empirically-derived formulae based on chemical shifts of temperature-sensitive water and temperature-insensitive metabolites. The sequence successfully acquired both 1-minute single voxel and 4-minute multi-voxel acquisitions in phantom and in vivo, producing temperature estimates of 21.2 °C, and 35.7 °C, respectively. LCModel fitting of metabolites provided reliable fitting of multiple metabolite peaks including separation of glutamate and glutamine.
Introduction
Magnetic resonance spectroscopic imaging at ultrahigh field receives dual benefits of proportionally higher signal-to-noise ratio and spectral separation. However, scanning at ultrahigh field poses technical challenges, such as B1-inhomogeneity, for which B1-insensitive adiabatic refocusing pulses have emerged as popular solutions. Metabolites at ultrahigh field tend to experience faster t2* relaxation but slower t1 relaxation, such that maximizing signal requires significant “dead time” between readouts and following excitations. Spectral interleaving capitalizes on this available time by applying two sets of narrow-band excitations at non-overlapping frequency ranges during the same repetition. i.e., interleaving a frequency band exciting brain metabolites followed by a second band nutating the water signal. This approach can serve two important applications: 1) It can provide a reference unsuppressed water signal useful for eddy current correction or absolute quantification of metabolite signal by fitting programs such as LCModel. 2) The frequency shift between temperature-insensitive metabolite resonances (e.g. the methyl resonance of neuronal N-acetylaspartate (NAA) c.a. 2.02 ppm) and the temperature-sensitive resonance of hydrogen bound water can be used to perform non-invasive thermometry. Among adiabatic pulse sequences, SASSI is uniquely suited for interleaving because the spatial-spectral pulses are spectrally-selective and achieve significantly lower specific absorption rates (SAR) than other approaches like semi-LASER. The SASSI sequence can maintain a repetition time under two seconds and remain well within SAR limits even with the inclusion of a second interleaved frequency band, which can be a limiting factor at ultrahigh field. This study presents an interleaved spectroscopy sequence implementing low-SAR adiabatic pulses to acquire metabolite and unsuppressed (partially-excited) water signal in a single repetition.Materials & Methods
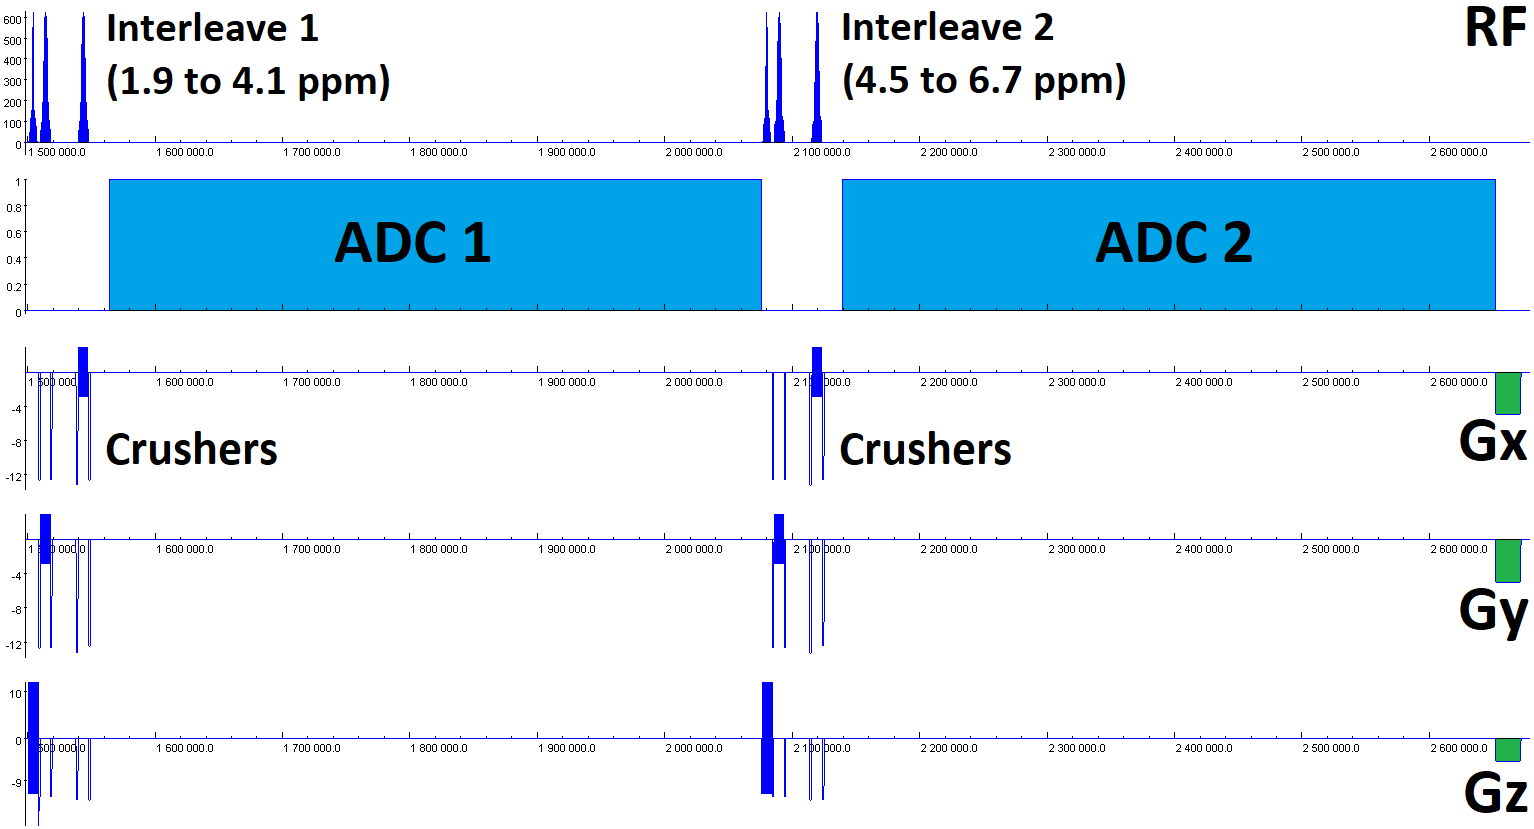
Figure 1 shows the interleaved SASSI pulse sequence diagram, which is capable of being run both as a single voxel sequence (SVS) and chemical shift imaging (CSI). The sequence implemented narrow-band adiabatic refocusing pulses generated through the adiabatic Shinnar-Le Roux algorithm. The pulses (spatial/spectral responses shown in figure 2) had 8 ms duration, 660 Hz bandwidth (2.2 ppm at 7T) such that one interleave ran from 1.9 to 4.1 ppm to capture metabolites while the other ran from 4.5 ppm to 6.7 ppm to capture water. The center frequency of the spectral interleaves are user-selectable using the delta frequency field built into the sequence special card, though these ranges should be spaced at least 0.2 ppm apart to account for pulse transition bands. The water interleave was run at low flip angle (5 degrees, modulating the amplitude of the excitation pulse) for faster t1 relaxation. The sequence was applied in a brain phantom and in the occipital lobe of a healthy volunteer (female, age 25) with scan parameters as follows: TE/TR = 31ms/2000ms, two interleaved acquisitions of 4000 Hz bandwidth, 2048 complex points and 512ms duration each. The SVS had 32 averages for a 1-minute scan time, voxel size = 2.5x2.5x2.5 cm3. The CSI sequence had 4x4 spatial resolution, 8x8 cm2 field of view and 2 cm slice thickness and 8 averages for a 4-minute scan time. Acquired data were post-processed through a custom Matlab-based reconstruction algorithm, which performed coil combination, averaging, Fourier transform and baseline correction. The resulting data was processed using the LCModel prior-knowledge based fitting algorithm using the interleaved unsuppressed water signal to perform absolute metabolite quantification.Results
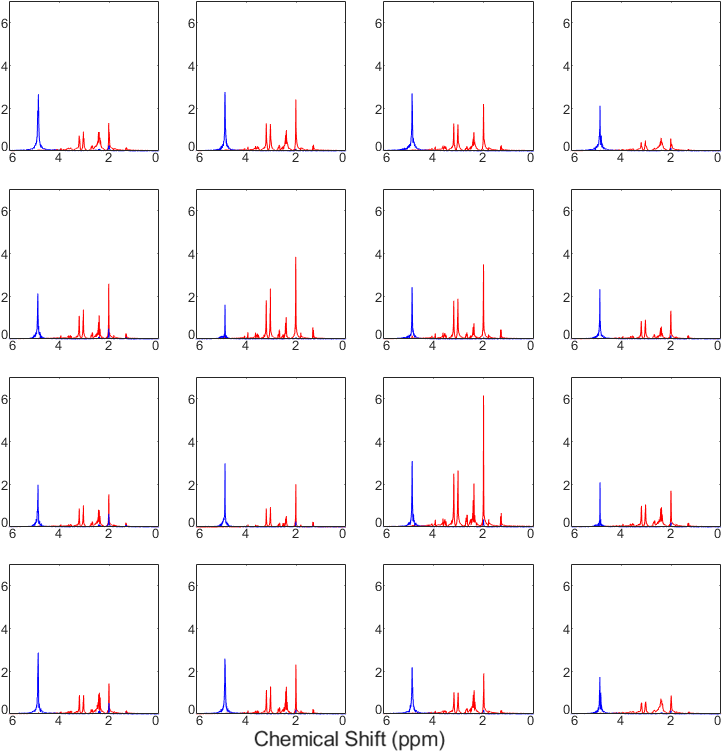
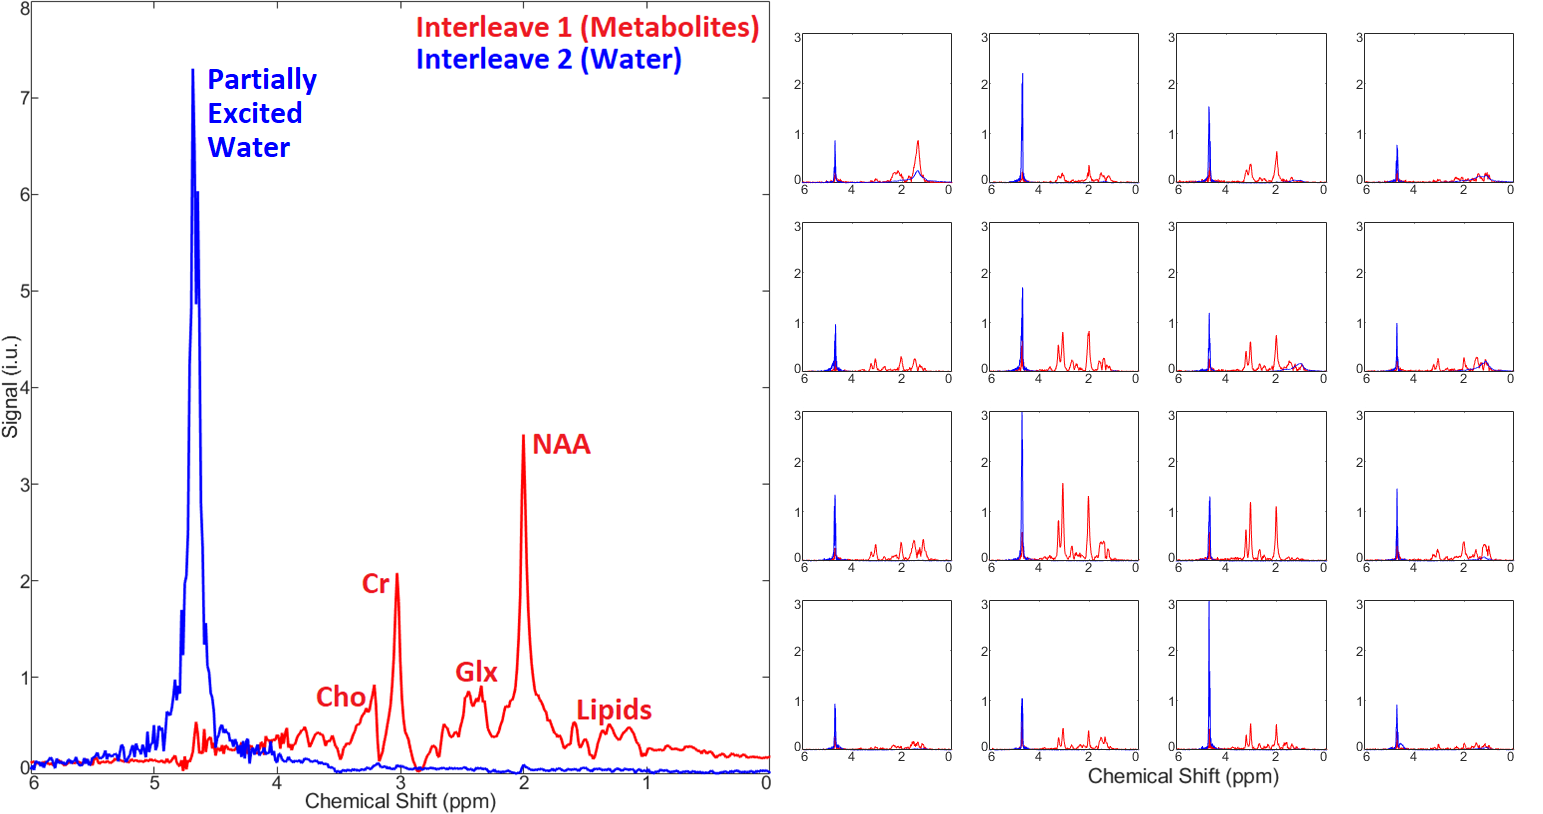
Figure 3 shows a CSI with interleaved spectra from the brain phantom. Interleave 1, covering metabolites over the range of 1.9 to 4.1 ppm, is shown in red, while interleave 2, covering only water over the range of 4.5 to 6.7 ppm, is shown in blue. Figure 4 shows the same type of CSI grid as well as a single voxel acquisition from the occipital lobe of a healthy volunteer. Metabolite peaks due to NAA, creatine (Cr), choline (Cho), myo-Inositol (mI), and the combination of glutamate and glutamine (Glx) are labeled in the single voxel scan, though the same peaks are also detectable within the CSI grid. The Glx component peaks of glutamate and glutamine were partially separable in the SVS acquisition, and LCModel fitting of this spectrum showed high-confidence fits for both individual metabolites. Figure 5 shows the LCModel processing of the human SVS study, showing reliable quantification of several metabolites. Across all phantom and human studies SAR values measured by the scanner remained under 20% of the maximum limit. Chemical shifts for NAA were referenced to 2.02 in phantom and 2.02 in vivo, whereas water chemical shift was 4.85 and 4.70, respectively. Using thermometry formulae derived by Covaciu et. al. 2010, [temperature = -97.134*(δWater-δNAA)+296.068], the midline temperature estimate was calculated as 35.7 °C for human and 21.2 °C for phantom studies.Discussion
The SASSI sequence achieves sufficient spectral selectivity that metabolite and water signal can be acquired in interleaved acquisitions in vivo. Combined with the SNR and spectral selectivity advantages at ultrahigh field, this sequence can capture subtle chemical shift changes between the water and temperature-independent references signals concurrently and free of potential confounds related to interscan motion or frequency offsets in MR thermometry applications. Future development of the sequence will implement an echo-planar spectroscopic imaging (EPSI) version of the sequence for faster spatial acquisition to enable potential 3D spectroscopic imaging applications in a reasonable scan time.Acknowledgements
The authors would like to acknowledge funding from NIH R01 MH109544. The authors would also like to thank Mackenzie Langan for her contributions to this work.References
1. Feldman, R.E. and P. Balchandani, A semiadiabatic spectral‐spatial spectroscopic imaging (SASSI) sequence for improved high‐field MR spectroscopic imaging. Magnetic resonance in medicine, 2016. 76(4): p. 1071-1082.
2. Balchandani, P., et al., Self‐refocused adiabatic pulse for spin echo imaging at 7 T. Magnetic resonance in medicine, 2012. 67(4): p. 1077-1085.
3. Balchandani, P., J. Pauly, and D. Spielman, Designing adiabatic radio frequency pulses using the Shinnar–Le Roux algorithm. Magnetic resonance in medicine, 2010. 64(3): p. 843-851.
4. Balchandani, P., J. Pauly, and D. Spielman, Interleaved narrow‐band PRESS sequence with adiabatic spatial‐spectral refocusing pulses for 1H MRSI at 7T. Magnetic Resonance in Medicine: An Official Journal of the International Society for Magnetic Resonance in Medicine, 2008. 59(5): p. 973-979.
5. Covaciu, L., et al., Human brain MR spectroscopy thermometry using metabolite aqueous‐solution calibrations. Journal of Magnetic Resonance Imaging: An Official Journal of the International Society for Magnetic Resonance in Medicine, 2010. 31(4): p. 807-814.
Figures