1149
Frequency sweep 31P MR spectroscopic imaging at 7T
Songi Lim1,2, Mark Stephan Widmaier1,2, and Lijing Xin1,3
1CIBM Center for Biomedical Imaging, Lausanne, Switzerland, 2Laboratory for Functional and Metabolic Imaging, EPFL, Lausanne, Switzerland, 3Animal Imaging and Technology, EPFL, Lausanne, Switzerland
1CIBM Center for Biomedical Imaging, Lausanne, Switzerland, 2Laboratory for Functional and Metabolic Imaging, EPFL, Lausanne, Switzerland, 3Animal Imaging and Technology, EPFL, Lausanne, Switzerland
Synopsis
Phase-cycled spectroscopic imaging (PCSI) method was implemented and validated for 31P PCSI imaging at 7T. The PCSI method uses a balanced steady-state free precession sequence with an ultra-low flip angle (<1°) to achieve sharp passband with 2.52-ms of TR, which enable to accelerate the acquisition. With prior knowledge of 31P spectra, it is feasible to acquire major 31P peaks by changing the frequency offset and non-uniform phase sweeping instead of acquiring full spectra uniformly. To investigate feasibility of the method, a multi-compartment KH2PO4 phantom with in vivo equivalent concentrations was prepared and 31P PCSI was compared with conventional FID-CSI.
Introduction
Phase-cycled spectroscopic imaging (PCSI) has been introduced to accelerate 1H MR spectroscopic imaging acquisition time and simplify suppression and reconstruction procedures in clinical settings by using a balanced steady-state free precession (bSSFP) with an ultra-low flip angle (< 1°) at 3T1. This method relies on extremely narrow excitation profiles of bSSFP, which only excites on-resonance peak with less than 5 Hz of bandwidth. Instead of modifying transmit frequency, it uses phase shift of RF pulse to sweep the central position of the passband and to excite off-resonance peaks. Since the flip angle is very low, it is free from SAR issue for clinical applications. Unlike 1H MRS spectra, 31P spectra has a smaller number of resonance peaks spread over a range from 6 ppm to -17 ppm covering from Pi to β-ATP. Therefore, instead of sampling uniformly the whole phase cycle by 1° to acquire fully spectra, it is possible to perform dense sampling for only the target metabolites of interest selectively based on prior knowledge in chemical shifts of metabolites to decrease total scan time. The goal of the study is to implement 31P-PCSI and to validate its feasibility at 7T.Materials and methods
Simulations were performed to find the optimized flip angle for reaching the highest signal intensity and to acquire the transvers magnetization profile using MATLAB. 31P PCSI was implemented on a 7T/68cm MR scanner (Magnetom, Siemens Medical Solutions, Erlangen, Germany) and all MR measurements were performed with a surface coil with two 1H channels and single loop 31P channel. For validation of the method, a KH2PO4 phantom was prepared for 31P PCSI imaging. The 1.5L saline phantom contains two 30mL bottles with 4 mM (pH 6.5) and 2 mM (pH 2) KH2PO4, respectively. Gadovist was added to mimic in vivo PCr and gATP conditions. B0 shimming and voltage calibration were performed before data acquisition to improve field homogeneity and to reach the correct flip angle. The PCSI sequence was performed using the following parameters: TR/TE = 2.52/1.3 ms; FOV = 15×15 cm2; slice thickness = 30 mm; matrix = 16×16; flip angle = 0.28°; spectral bandwidth = 1116 Hz/px; 100 averages; 60 dummy pulses, 41 steps of phase sweeping for each peak by 1° (± 20°), total acquisition time = 5 min 30 s. The reference spectra were acquired using a slice selective FID sequence (TR/TE = 15000/2.3 ms, average = 15, spectral bandwidth = 2000 Hz). For comparison with PCSI, conventional CSI data acquisitions were performed using FID-CSI sequence with the following parameters: TR/TE = 1500/2.3 ms; FOV = 15×15 cm2; slice thickness = 30 mm; matrix = 16×16; flip angle = 90°, spectral bandwidth = 1000 Hz; average = 2 and 15; 4 dummy scans; hamming weighted phase encoding, total acquisition time = 4 min 45 s and 20 min. The PCSI data were reconstructed and processed using MATLAB. Metabolite maps was created using linear interpolation (scale factor of 3) and overlaid on the reference image.Results
The optimum flip angle to achieve maximum signal intensity was simulated and presented in Figure 1 (top). The transverse magnetization profile at the optimized flip angle (0.28°) is presented in Figure 1 (bottom). The reference spectrum acquired using a slice selective FID sequence is illustrated in Figure 2 (left) from a slice shown in yellow, which corresponds to the slice for 2D 31P FID-CSI and PCSI. The spectra acquired using 31P FID-CSI with different number of averages are shown in Figure 3. The voxels were chosen based on the signal intensity of the spectra, which show the highest signal intensity. The representative spectra and reconstructed 31P PCSI maps are illustrated in Figure 4.Discussion and conclusion
In this study, we implemented PCSI for 31P MRSI and its feasibility of was investigated. With 1/4 of the acquisition time, 31P PCSI shows much better SNR than FID-CSI with 15 averages. For in vivo spectra, e.g. 5 peaks (Pi, PCr, γ-ATP, α-ATP, and β-ATP) need to be measured, using the same condition, the total acquisition time will be extended from 5 min 30 s to 14 min. Besides reduced SAR, another advantage of PCSI is that it does not suffer from chemical shift displacement error due to the changes of transmitting frequency per peak. The main limitation of this method is its high susceptibility to B1 inhomogeneity to satisfy the ultra-low flip angle condition. Also, bSSFP is affected by T1/T2 ratio, which needs to be taken into account for the quantification. We conclude that PCSI is a fast and efficient method for 31P spectroscopic imaging and it is feasible for 31P metabolite mapping at 7T.Acknowledgements
This work was supported by the Swiss National Science Foundation (grants n° 320030_189064). We acknowledge access to the facilities and expertise of the CIBM Center for Biomedical Imaging, a Swiss research center of excellence founded and supported by Lausanne University Hospital (CHUV), University of Lausanne (UNIL), Ecole polytechnique fédérale de Lausanne (EPFL), University of Geneva (UNIGE) and Geneva University Hospitals (HUG).References
1. Guo J, Patay Z, Reddick WE. Fast frequency-sweep spectroscopic imaging with an ultra-low flip angle. Sci Rep. 2016;6:1-14. doi:10.1038/srep30066Figures
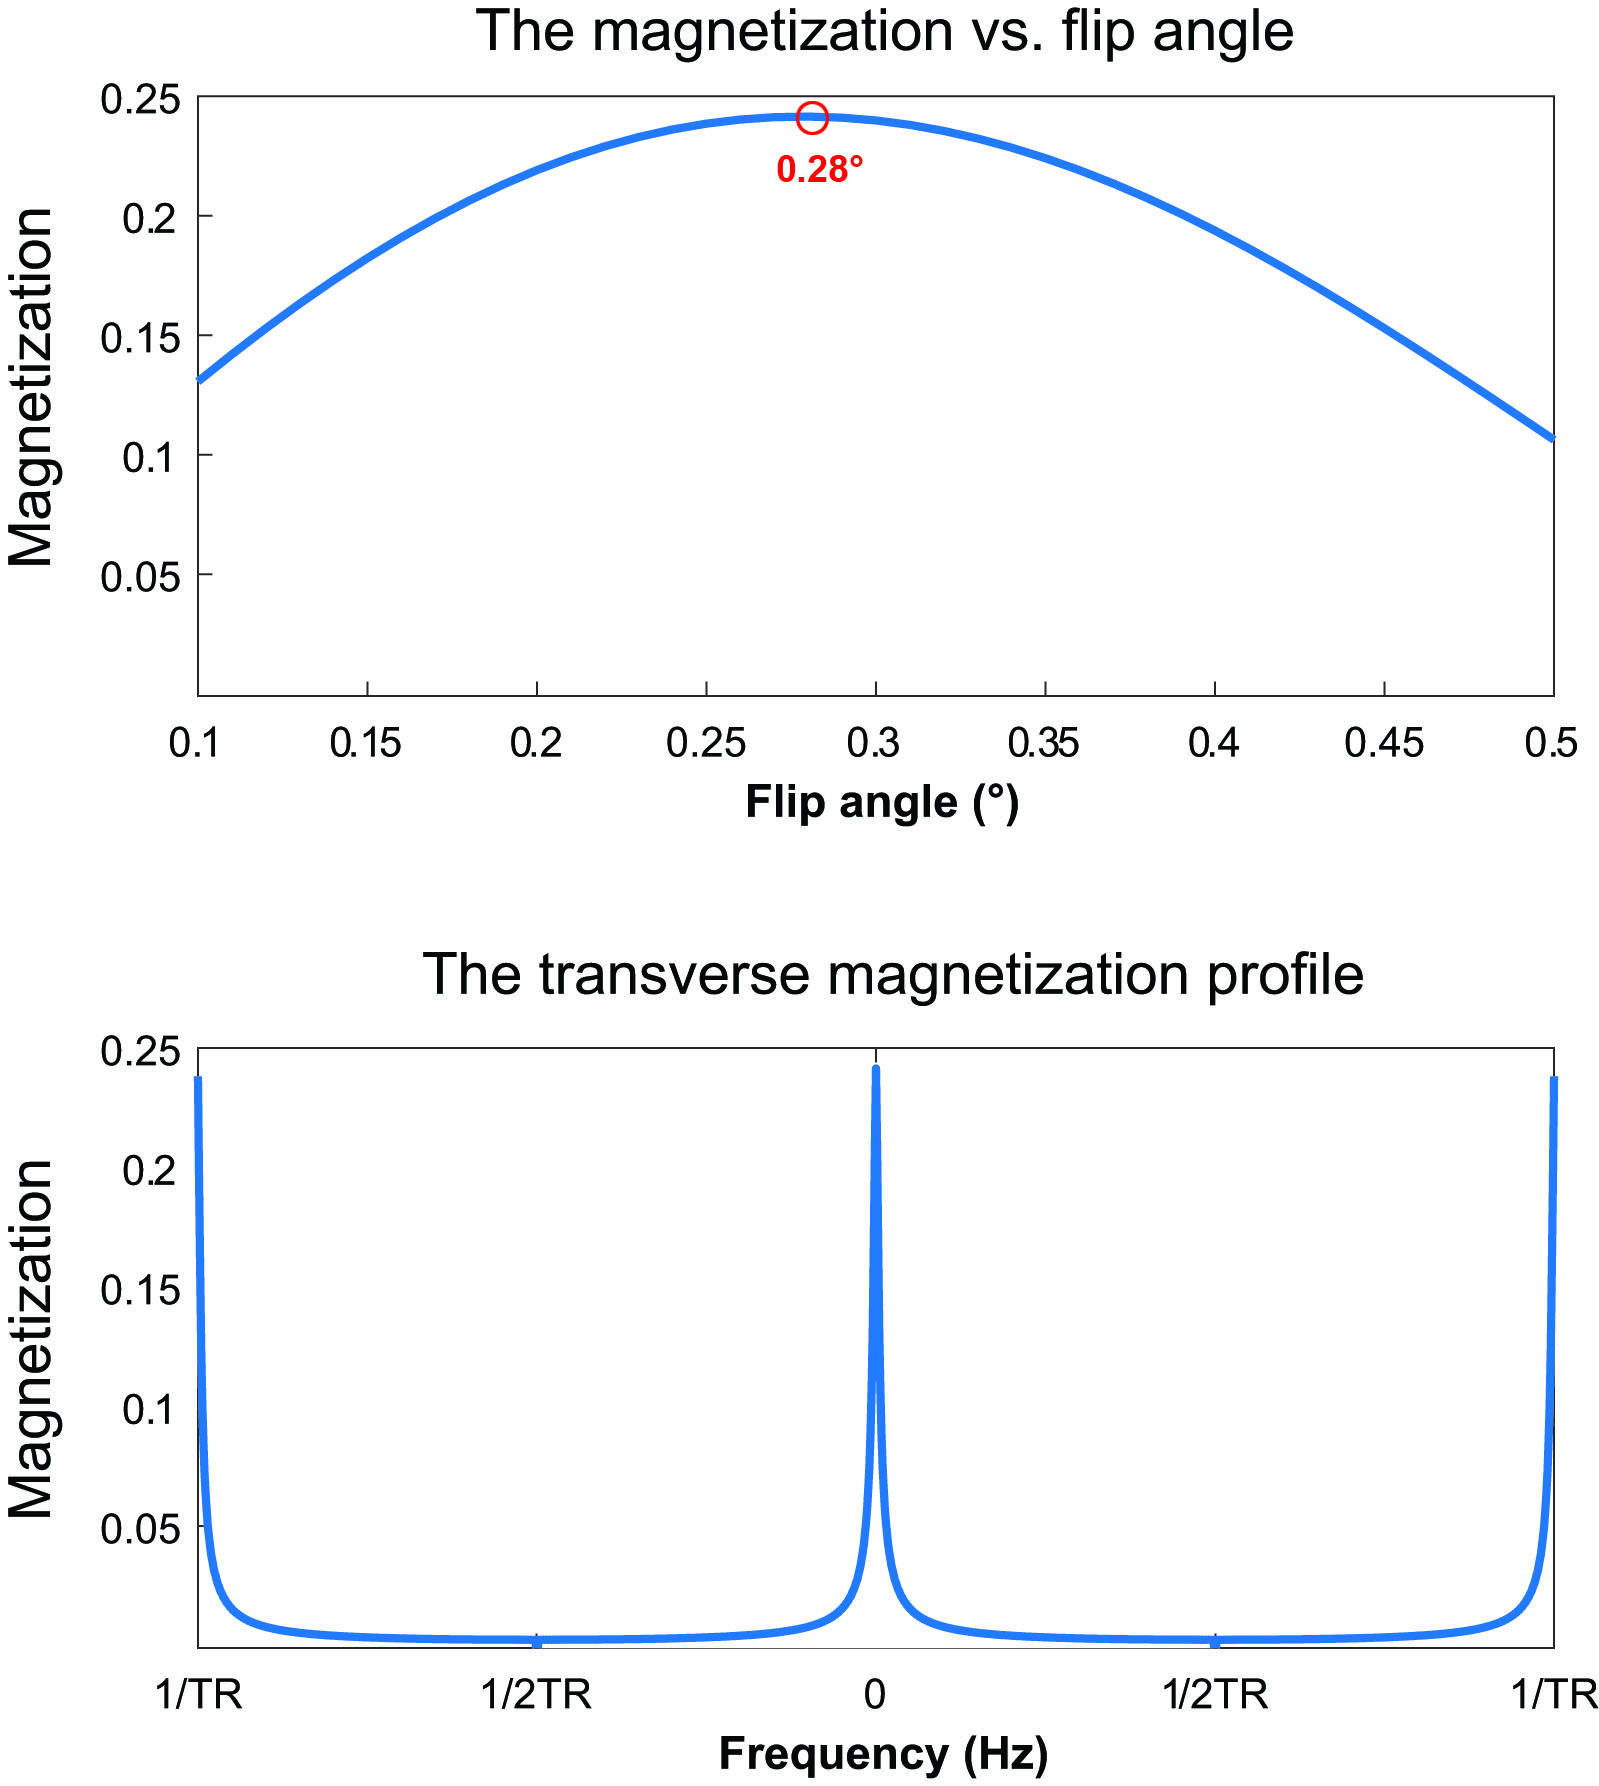
Figure 1. The
simulated transverse magnetization as a function of flip angles to determine an
optimized flip angle for the maximum signal intensity (top) and the transverse magnetization
profile of bSSFP as 0.28° of flip angle (bottom).

Figure 2. (left)
Representative 31P MR spectra acquired using a slice selective FID sequence
(left) and the slice position (center and right).
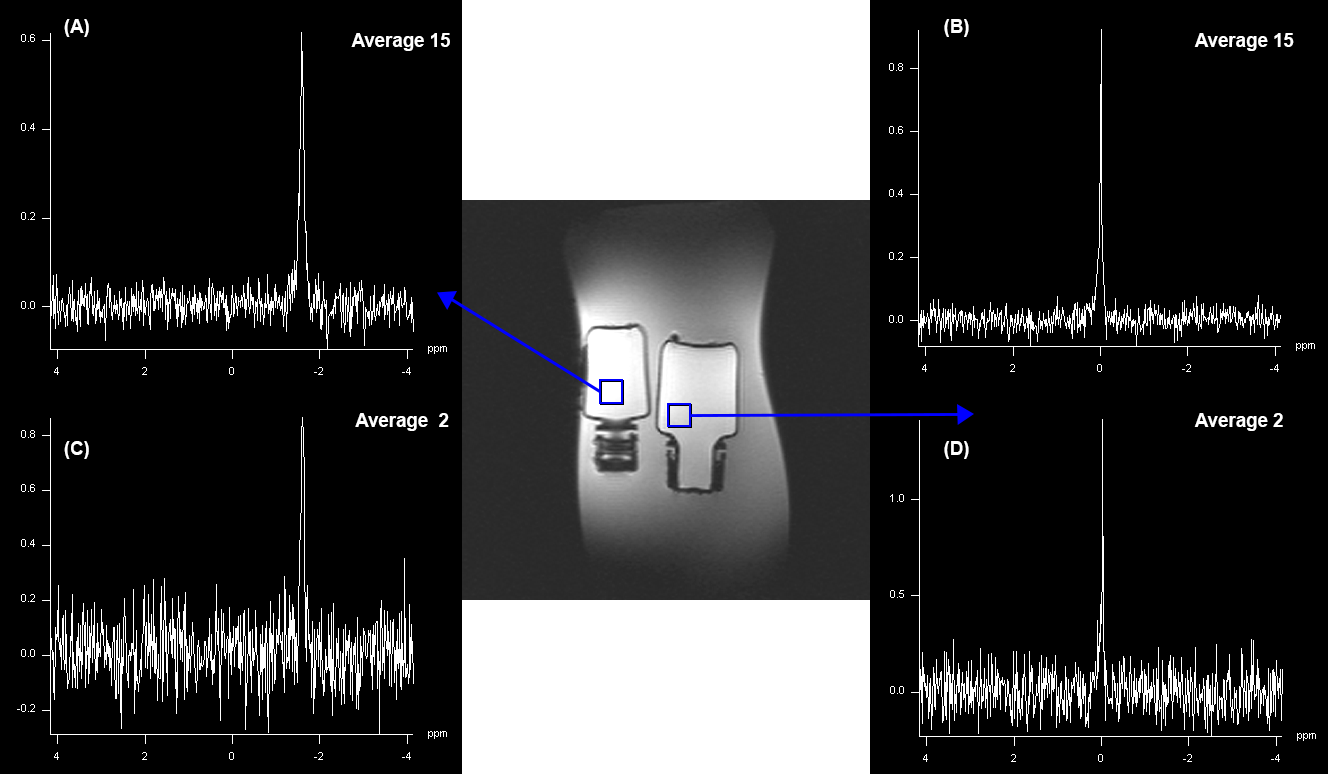
Figure 3.
Representative conventional 31P FID-CSI spectra and reference image
(center) with the voxel positioning within the 16 × 16 CSI grid. (A, C) shows
spectra from the left bottle with 15 and 2 averages each. (B, D) shows spectra
acquired from the right bottle with 15 and 2 averages in order.
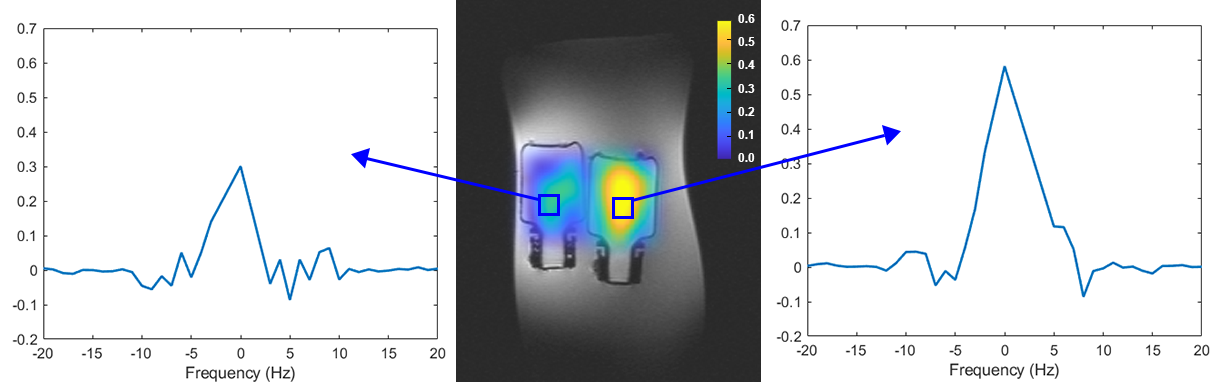
Figure 4. Representative
31P PCSI spectra (left and right) and the reference image with
overlaid 31P PCSI maps (center).
DOI: https://doi.org/10.58530/2022/1149