1145
The impact of optimal RF coil-combination on whole-brain sub-millimetre resolution perfusion imaging at 7T1Techna Institute, University Health Network, Toronto, ON, Canada, 2Department of Cognitive Neuroscience, Maastricht University, Maastricht, Netherlands, 3Aix-Marseille Universite, CNRS, CRMBM, Marseille, France, 4Institute for Systems Neuroscience, Universitätsklinikum Hamburg-Eppendorf, Hamburg, Germany, 5Techna Institute & Koerner Scientist in MR Imaging, University Health Network, Toronto, ON, Canada, 6Center for Neuroscience Imaging Research, Institute for Basic Science & Department of Biomedical Engineering, Sungkyunkwan University, Suwon, Korea, Republic of
Synopsis
In this work, we use 3D-EPI ASL to acquire perfusion maps of the human brain at an unprecedented spatial resolution of 0.7 mm isotropic at 7T. This multi-session, single-subject ASL dataset offers a unique opportunity to investigate the cortical distribution of baseline perfusion across and within brain areas, as well as studying the physiological basis for the interpretation of laminar and columnar fMRI. In this abstract, we use an open-source, memory-efficient, CPU/GPU accelerated coil-combine Python toolbox to probe the impact of using covariance-weighted sum-of-squares (CovSoS) and tSNR optimised RF coil-combination (STARC) on high-resolution perfusion imaging at 7T.
Introduction
Arterial spin labelling (ASL) is a non-invasive MRI perfusion mapping technique[1]. Due to its inherently low signal-to-noise ratio (SNR), there is little wiggle room to trade for higher spatial resolution ASL in reasonable acquisition times at ≤ 3T[2]. However, ASL benefits from the SNR gain from the B0, and longer T1 (longer post-labelling delays) at ultra high-field (UHF≥7T)[3] together with optimised RF pulses[4], sequences[5,6], 3D-EPI readouts[7], and dielectric pads[8]. Combining these optimisations and building upon earlier work[9], we have achieved whole-brain 0.7 mm isotropic human perfusion maps in a single-session at 7T. One method to improve temporal SNR (tSNR) of high thermal noise acquisitions at UHF is using optimal RF coil-combination strategies[10,11]. Here, we investigate the impact of noise covariance-weighted root sum-of-squares (rCovSoS) and STAbility-weighted RF-coil Combination (STARC)[12] compared to standard reconstruction on a single-session dataset.Methods
All data were acquired on a Siemens Magnetom 7T using a 32Rx/1Tx coil (Nova Medical). Following informed consent, a healthy female volunteer participated in this study involving twelve separate sessions of data collection. Each session lasted ~2 hours and consisted of at least six 10-min runs of 0.7 mm isotropic 3D-EPI ASL slabs positioned such that they collectively cover the entire brain. The slabs overlap with each other ensuring continuity (i.e., no gaps) in the coverage (Fig 1a). Improved inversion (and labelling efficiency) was achieved using an optimised tr-FOCI pulse[4] and using two 18x18x0.5 cm3 CaTiO3 dielectric pads[8] placed on both sides at the temporal lobes. ASL data were acquired with a FAIR QUIPSS II labelling scheme[13] and 3D-EPI readout[14] (36 slices, GRAPPA 4, TE/TI1/TI2/TR=16/700/1890/3000 ms, TA=10:30 min). Readout-matched whole-brain M0 images (TR=12.55s, 192 slices) and MI-EPI[15] T1map (128 slices, 64 TIs, slab slice =2, TI1/TE/TR=175/19/9337 ms). A 0.7 mm isotropic MP2RAGE[16] (240 slices, GRAPPA 2, TE/TI1/TI2/TR= 2.47/900/2750/5000 ms, α1/α2=5°/3°) was used as anatomical reference. rCovSoS and STARC algorithms implemented in MCT (Fig. 2) were used to retro-reconstruct the uncombined ASL data from one session. A noise covariance matrix was calculated for each slab from the coil noise calibration scan obtained at zero flip angle. Unlike in BOLD signal applications, the STARC weights were optimised separately for the tag and label volumes in order to optimise the tSNR of perfusion modulation. Pre-processing of one ASL session and slab-stitching were carried out using ANTs[17], and the registration quality was visually inspected. Two axial slices on either edge of each ASL slab were discarded to remove realignment-related reslicing artefacts. The MI-EPI T1map was registered to MP2RAGE T1 map using SyN for visualisation. Perfusion-weighted maps were obtained using the temporal mean of the control-label difference, and absolute perfusion-weighted maps were obtained by dividing the perfusion-weighted map by the mean EPI. Laminar analyses were carried out using LAYNII[18].Results
The multiple high-resolution ASL slabs (in colour-code, Fig 1a) were stitched together to achieve whole-brain coverage (Fig. 1b). Fig 3a shows that even in a single 7T session, stitching several ~10 min 0.7 mm isotropic 3D-EPI ASL slabs can yield robust perfusion results, independent of the RF coil-combination used. The differences between the reconstruction methods were quantified as a percentage increase in signal relative to the rSoS data. In Fig 3b, this difference is visualised for the GM ribbon to illustrate the gains that were less obvious in the perfusion maps in Fig 3a. STARC results in marginally higher gains compared to the rCovSoS as can be seen with increase in yellow-coloured voxels in Fig 3b, likely driven by the relative increase in perfusion tSNR from the advanced reconstructions (Fig 3c). The laminar analysis revealed similar perfusion-weighting across depths (Fig 4a) for all coil-combination methods. Differences in the absolute perfusion weighting can be seen at the CSF-GM interface (Fig 4b).Discussion
Although here we present results from a single session, we have twelve repeat sessions of the ‘whole-brain’ acquisition in the same subject. Together, this work presents the highest-resolution whole-brain human brain perfusion data till date. The 3D-EPI readout used here offers inherently higher temporal efficiency, tSNR and spatial coverage compared to 2D-EPI. The spatial inhomogeneity observed in the perfusion maps is driven by B1+ inhomogeneities wherein the low B1+ (despite the dielectric pads) prevents adequate labelling resulting in poor perfusion measures in the inferior temporal lobes. While tSNR is not the only barometer of image quality, we observe benefits of optimal RF coil-combinations (Fig 3c) to perfusion imaging. The differences at the CSF-GM interface in Fig 4b can be attributed to the fact that there is little to no perfusion tSNR in CSF voxels[19], and that STARC (optimising for perfusion tSNR) penalises the temporally unstable voxels. Next steps involve additional analyses to improve the perfusion SNR of the data by retro-reconstructing data from all sessions to ameliorate the effects of thermal noise by averaging; comparisons in smaller, localised brain regions, and making the high SNR, high-resolution perfusion maps available to the community.Acknowledgements
The study was supported by the Netherlands Organisation for Scientific Research (NWO) VIDI grant (452-11-002).References
[1] Detre, JA, 10.1002/nbm.1940070112; [2] Ivanov, D, 10.1016/j.neuroimage.2017.05.038; [3] Pfeuffer, J, 10.1002/mrm.10154; [4] Hurley, AC, 10.1002/mrm.22167; [5] Gardener & Jezzard, 10.1002/mrm.25333; [6] Ivanov, D, 10.1002/mrm.26351; [7] Hall, E, Proc. ISMRM 2010 #0517; [8] Teeuwisse, WM 10.1002/mrm.24176; [9] Ivanov, D, Proc. ISMRM 2018 #2301; [10] Triantafyllou, C, 10.1016/j.neuroimage.2010.11.084; [11] Kashyap, S Proc. ISMRM 2018 #5442; [12] Huber, L Proc. ISMRM 2017 #0586; [13] Wong, E 10.1002/mrm.191039050; [14] Poser, B 10.1016/j.neuroimage.2010.01.108; [15] Renvall, V 10.1016/j.neuroimage.2016.04.004; [16] Marques, J 10.1016/j.neuroimage.2009.10.002; [17] Avants, BB 10.1016/j.neuroimage.2010.09.025; [18] Huber, L 10.1016/j.neuroimage.2021.118091; [19] Kashyap, S 10.1371/journal.pone.0250504
Figures
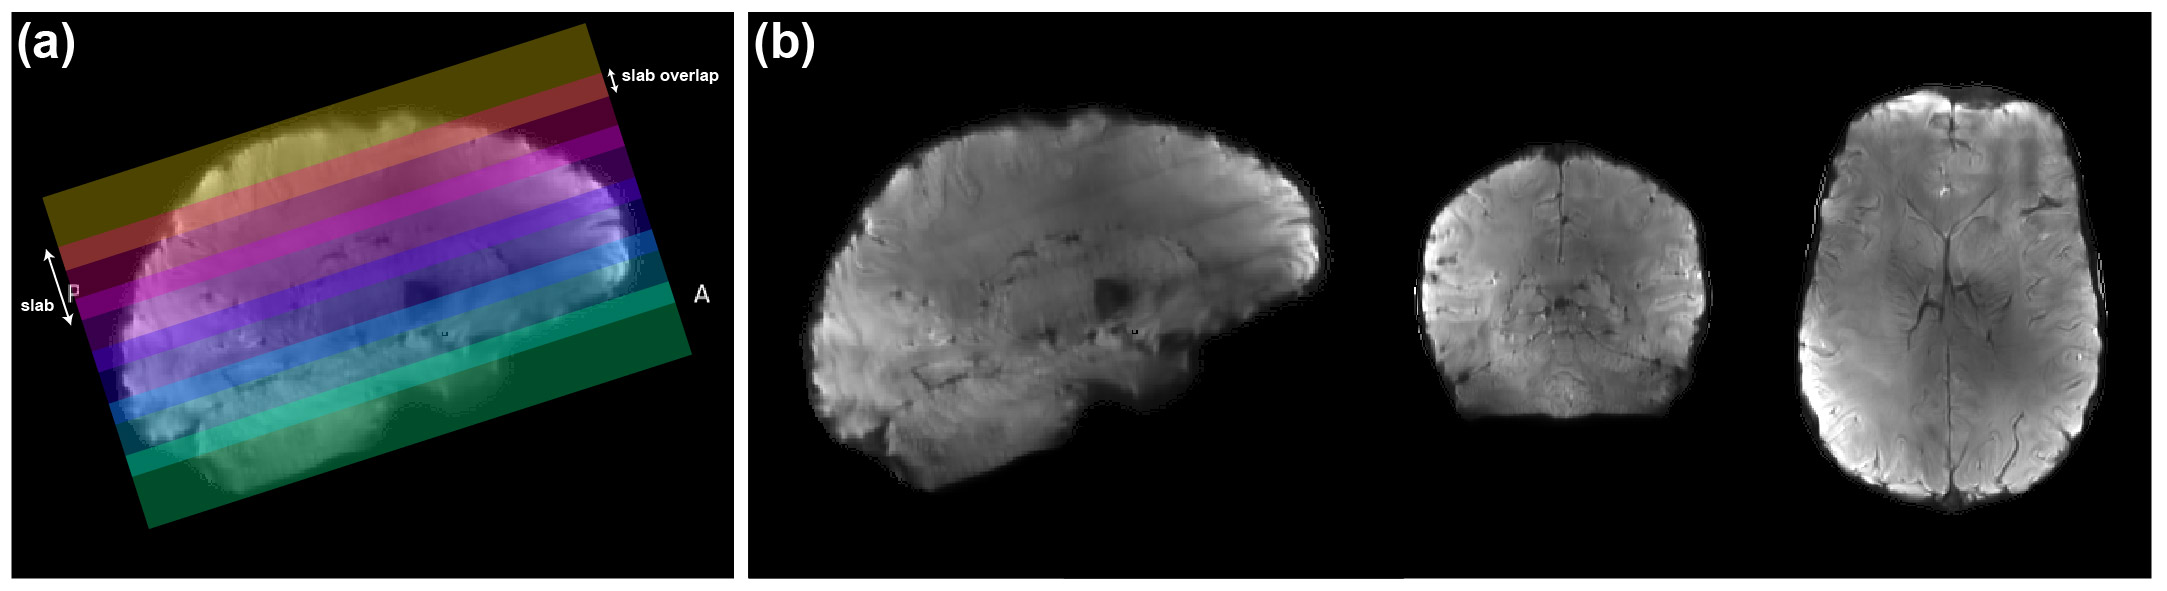
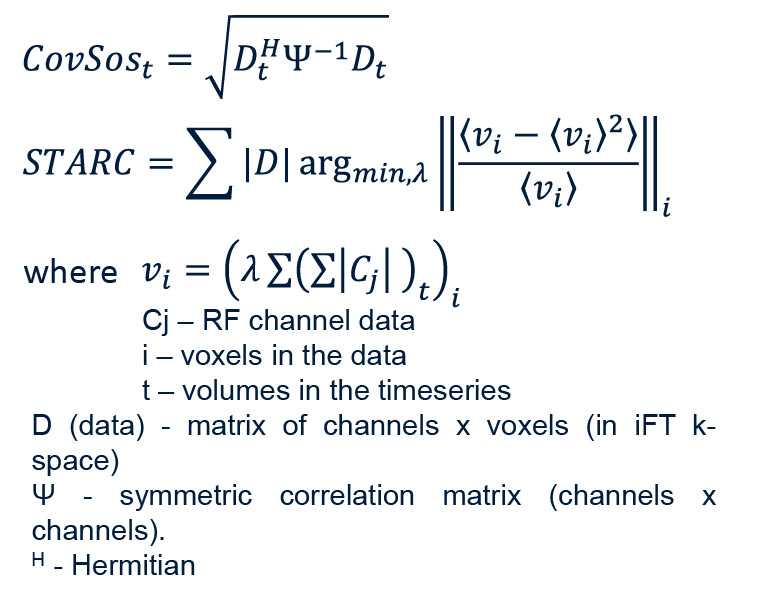
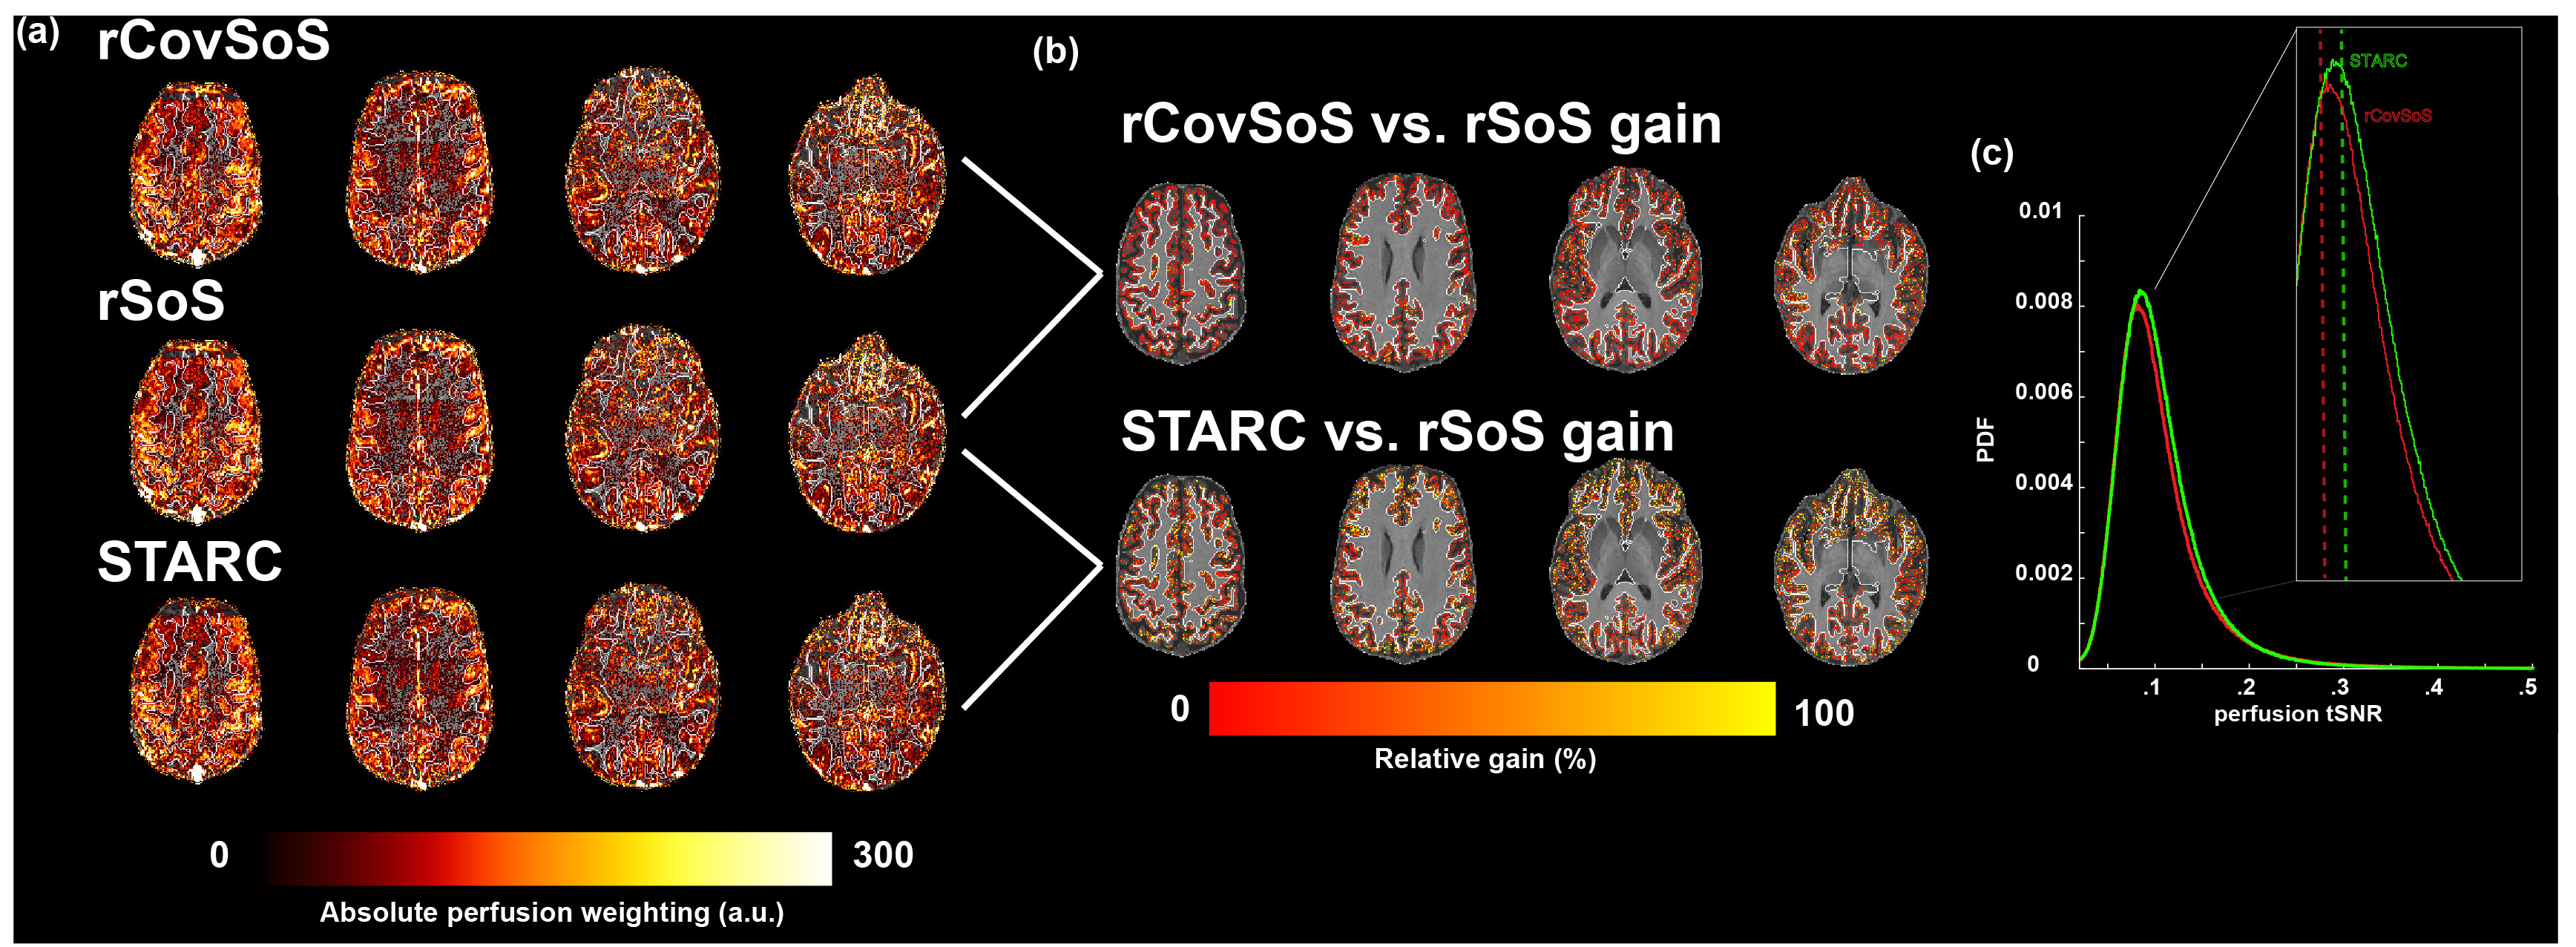
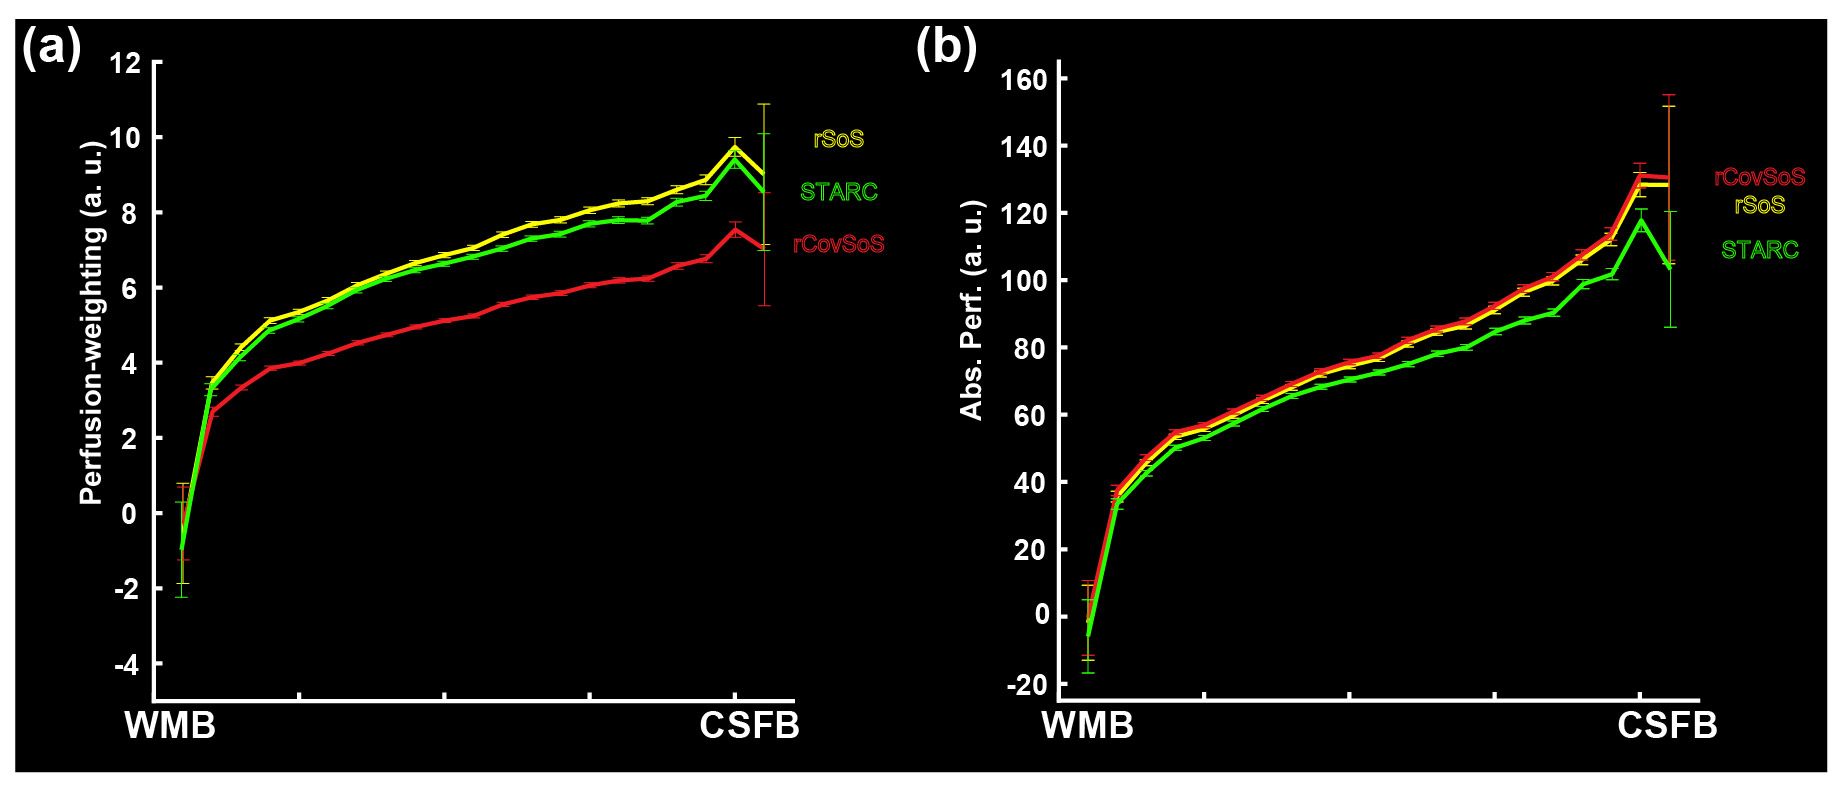
Fig. 4. For the three different reconstructions, laminar profiles averaged across GM are shown for (a) perfusion-weighting, and (b) absolute perfusion-weighting (after normalisation with the mean EPI) (see definitions in [3]).