1144
Comparison of pCASL, DSC and FAIR for Cerebral Perfusion in Rats @9.4T1Medical Physics Group, Institute of Diagnostic Radiology, Jena University Hospital, Jena, Germany, 2Department of Radiology, Leiden University Medical Center, Leiden, Netherlands, 3Grenoble Institut Neurosciences, Univ. Grenoble Alpes, Inserm, U1216, Grenoble, France, 4Hans-Berger Department of Neurology, Jena University Hospital, Jena, Germany
Synopsis
Attaining reproducible, time-efficient, high spatial resolution and quantitative MRI perfusion images in small animal MRI @9.4T is still challenging. To take a step toward this goal, perfusion data from arterial spin labeling (ASL), Flow-sensitive Alternating Inversion Recovery (FAIR), dynamic susceptibility contrast (DSC), and pseudo-continuous arterial spin labeling (pCASL) sequences are compared by assessing cerebral perfusion in 5 rats, each scanned 3 times. Differences in (cerebral blood flow) CBF in major brain regions were analyzed, and the repeatability of perfusion MRI was assessed.
Introduction
Perfusion MRI is widely used clinically to evaluate cerebral perfusion in numerous neurological disorders¹. However, cerebral perfusion of small rodents on ultra-high-field scanners is much less established, and although most methods such as pCASL², FAIR³, or contrast agent-based DSC³ have been implemented on small animal MRIs, there are few evaluations of existing methods in rodents ²⁻⁴. This work compares CBF obtained with pCASL, FAIR, and DSC in a group of 5 healthy rats in 3 repetitions to evaluate systematic differences between the techniques as well as their individual reproducibility.Methods
Animals: 5 adult Wistar rats were each scanned on 3 separate days. Rats were pre-anesthetized with a bolus injection followed by a continuous infusion of Medetomidine in combination with 0.5% isoflurane to minimize the vasodilative effects of isoflurane. Respiration was maintained at 75 bpm±10bpm, and rectal temperature was 36.5±0.5°C at baseline and increased to 38.5±0.5°C during the course of the examination due to the high SAR of the pCASL sequence. Scans were obtained in the following order: FAIR, DSC, and pCASL. All scans were performed on a 9.4T Bruker BioSpec MRI system with a 4 channel-head array.Acquisition Protocol: pCASL acquisition followed published protocols2 including calibration scans. pCASL and FAIR used the same spin-echo EPI: matrix 96x96 with partial Fourier 1.5, bandwidth of 300kHz, and spatial resolution of (0.22x0.22x1) mm3. The pCASL specific parameters were TE=16ms, TR=4000ms, labeling duration 3000ms, 60 repetitions, and TA=8min. The FAIR specific parameters were TE=13.6ms, TR=10000ms, 2 averages, 16 different inversion times each for global and selective inversion, and TA=11min. For the DSC acquisition, a matrix of 90x56 with partial Fourier of 1.2, resolution (0.26x0.26x1) mm3, TE=9.46ms, TR=150ms, BW 300kHz, 800 repetitions, and TA=2min was used. A bolus of 1ml/kg of 1:5 diluted Gd-DTPA was administered via the lateral tail vein after 25s with a bolus length of 2s and flushed with saline.
Post-processing: For pCASL, the measured inversion efficiency and a T1map were used for calibration. FAIR perfusion maps were calculated using Bruker Paravision 6, and pCASL evaluation² was performed in Matlab. For DSC the cerebral blood flow (CBF) maps were calculated via deconvolution with an arterial input function. Regions of interest (ROI) were manually drawn in Freeview5 (see Fig 1a) for each rat and repeat scan and separately for DSC and ASL. DSC-based CBF maps represent relative CBF values in arbitrary units, ASL CBF values are quantitative.
Results
Fig. 1b-d show example parameter maps for DSC, pCASL, and FAIR. The pCASL sequence yields lower noise in the derived CBF maps compared with FAIR, and the visual perfusion contrast between the tissues is best in the pCASL-CBF maps.The empirical cumulative distribution functions (eCDF) of the perfusion values in each ROI is shown in Fig. 2. The eCDF shows the value range and distribution of the different methods and how well the ROI-areas are separated with respect to perfusion. The distributions obtained with pCASL and FAIR are in fair agreement and show CBF increasing from white matter and hippocampus followed by cortex and thalamus. This ranking is, however, changed in the data obtained from DSC, where the hippocampus shows the lowest perfusion of the 4 ROIs.
Figure 3 examines the CBF correlation of pCASL with FAIR and DSC, comparing the median CBF value in each ROI in each animal. In general, CBF was most highly correlated for pCASL and FAIR (Spearman’s r = 0.63 across all animals, compared to r = 0.42 for pCASL vs DSC).
Figure 4 compares the relative agreement between pCASL and FAIR and pCASL and DSC using Bland-Altman plots. FAIR and pCASL agree well across the range of values, but white matter shows much less variation than the other tissues, particularly thalamus and cortex. The lower plot comparing DSC-CBF and pCASL again shows the deviating behavior of white matter with higher apparent perfusion in the DSC-based values.
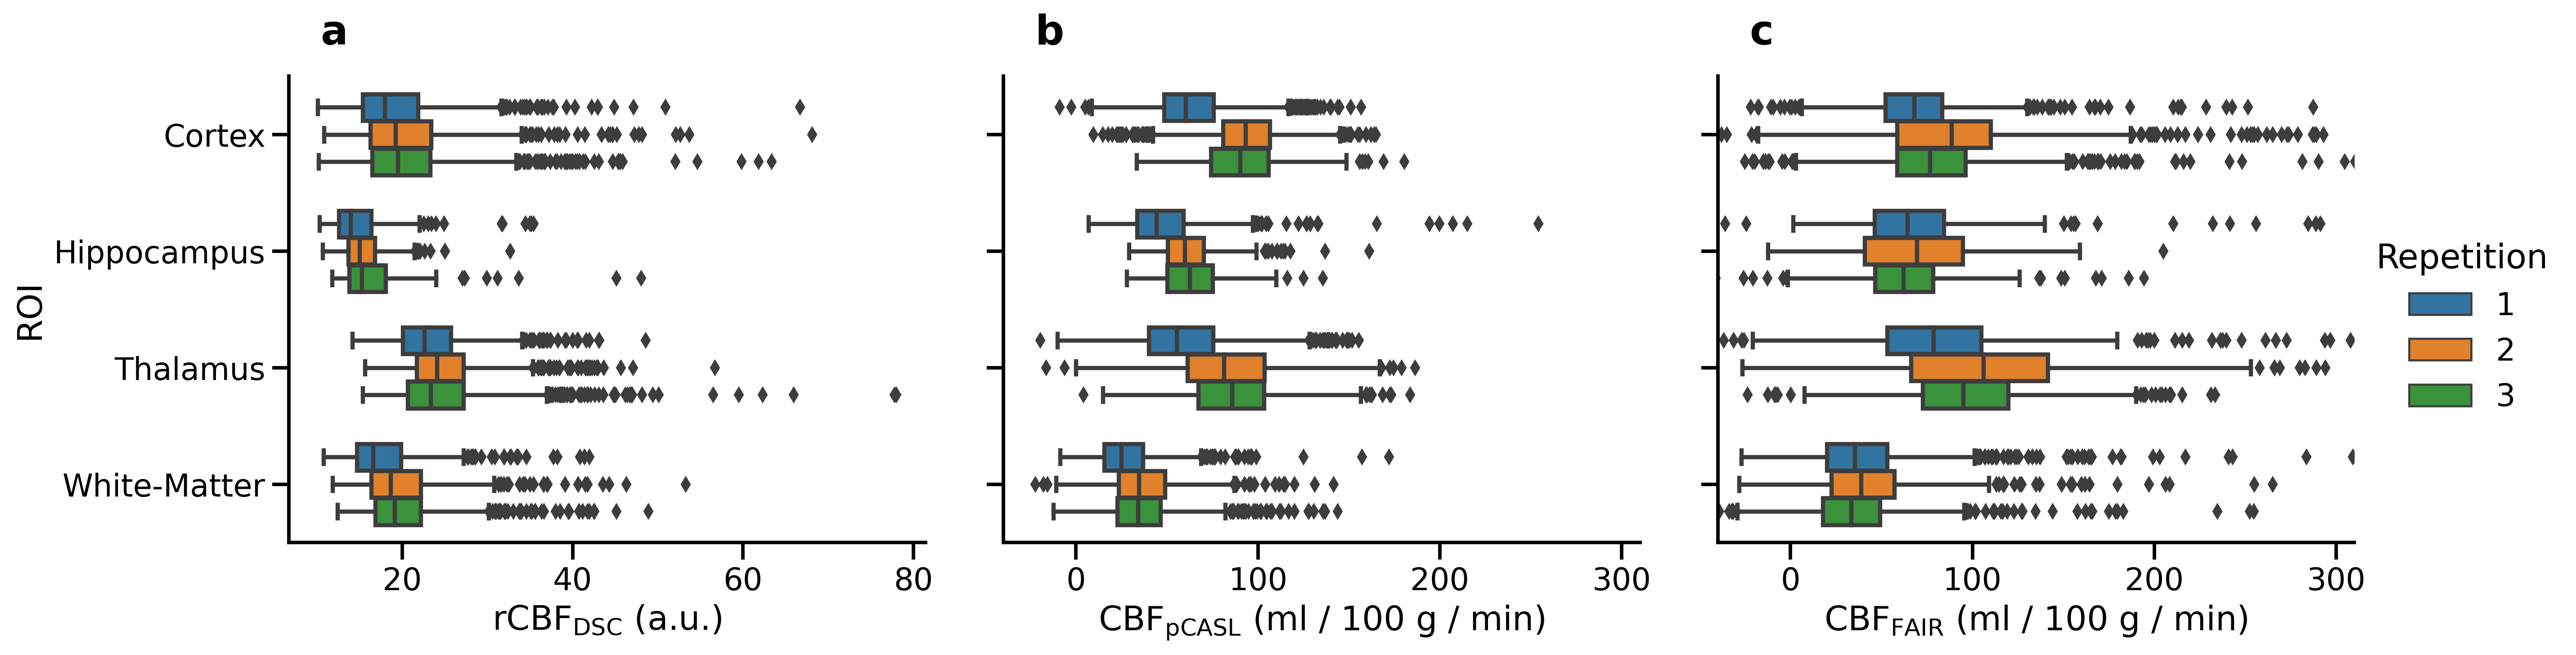
Figure 5 analyses the 3 re-scans of each animal using boxplots with outliers. The FAIR plot (c) has a very wide distribution and many outliers to the right (some even cut off). DSC-CBF is scaled differently and therefore difficult to compare directly, but the distributions are narrow compared with the differences between ROIs.
Discussion
All three perfusion MRI methods presented provided CBF maps of rat brains, but their comparison did not result in a clear winner. While FAIR shows noisier CBF maps and the distinction between the tissue types is less clear, the method is robust and easy to use. pCASL causes significant SAR heating and requires multiple calibration scans2 to achieve accurate results. This requires practice and a smooth workflow, the lack of which is possibly indicated by the lower perfusion values in Fig. 5b for the first repetition. The presented DSC-CBF maps currently do not provide absolute quantitative values, but this may be possible in future studies. The time resolution of 150ms was sufficient to extract arterial input functions for deconvolution. However, in the DSC-CBF maps, the low-perfused white matter showed higher perfusion than hippocampus, contrary to the ASL images. Although this may be a known issue with FAIR3, the effect was quite strong in our data and hence requires further, more detailed investigation.Acknowledgements
This work was supported by the German Research Foundation (DFG) within the Research Unit Programme FOR 5151 "QuaLiPerF (Quantifying Liver Perfusion–Function Relationship in Complex Resection - A Systems Medicine Approach)" by grant number 436883643.References
1. Wong A, Yan F, Liu H. Comparison of three-dimensional pseudo-continuous arterial spin labeling perfusion imaging with gradient-echo and spin-echo dynamic susceptibility contrast MRI. J. Magn. Reson. Imaging.2014 39: 427-433.
2. Hirschler L, Debacker C, Voiron J, et al. Interpulse phase corrections for unbalanced pseudo-continuous arterial spin labeling at high magnetic field. Magn Reson Med. 2018 Mar;79(3):1314-1324.
3. Hofmeijer J, Schepers J, van der Worp H, et al. Comparison of perfusion MRI by flow-sensitive alternating inversion recovery and dynamic susceptibility contrast in rats with permanent middle cerebral artery occlusion. NMR Biomed. 2005 Oct;18(6):390-4.
4. Quarles C et al. Comparison of dual-echo DSC-MRI- and DCE-MRI-derived contrast agent kinetic parameters. Magn Reson Imaging. 2012 Sep;30(7):944-53.5. Desikan R, Ségonne F, Fischl B, et al. An Automated Labeling System for Subdividing the Human Cerebral Cortex on MRI Scans into Gyral Based Regions of Interest." NeuroImage 2006 31 (3): 968–80.
5. Desikan R, Ségonne F, Fischl B, et al. An Automated Labeling System for Subdividing the Human Cerebral Cortex on MRI Scans into Gyral Based Regions of Interest." NeuroImage 2006 31 (3): 968–80.
Figures