1142
Impact of the B0 and B1+-adjustments on the in vivo metabolite quantification accuracy of simultaneous 2voxel 1H brain MRS at 7T1Physikalisch-Technische Bundesanstalt (PTB), Berlin, Germany, 2Center for Stroke Research Berlin, Charité Universitätsmedizin, Berlin, Germany, 3Center for Magnetic Resonance Research, University of Minnesota, Minneapolis, MN, United States, 4Medical Physics in Radiology, German Cancer Research Center (DKFZ), Heidelberg, Germany
Synopsis
For simultaneous multi-voxel spectroscopy (sMVS), it is necessary to optimize the B0 shimming and the B1+ adjustment simultaneously for two voxels. The impact of these adjustments on the smallest possible distance for simultaneous two-voxel MRS acquisitions is determined by Bloch simulations, and the influence on the spectral quality is assessed for three different brain regions. To this end, the previously introduced 2 spin-echo full-intensity acquired localization (2SPECIAL) sequence and the voxel-GeneRalized Autocalibrating Partial Parallel Acquisition (vGRAPPA) decomposition algorithm are utilized to simultaneously acquire and retrospectively decompose in vivo brain 1H-MRS data from two voxels at short echo times at 7T.
Introduction
In single-voxel MRS, the advantage of a compact point spread function1 and an improved metabolite SNR at short measurement times compared to MRSI is accompanied by the disadvantage of only measuring the signal of a single region2. To address this issue, several methods for simultaneous multi-voxel spectroscopy (sMVS) measurement and retrospective decomposition have been proposed3–5.In this work, we assess the impact of the B0 and B1+-adjustments on both the smallest feasible distance between voxels for a particular sMVS technique, as well as on the simultaneous B0-shim and B1+-optimization of two voxels for three different human brain regions, measured in vivo at 7T. Therefore, data was acquired utilizing the 2 spin-echo full-intensity acquired localization (2SPECIAL) sequence6–8, employing a multi-banded (MB) wideband, uniform rate, smooth truncation (WURST) pulse9, and it was decomposed using the voxel-GeneRalized Autocalibrating Partial Parallel Acquisition (vGRAPPA)10–13 algorithm.
Methods
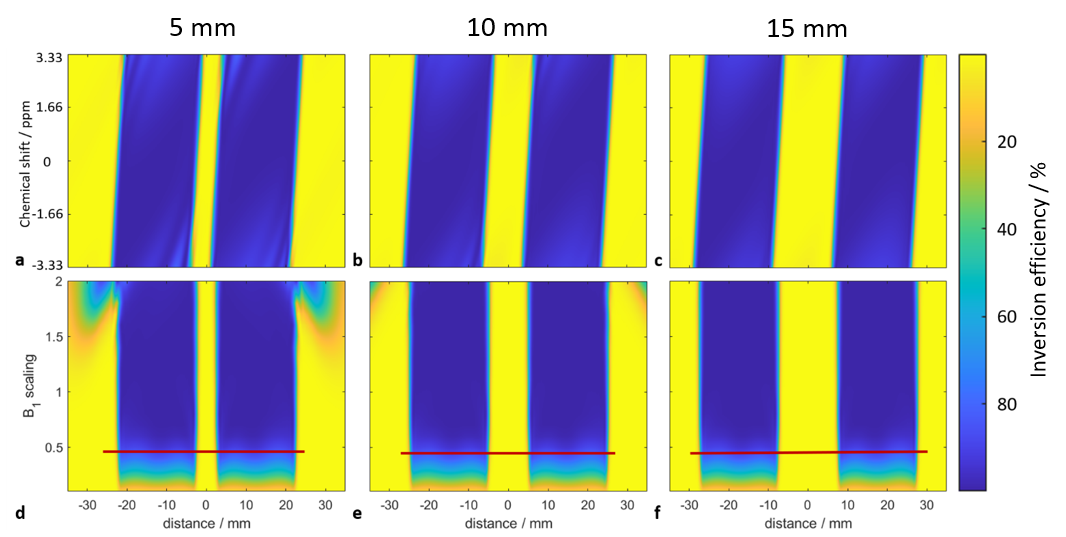
Sequence and Bloch SimulationsThe MB hyperbolic secant adiabatic inversion pulse, previously introduced into the 2SPECIAL sequence, was now replaced by an MB WURST pulse14. The smallest feasible edge-to-edge distance between two voxels, i.e., the distance between the FWHMs of both inversion profiles, was evaluated by Bloch simulations of B1+ and the off-resonance ΔB0 (Fig.1).
Data Acquisition
All measurements were performed on a 7T scanner (Magnetom, Siemens Healthineers, Erlangen, Germany) using a 1Tx/32Rx head coil (NOVA Medical, Wilmington, USA).
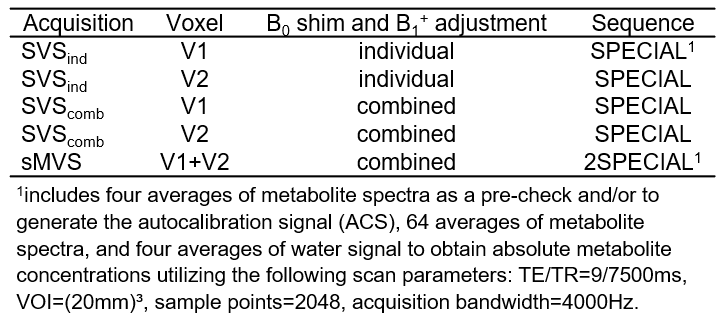
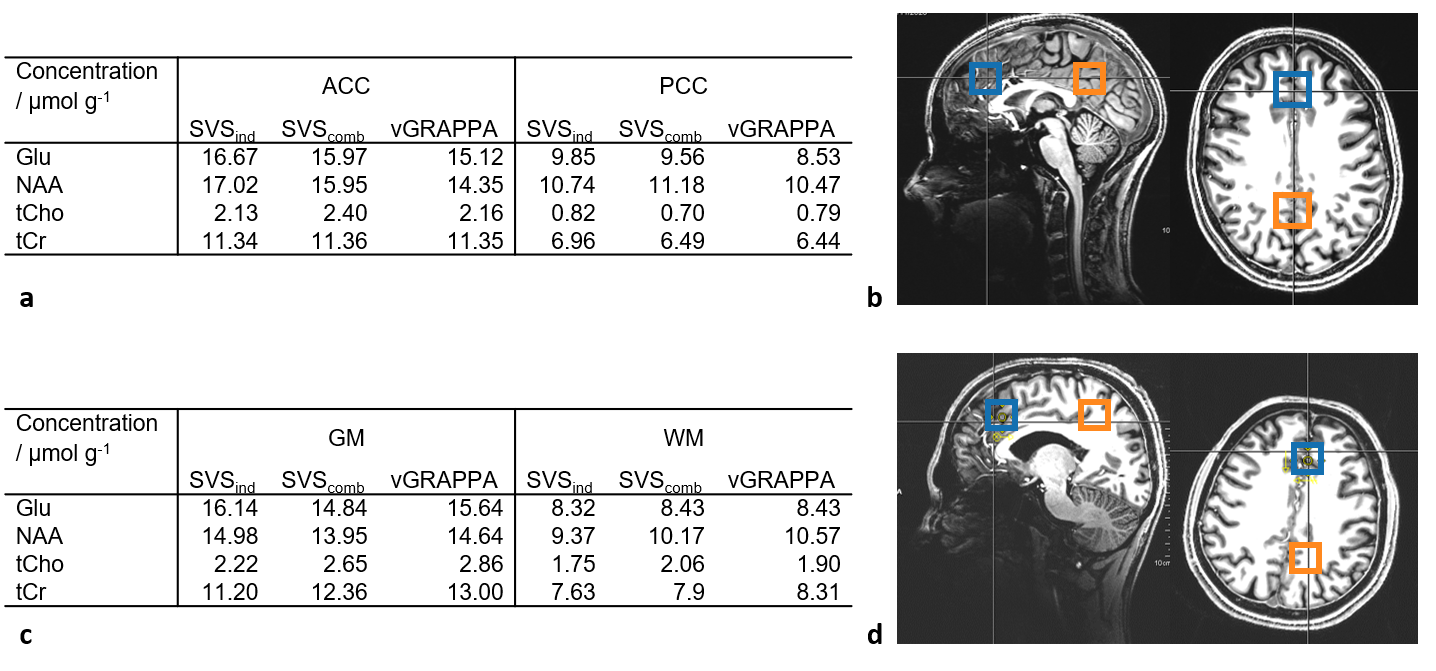
In vivo measurements were performed on twelve healthy volunteers (aged 32±12 y, 4:7:1 male:female:nonbinary). Spectra of ten volunteers were obtained from the left and right motor cortex (Fig.2a). Additional spectra were obtained in the anterior and posterior cingulate cortex of one subject (ACC/PCC, Fig.3b), and in an anterior gray- and a posterior white matter-rich region of another (GM/WM, Fig.3d). MP2RAGE15 images were acquired for voxel positioning. Voxel-based 2nd-order B0-shimming was performed using an in-house shimtool16,17 implemented in MATLAB, which was adapted to allow optimizing shim adjustments for both voxels simultaneously. First, SVS was performed for both voxels each using an SVS WURST-SPECIAL sequence and the individually optimized B0-shim and reference voltage (SVSind). Subsequently, the reference transmitter voltage for the sMVS acquisition was set to the mean of both single-voxel optimized reference voltages, and a two-voxel optimized B0-shim was obtained. These adjustments were then used to acquire SVS spectra (SVScomb) using SPECIAL and to obtain sMVS spectra using 2SPECIAL8. An additional outer volume saturation (OVS) band was added throughout the interleaved water suppression16 and OVS scheme for 2SPECIAL to also saturate the volume between the two voxels. The protocol and scan parameters are displayed in Tab.1.
vGRAPPA Decomposition and Spectral Reconstruction
The previously introduced vGRAPPA algorithm13 was applied to decompose the sMVS data to their respective regions. Both the separated sMVS spectra and the SVS spectra, were post-processed by summation of the even and odd averages for full localization, frequency correction, weighted and phase-corrected coil combination, and averaging. Metabolite quantification was performed with LCModel17.
Bland-Altman plots
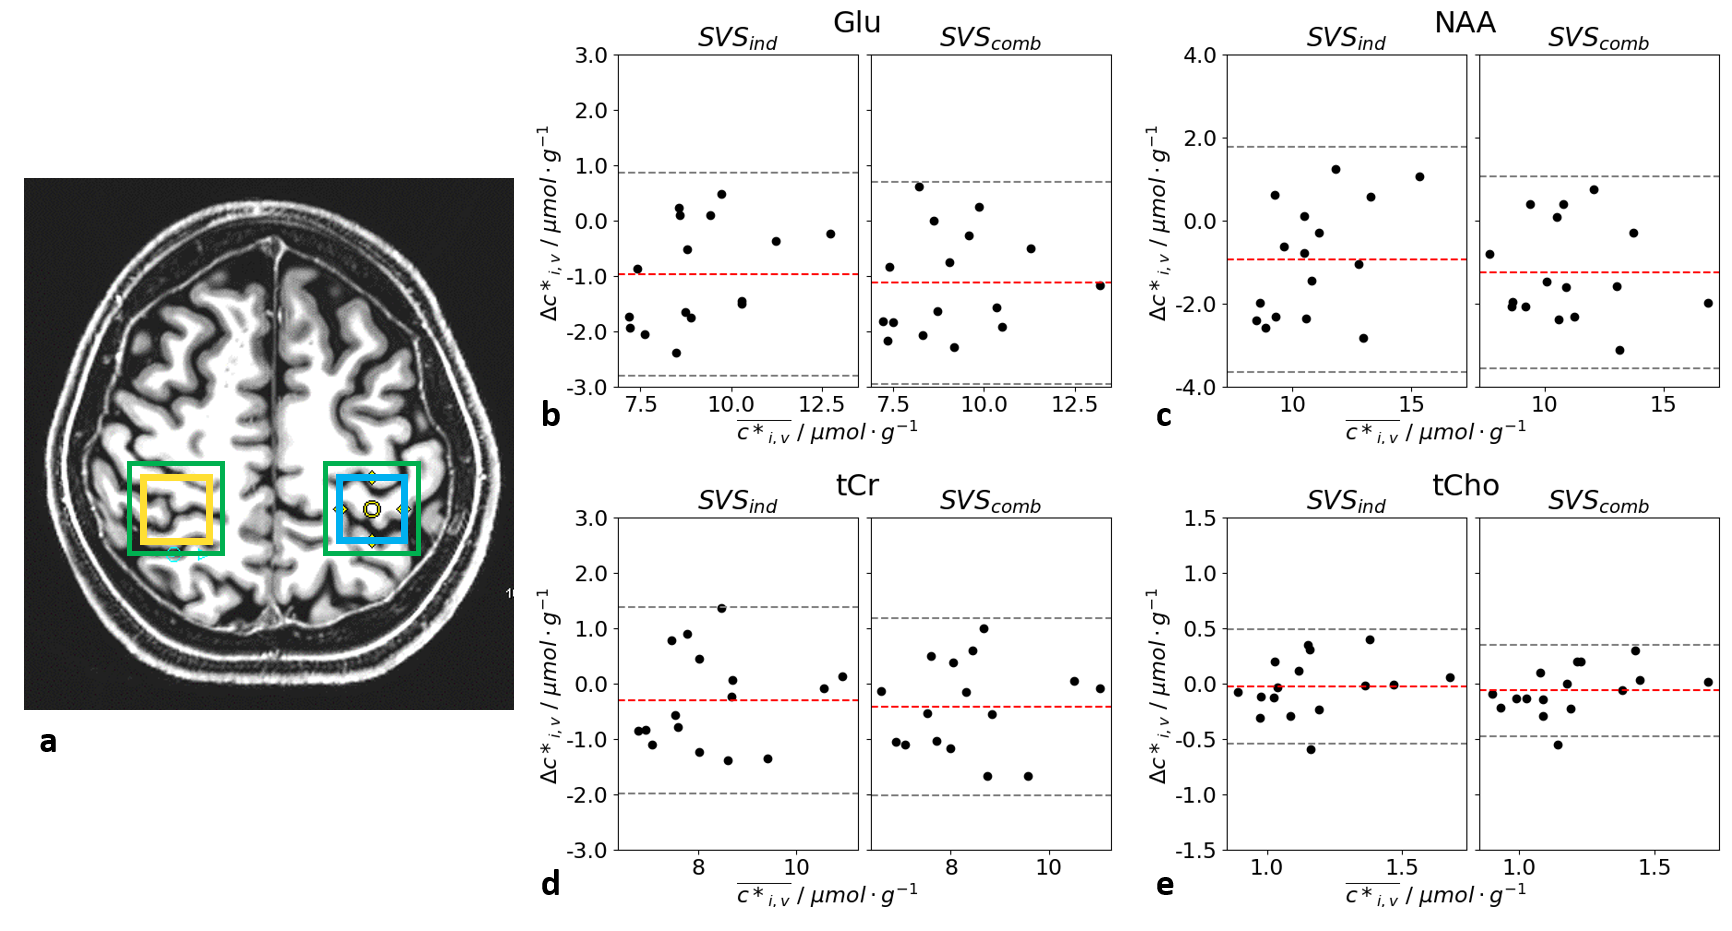
Bland-Altman plots18 of the tissue- and relaxation-time-corrected concentrations were obtained for both voxels in the motor cortices for the most prominent metabolites (NAA, Glu, tCr, and tCho), comparing the vGRAPPA decomposed sMVS spectra to 1) the SVSind and 2) the SVScomb data.
Results and Discussion
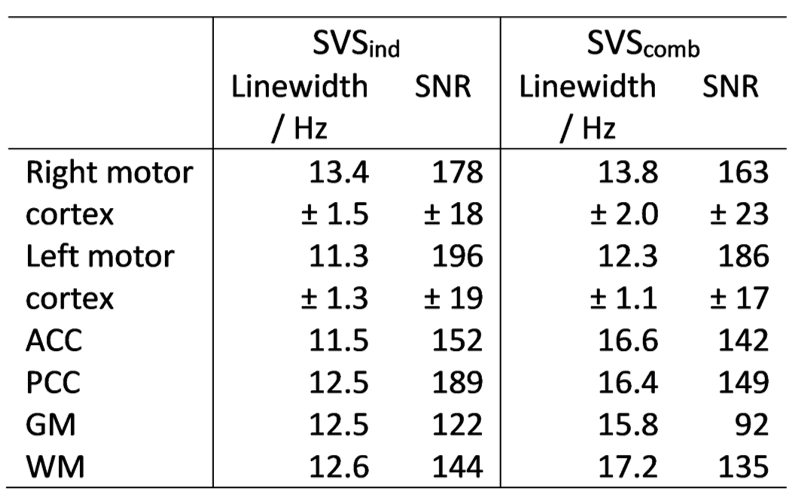
The minimum distance between two voxels was found to be 10mm, as an artificial partial inversion outside the voxels appeared below that distance for B1+-intensities 1.5-2 times above the nominal one (Fig.1). Moreover, at distances below 10mm, the inversion profiles become increasingly susceptible to B0-inhomogeneities. Hence, for voxel distances below 10mm, alternative approaches like exciting one large voxel covering the entire region should be considered.The differences in water linewidth and SNR between SVScomb and SVSind-adjustments depend on the brain region: For the given data and voxel locations, the impact is smaller in the motor cortices than in dorsal/ventral regions (Tab.2). Due to the absence of symmetry in the B0-distribution of the frontal and posterior cortex, this result was expected, whereas the symmetry between the lateral areas of the brain gives rise to a somewhat symmetrical B0-distribution, which can be more easily compensated by conventional spherical-harmonic B0-shim hardware.
This is in line with the results of the metabolite quantification: No significant differences between the metabolite concentrations of the vGRAPPA-decomposed sMVS spectra and neither SVScomb nor SVSind for Glu, NAA, tCr, and tCho were observed (Fig.2b-e) in the motor cortex voxels, while the obtained concentration differences in the dorsal/ventral regions vary up to -16.2% for tCho in the GM-rich voxel between SVScomb and SVSind (Fig.3a/c).
Conclusion
In conclusion, we have demonstrated, that an sMVS application with the investigated pulse and a distance of 10mm or more is feasible and not impaired by B1+-effects on the inversion profile of the MB pulse. Furthermore, simultaneous optimization of B0 and B1+-adjustments does not significantly hamper the quantification in a region with a somewhat symmetrical and benign B0-distribution, such as the motor cortices. In a dorsal/ventral region, on the other hand, the results regarding linewidth, SNR, and metabolite concentration quantification accuracy indicate the need for more sophisticated, and most likely hardware-based, B0 and B1+-optimization solutions, to avoid reduced data quality in sMVS applications in these more challenging, non-symmetrical regions.Acknowledgements
No acknowledgement found.References
1. Skoch A, Jiru F, Bunke J. Spectroscopic imaging: Basic principles. Eur J Radiol. 2008;67(2):230-239. doi:10.1016/j.ejrad.2008.03.003
2. Öz G, Deelchand DK, Wijnen JP, et al. Advanced single voxel 1H magnetic resonance spectroscopy techniques in humans: Experts’ consensus recommendations. NMR Biomed. 2020;(October 2019):1-18. doi:10.1002/nbm.4236
3. Boer VO, Klomp DWJ, Laterra J, Barker PB. Parallel reconstruction in accelerated multivoxel MR spectroscopy. Magn Reson Med. 2015;74(3):599-606. doi:10.1002/mrm.25718
4. Landheer K, Sahgal A, Das S, Graham SJ. Constrained source space MR spectroscopy: Multiple voxels, no gradient readout. Am J Neuroradiol. 2015;36(8):1436-1443. doi:10.3174/ajnr.A4319
5. Dehghani M, Edden R, Near J. Simultaneous ultra-short TE-MRS in two voxels using a SPECIAL sequence with Hadamard encoding. Proc 28 th Annu Meet ISMRM,. 2020:2-3.
6. Mlynárik V, Gambarota G, Frenkel H, Gruetter R. Localized short-echo-time proton MR spectroscopy with full signal-intensity acquisition. Magn Reson Med. 2006;56(5):965-970. doi:10.1002/mrm.21043
7. Mekle R, Mlynárik V, Gambarota G, Hergt M, Krueger G, Gruetter R. MR spectroscopy of the human brain with enhanced signal intensity at ultrashort echo times on a clinical platform at 3T and 7T. Magn Reson Med. 2009;61(6):1279-1285. doi:10.1002/mrm.21961
8. Riemann LT, Aigner CS, Brühl R, et al. Adiabatic multiband inversion for simultaneous acquisition of 1H MR spectra from two voxels in-vivo at very short echo times. Proc 28 th Annu Meet ISMRM,. 2020
9. Andronesi OC, Ramadan S, Ratai EM, Jennings D, Mountford CE, Sorensen AG. Spectroscopic Imaging with Improved Gradient Modulated Constant Adiabadicity Pulses on High-Field Clinical Scanners. J Magn Reson. 2011;23(1):1-7. doi:10.1161/CIRCULATIONAHA.110.956839
10. Heidemann RM, Griswold MA, Seiberlich N, et al. Direct parallel image reconstructions for spiral trajectories using GRAPPA. Magn Reson Med. 2006;56(2):317-326. doi:10.1002/mrm.20951
11. Setsompop K, Gagoski BA, Polimeni JR, Witzel T, Wedeen VJ, Wald LL. Blipped-controlled aliasing in parallel imaging for simultaneous multislice echo planar imaging with reduced g-factor penalty. Magn Reson Med. 2012;67(5):1210-1224. doi:10.1002/mrm.23097
12. Cauley SF, Polimeni JR, Bhat H, Wald LL, Setsompop K. Interslice leakage artifact reduction technique for simultaneous multislice acquisitions. Magn Reson Med. 2014;72(1):93-102. doi:10.1002/mrm.24898
13. Riemann LT, Aigner CS, Mekle R, Schmitter S, Ittermann B, Fillmer A. Fourier-based decomposition approach for simultaneous acquisition of 1 H spectra from two voxels in vivo at short echo times. Proc 29 th Annu Meet ISMRM,. 2021. doi:10.1002/nbm.4236
14. Aigner CS, Schmitter S. Designing B robust adiabatic multi-band inversion pulses with high time-bandwidth products and smooth slice selective gradients. Proc 28 th Annu Meet ISMRM, Montréal. 2020. doi:10.1002/mrm.22473
15. Marques JP, Kober T, Krueger G, van der Zwaag W, Van de Moortele PF, Gruetter R. MP2RAGE, a self bias-field corrected sequence for improved segmentation and T1-mapping at high field. Neuroimage. 2010;49(2):1271-1281. doi:10.1016/j.neuroimage.2009.10.002
16. Tkáč I, Gruetter R. Methodology of 1H NMR spectroscopy of the human brain at very high magnetic fields. Appl Magn Reson. 2005;29(1):139-157. doi:10.1007/BF03166960
17. Provencher SW. Estimation of metabolite concentrations from localized in vivo proton NMR spectra. Magn Reson Med. 1993;30(6):672-679. doi:10.1002/mrm.1910300604
18. Martin Bland J, Altman D. Statistical methods for assessing agreement between two methods of clinical measurement. Lancet. 1986;327(8476):307-310. doi:10.1016/S0140-6736(86)90837-8
Figures