1138
Muscle stiffness quantified by multifrequency MR elastography in patients with Achilles tendinopathy1Charité - Universitätsmedizin Berlin, Berlin, Germany
Synopsis
Achilles tendinopathy is a common injury among athletes. It has been reported that the calf muscles are involved and affected by Achilles tendinopathy. In this study, tomoelastography, a multifrequency MR-elastography (MRE) technique, was applied to patients with Achilles tendinopathy for the characterization of the biomechanical properties of gastrocnemius muscle. Preliminary findings showed the stiffness of gastrocnemius muscle increased significantly as a result of tendinopathy.
Introduction
Achilles tendinopathy (AT) is a common injury among athletes with the incident rate of 8.3 per 10001. Studies using myotonometry have reported tendon softening due to tendinopathy1,2. In term of muscle involvement in AT, it was reported that gastrocnemius and soleus were the most relevant plantar flexor muscles and their strength were altered through tendinopathy3. Therefore, in this study, we used tomoelastography, a multifrequency MRE technique based on wave-number inversion4, for examining the biomechanical properties of gastrocnemius in patients with AT and investigated their relationship with AT.Methods
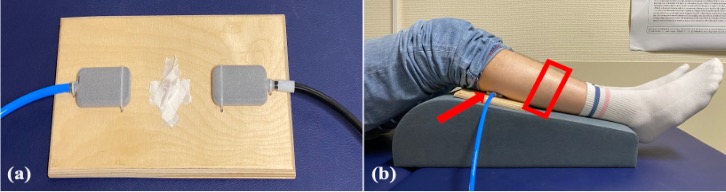
In vivo tomoelastography was performed in 8 patients (age: 36.5±4 years; 3 females) with clinically diagnosed high-grade chronic degenerative tendinopathies. To transfer mechanical vibration to the gastrocnemius muscle, a custom-made system using two pressure pads powered by compressed air5 was used. Two pressure pads were equally positioned and fixed onto a wooden board that was placed directly under the lower legs (Figure 1). As shown in Figure 1.b, to avoid muscle compression from the pads, our imaging volume was chosen at least 2 cm away from the edge of the pads towards the feet direction. Tomoelastography was performed on a 3T MRI scanner (MAGNETOM Lumina, Siemens Healthineers) using a 12-channel phased array surface coil. Both legs of the patient were scanned simultaneously. Mechanical vibration with the frequencies of 30, 40 and 50 Hz were applied sequentially. 3D wave fields were acquired by a single-shot spin-echo EPI sequence with a bipolar trapezoidal flow-compensated motion-encoding gradient (MEG). Eight dynamics of a wave cycle were measured. Thirty consecutive transversal slices with voxel size of 2x2x2 mm3 were acquired and the whole tomoelastography acquisition time was 4 mins and 4 secs. In addition to MRE, axial T1-weighted images covering the same imaging volume were acquired for anatomical reference. Tomoelastography data were processed and maps of shear wave speed (c in m/s) were obtained using wavenumber-based (k) multifrequency elasto-visco (k-MDEV) inversion method4. As c is proportional to the square root of the storage modulus, it is considered a surrogate marker of tissue stiffness. Regions of interest (ROIs) of the gastrocnemius muscle were manually drawn in all 30 slices based on the magnitude of MRE images with reference to T1w anatomical images. For statistical analysis, Wilcoxon signed-rank test was used for testing the group difference with respect to AT.Results
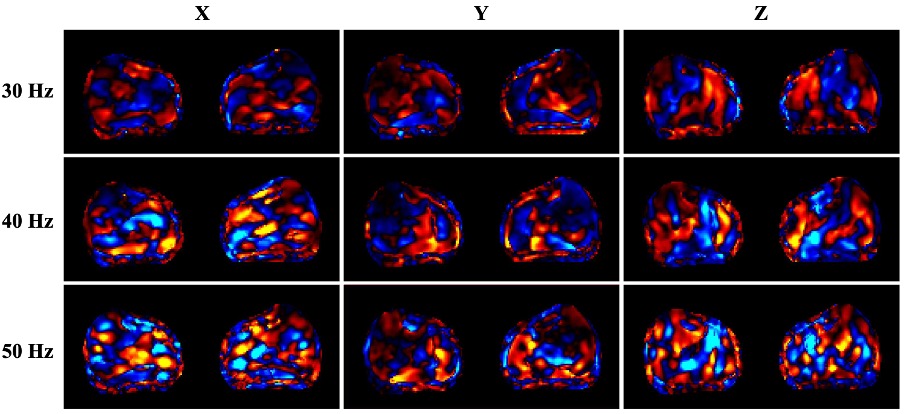
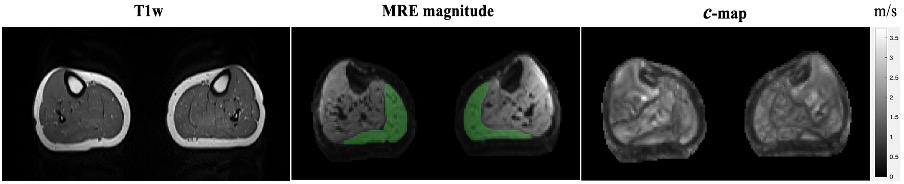
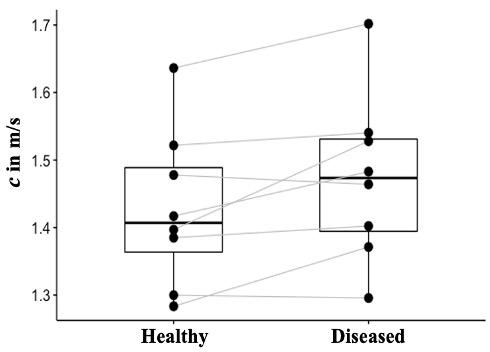
In all our patients, AT only affected one leg, therefore, the unaffected leg was considered as internal healthy control. In Figure 2, wave images at 30, 40 and 50 Hz propagating at three MEG directions are selectively shown for one patient. The T1w image, MRE magnitude image together with highlighted gastrocnemius’ ROI and the corresponding stiffness map of the same patient are presented in Figure 3. The left leg of this patient was affected by AT and it is visible from the stiffness map that the left gastrocnemius appears stiffer (higher c value) than the right one. When comparing gastrocnemius muscles of the healthy legs and AT-affected legs, we observed a significantly higher gastrocnemius stiffness in the diseased leg than in the healthy leg (c_AT: 1.47±0.12 m/s vs. c_healthy: 1.42±0.11m/s, p= 0.039). c values of the gastrocnemius in both the healthy and the diseased legs of all patients are plotted in Figure 4.Discussion
To the best of our knowledge, this is the first study that investigated the stiffness of gastrocnemius muscle of AT patients using MRE. The results showed that the stiffness of the gastrocnemius muscle was influenced by AT. The AT-related stiffening of gastrocnemius as observed in this study could be due to a) pain related involuntary muscle contraction and b) functional limitations resulted muscle atrophy6. AT alters primarily the geometry and volume of the Achilles tendon7 which might in turn influence the fine muscle fascicle orientation in the gastocnemius8. We speculated that the changes in fascicle alignment could also cause different wave-guide effect, leading to changes in the observed muscle stiffness9,10. As the results were preliminary and the study is still ongoing, more patients will be included and clinical findings will be collected and compared in order to further our understanding of the biomechanical response of the calf muscle to AT.Conclusion
In this study, tomoelastography was established for studying AT through the biomechanical properties of the gastrocnemius muscle. Our data demonstrated that AT can be probed indirectly via plantar flexor muscles. This method might be useful in the further for monitoring noninvasively the treatment response and rehabilitation after AT.Acknowledgements
We acknowledge support from the German Research Foundation (DFG)- GU 172614-1, BIOQIC, and SFB1340 Matrix in Vision.References
1. Morgan, G. E., Martin, R., Williams, L., Pearce, O., & Morris, K. (2018). Objective assessment of stiffness in Achilles tendinopathy: a novel approach using the MyotonPRO. BMJ open sport & exercise medicine, 4(1), e000446.
2. Finnamore, E., Waugh, C., Solomons, L., Ryan, M., West, C., & Scott, A. (2019). Transverse tendon stiffness is reduced in people with Achilles tendinopathy: A cross-sectional study. PLoS One, 14(2), e0211863.
3. O'Neill, S., Barry, S., & Watson, P. (2019). Plantarflexor strength and endurance deficits associated with mid-portion Achilles tendinopathy: the role of soleus. Physical Therapy in Sport, 37, 69-76.
4. Tzschätzsch, H., Guo, J., Dittmann, F., Hirsch, S., Barnhill, E., Jöhrens, K., ... & Sack, I. (2016). Tomoelastography by multifrequency wave number recovery from time-harmonic propagating shear waves. Medical image analysis, 30, 1-10.
5. Braun, J., Hirsch, S., Heinze, T., & Sack, I. (2015). Feasibility of a new actuator type for magnetic resonance elastography based on transient air pressure impulses. In Proc 23rd Annual Annual Meeting ISMRM.
6. Meyer, D. C., Pirkl, C., Pfirrmann, C. W., Zanetti, M., & Gerber, C. (2005). Asymmetric atrophy of the supraspinatus muscle following tendon tear. Journal of Orthopaedic Research, 23(2), 254-258.
7. Szaro, P., & Gataa, K. G. (2021). The correlations between dimensions of the normal tendon and tendinopathy changed Achilles tendon in routine magnetic resonance imaging. Scientific Reports, 11(1), 1-11.
8. Heikkinen, J., Lantto, I., Flinkkila, T., Siira, P., Laine, V., Niinimaki, J., ... & Leppilahti, J. (2017). Calf muscle atrophy and Achilles tendon elongation after acute Achilles tendon rupture. Arthroscopy, 33(10), e129-e130.
9. Guo, J., Hirsch, S., Scheel, M., Braun, J., & Sack, I. (2016). Three‐parameter shear wave inversion in MR elastography of incompressible transverse isotropic media: Application to In Vivo Lower Leg Muscles. Magnetic resonance in medicine, 75(4), 1537-1545.
10. Romano, A., Abraham, P. B., Ringleb, S. I., Rossman, P. J., Bucaro, J. A., & Ehman, R. L. (2006). Determination of Anisotropic Velocity Profiles in Muscle Using Wave-Guide Constrained Magnetic Resonance Elastography. In Proceedings of the 14th Annual Meeting of ISMRM, Seattle, Washington, USA (p. 1725).
Figures