1136
Deep Learning and Fat Fraction Based Analysis of Calf MRI in Diabetic Patients Following Exercise Intervention1NYU Grossman School of Medicine, New York University, New York, NY, United States, 2College of Arts and Sciences, New York University, New York, NY, United States, 3Center for Biomedical Imaging, Department of Radiology, New York University Grossman School of Medicine, New York, NY, United States, 4Center for Data Science, New York University, New York, NY, United States, 5Center for Advanced Imaging Innovation and Research (CAI2R), Department of Radiology, New York University Grossman School of Medicine, New York, NY, United States, 6Department of Physical Therapy, New York University, New York, NY, United States
Synopsis
Diabetic peripheral neuropathy (DPN) is characterized by increased adiposity implicated in metabolic dysfunction. Proton-based Dixon MRI is an appropriate means to quantify adiposity, but analysis requires time-consuming manual image segmentation. To address this problem, we developed an automated segmentation algorithm based on convolutional neural networks that provided high dice similarity coefficient scores (>0.88) on multiple regions of interest (ROI) within the calf. We utilized the networks to analyze fat fraction trends in individuals with DPN following a 10-week supervised exercise program. We measured decreased adiposity in the combined calf interstitial and muscle space (P<0.1) but not in individual muscle ROIs.
Introduction
Approximately 34 million people have diabetes in the USA,1 and 30%–50% of patients with type 2 diabetes develop diabetic peripheral neuropathy (DPN).2 Prolonged DPN causes significant skeletal muscle deficits in the extremities, including increased adiposity and loss of strength and endurance.3–5 Proton-based Dixon MRI is an appropriate means to measure adiposity, but muscle-specific image analysis can be burdensome due to the lack of standardized and automated segmentation tools. In this study, we build upon our previously reported convolutional neural network-based tool to segment individual muscle groups and the peripheral adipose tissue in the lower extremity.6 We apply the segmentations to evaluate adiposity in the calf muscles of individuals with DPN before and after a 10-week supervised exercise program.Methods
The studies were conducted in accordance with the university’s Institutional Review Board, and all subjects provided informed written consent. MRI experiments were performed on a 3 Tesla scanner (Prisma, Siemens Medical Solutions, Erlangen, Germany) with an in-house developed lower extremity coil.7 The scans were centered at the widest lateral mid-calf dimension of the right leg. We acquired fat-suppressed PSIF images for segmentation (TR/TE/FA = 10.8ms/3.3ms/30° and resolution = 0.9x0.9x1.8mm3 or 0.9mm isotropic) and GRE datasets to calculate adipose fraction (TR/TE/ΔTE/FA = 12ms/2.2ms/0.8ms/3° and resolution = 1.7x1.7x5mm3).8,9Two separate segmentation problems were defined. Briefly, we manually segmented the medial gastrocnemius (GM), lateral gastrocnemius (GL), soleus (SOL), tibia (TIB), and fibula (FIB) for Segmentation Problem #1 and a global region of interest (GLOB) that excluded subcutaneous adipose tissue for Segmentation Problem #2 using ITK-SNAP software; training data included on average 83 slices for Segmentation Problem #1 and 7 slices for Segmentation Problem #2 in each of 20 subjects (Table 1), which required at least one hour of effort per subject. Images were filtered and intensity normalized to reduce the influence of noisy pixels and inhomogeneity related to the MRI acquisition with an N4 bias field correction algorithm.10 The data was split into three subsets for testing, with remaining data used for training to create a total of 3 networks for each segmentation problem that were subsequently ensembled to generate a single network for each problem. The networks were 2D Convolutional Neural Networks (CNNs) with a U-net architecture11 that is popular for medical imaging segmentation.12,13 Each network was trained with the hyperparameters described in Table 2. The output of the networks was evaluated against the ground truth manual segmentations by calculating the dice similarity coefficient (DSC) on the test datasets.14
This tool was applied on a separate cohort of 19 individuals with DPN through generating segmentations from PSIF images and evaluating co-registered fat fraction maps (Table 1). Each region of interest (ROI) was either eroded (GM, GL, SOL, GLOB) or dilated (TIB, FIB) by 2.7mm (3 voxels) to minimize contamination from neighboring adipose tissue. A new ROI denoted interior was defined as GLOB subtracted by TIB and FIB to represent intramuscular and intermuscular adipose tissue without bone marrow or subcutaneous adipose tissue. Each subject was evaluated at 3 time points: 1. baseline1, 2. baseline2; approximately 30 days after baseline1, and 3. post-intervention, which followed a 10-week supervised, personal exercise program in which participants engaged in aerobic and strength training described in reference 17. DPN status was confirmed prior to MRI using the Michigan Neuropathy Screening Instrument (MNSI).19
Results
MR images with overlaid manual and automated segmentation results of a representative slice from the test set demonstrate satisfying visual agreement (Figure 1). The mean DSCs were greater than 0.88 for all ROIs over a 9cm longitudinal range (Table 3). Note that the GL has the lowest mean DSC (0.88), likely due to its variable architecture along the calf. Table 4 summarizes the fat fraction analysis for each ROI at each time point. As expected, no change in fat fraction was observed between baseline1 and baseline2 (P>0.3), suggesting that the technique is robust against daily physiological variations. A trend toward significance (p<0.1) was observed between baseline2 and post-intervention in the interior ROI, with a mean change in fat fraction of -2.24%.Discussion
In this work, we developed an automated calf segmentation tool by training two CNNs on PSIF images with manually drawn contours. The high DSCs indicate that the automated algorithm can eliminate the tedious manual segmentation process that requires over one-hour of effort per subject. The algorithm was used to analyze fat fraction trends in individuals with DPN following a 10-week exercise intervention, with a trend toward significance most notable in the interior ROI. These results are in agreement with those in our previous report in which manual segmentation was required.17 Reduced adipose in the interior ROI may represent a greater loss of intermuscular adipose tissue compared with intramuscular adipose tissue. This is clinically promising given that intermuscular adipose tissue is implicated in insulin resistance, decreased muscle function, and decreased mobility.20Conclusion
While clinical trials have shown that exercise improves muscle strength and balance in DPN21,22, this study shows that MRI can provide additional clinically relevant markers in the context of longitudinal response17,23. The algorithm developed in this work can automate the analysis of such MRI measurements.Acknowledgements
This work was supported in part by NIH grants R01 DK114428, R01 DK106292, and T35 DK007421, and was performed under the rubric of the Center for Advanced Imaging Innovation and Research (CAI2R, www.cai2r.net), a NIBIB Biomedical Technology Resource Center (NIH P41 EB017183).References
1. Centers for Disease Control and Prevention. National diabetes statistics report. Atlanta, GA; 2020.2. Tesfaye S, Selvarajah D. Advances in the epidemiology, pathogenesis and management of diabetic peripheral neuropathy. Diabetes Metab Res Rev 2012;28 Suppl 1:8–14.
3. Bittel DC, Bittel AJ, Tuttle LJ, et al. Adipose tissue content, muscle performance and physical function in obese adults with type 2 diabetes mellitus and peripheral neuropathy. J Diabetes Complications 2015;29:250–7.
4. Cheuy VA, Hastings MK, Commean PK, et al. Muscle and joint factors associated with forefoot deformity in the diabetic neuropathic foot. Foot Ankle Int 2016;37:514–21.
5. Hilton TN, Tuttle LJ, Bohnert KL, et al. Excessive adipose tissue infiltration in skeletal muscle in individuals with obesity, diabetes mellitus, and peripheral neuropathy: association with performance and function. Phys Ther 2008;88:1336–44.
6. Shah JT, Medina K, Rajamohan HR, Ho J, Deniz CM, Brown R. Deep Learning Based Segmentation and Fat Fraction Assessment of the Calf in Diabetic Subjects and Non-Diabetic Controls. ISMRM & SMRT. Virtual Conference 2021.
7. Brown R, Khegai O, Parasoglou P. Magnetic Resonance Imaging of Phosphocreatine and Determination of BOLD Kinetics in Lower Extremity Muscles using a Dual-Frequency Coil Array. Sci Rep 2016;6:30568.
8. Tsao J, Jiang Y. Hierarchical IDEAL: robust water-fat separation at high field by multiresolution field map estimation. ISMRM. Toronto 2008. p 653.
9. Jiang Y, Tsao J. Fast and robust separation of multiple chemical species from arbitrary echo times with complete immunity to phase wrapping. ISMRM. Melbourne 2012.
10. Tustison NJ, Avants BB, Cook PA, Zheng Y, Egan A, Yushkevich PA, Gee JC. N4ITK: improved N3 bias correction. IEEE Trans Med Imaging 2010;29(6):1310-1320.
11. Ronneberger O, Fischer P, Brox T. U-Net: Convolutional Networks for Biomedical Image Segmentation. Medical Image Computing and Computer-Assisted Intervention, Pt Iii 2015;9351:234-241.
12. Amer R, Nassar J, Bendahan D, Greenspan H, Ben-Eliezer N. Automatic Segmentation of Muscle Tissue and Inter-muscular Fat in Thigh and Calf MRI Images. Lect Notes Comput Sc 2019;11765:219-227.
13. Deniz CM, Xiang S, Hallyburton RS, Welbeck A, Babb JS, Honig S, Cho K, Chang G. Segmentation of the Proximal Femur from MR Images using Deep Convolutional Neural Networks. Sci Rep 2018;8(1):16485.
14. Dice LR. Measures of the Amount of Ecologic Association Between Species. Ecol 1945;26:297-302.
15. Fujino H, Kobayashi T, Goto I, Onitsuka H. Magnetic resonance imaging of the muscles in patients with polymyositis and dermatomyositis. Muscle & nerve 1991;14(8):716-720.
16. Valentinitsch A, Karampinos DC, Alizai H, Subburaj K, Kumar D, Link TM, Majumdar S. Automated unsupervised multi-parametric classification of adipose tissue depots in skeletal muscle. J Magn Reson Imaging 2013;37(4):917-927.
17. Brown R, Sharafi, A, Slade JM, et al. Lower extremity MRI following 10- week supervised exercise intervention in patients with diabetic peripheral neuropathy. BMJ
Open Diab Res Care 2021;9:e002312.
18. Kluding PM, Pasnoor M, Singh R, D'Silva LJ, Yoo M, Billinger SA, LeMaster JW, Dimachkie MM, Herbelin L, Wright DE. Safety of aerobic exercise in people with diabetic peripheral neuropathy: single-group clinical trial. Physical therapy 2015;95(2):223-234.
19. Herman WH, Pop-Busui R, Bra ett BH, Martin CL, Cleary PA, Albers JW, Feldman EL, Group DER. Use of the Michigan Neuropathy Screening Instrument as a measure of distal symmetrical peripheral neuropathy in Type 1 diabetes: results from the Diabetes Control and Complications Trial/Epidemiology of Diabetes Interventions and Complications. Diabetic medicine: a journal of the British Diabetic Association 2012;29(7):937-944.
20. Addison P, Marcus RL, LaStayo PC, Ryan AS. Intermuscular Fat: A Review of the Consequences and Causes. International Journal of Endocrinology 2014;2014:247076.
21. Kruse RL, Lemaster JW, Madsen RW. Fall and balance outcomes after an intervention to promote leg strength, balance, and walking in people with diabetic peripheral neuropathy: "feet first" randomized controlled trial. Physical therapy 2010;90(11):1568-1579.
22. Yoo M, D'Silva LJ, Martin K, Sharma NK, Pasnoor M, LeMaster JW, Kluding PM. Pilot Study of Exercise Therapy on Painful Diabetic Peripheral Neuropathy. Pain medicine 2015;16(8):1482-1489.
23. Labayen I, Medrano M, Arenaza L, Maiz E, Oses M, Martinez-Vizcaino V, Ruiz JR, Ortega FB. Effects of Exercise in Addition to a Family-Based Lifestyle Intervention Program on Hepatic Fat in Children With Overweight. Diabetes care 2020;43(2):306-313.
Figures
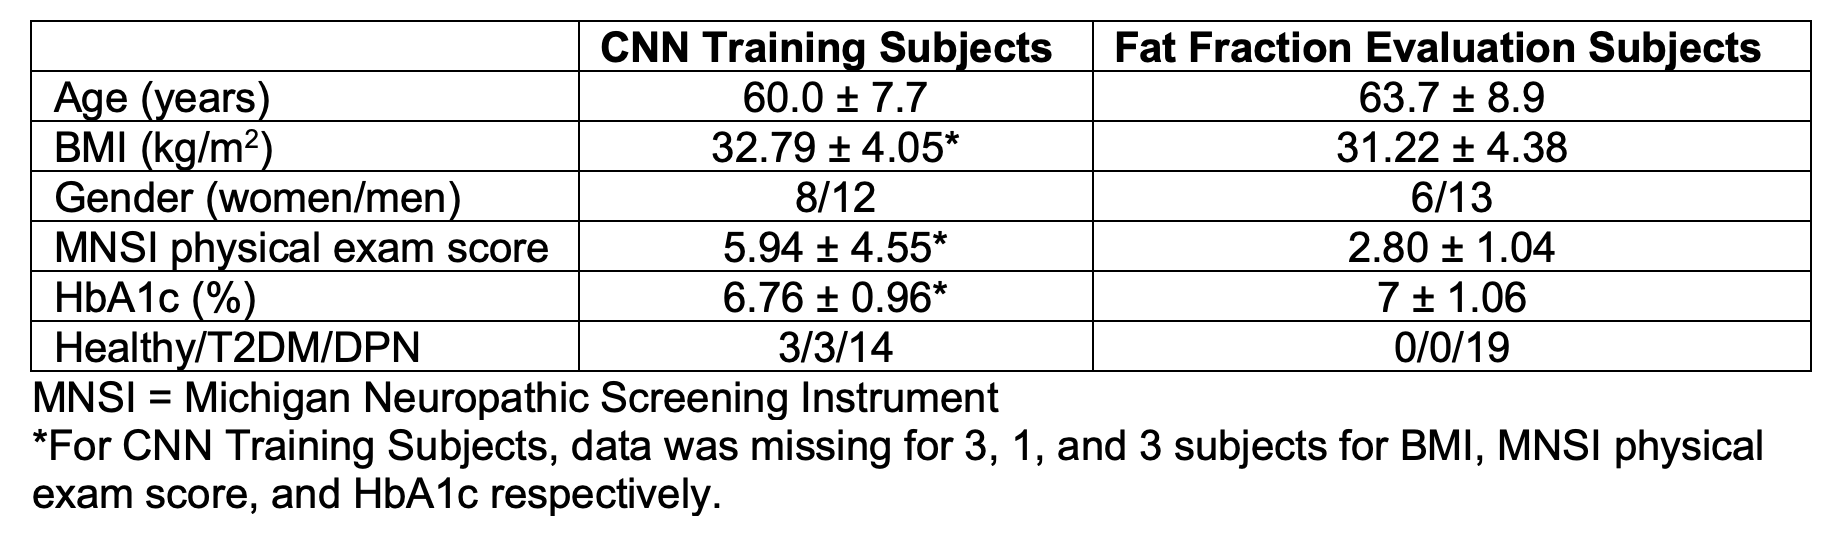
Table 1. Participant characteristics for the subjects used to train the convolutional neural networks (N=20) and the subjects used for longitudinal fat fraction analysis (N=19).
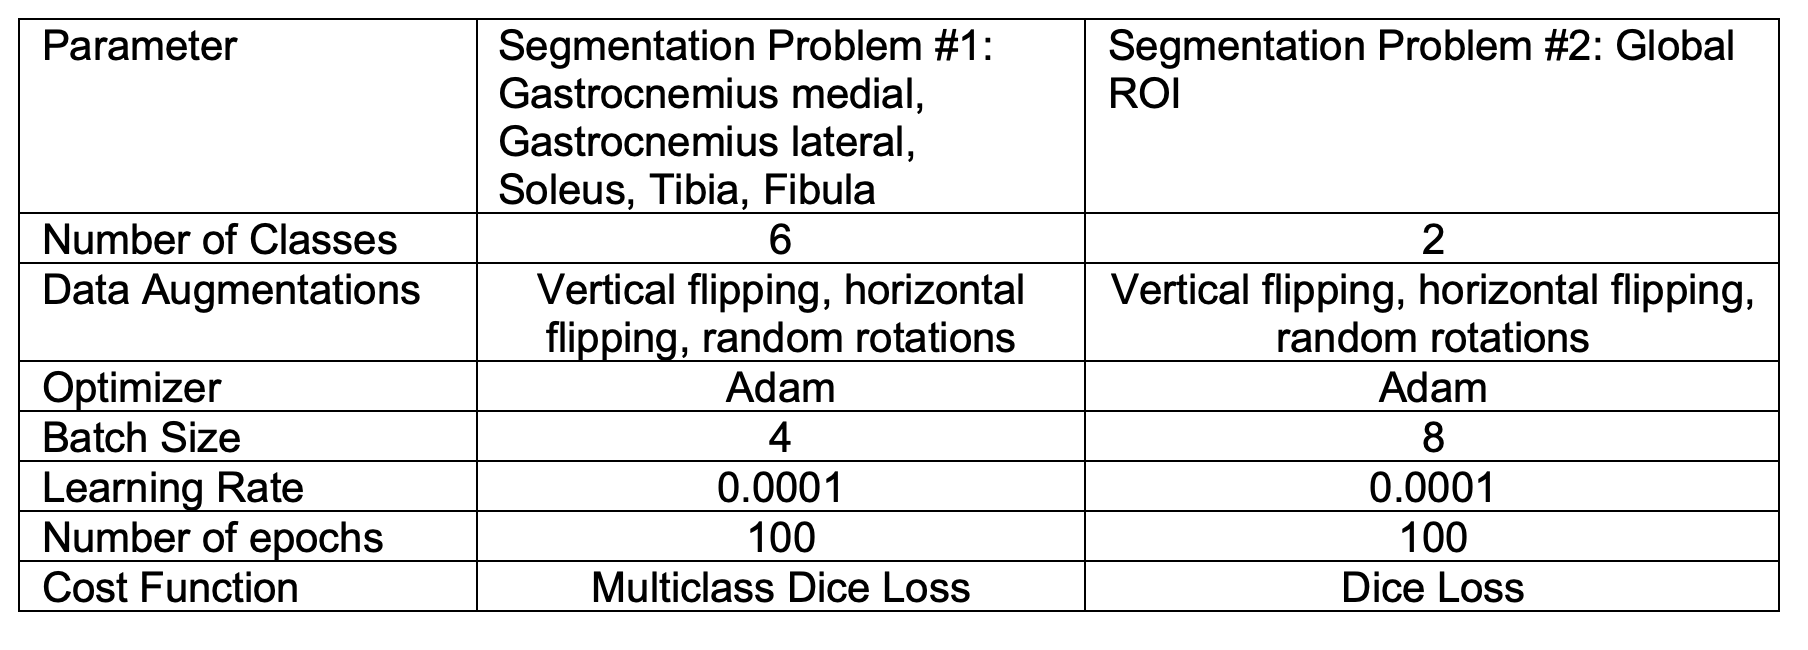
Table 2. Hyperparameters used for convolutional neural network setup and training.
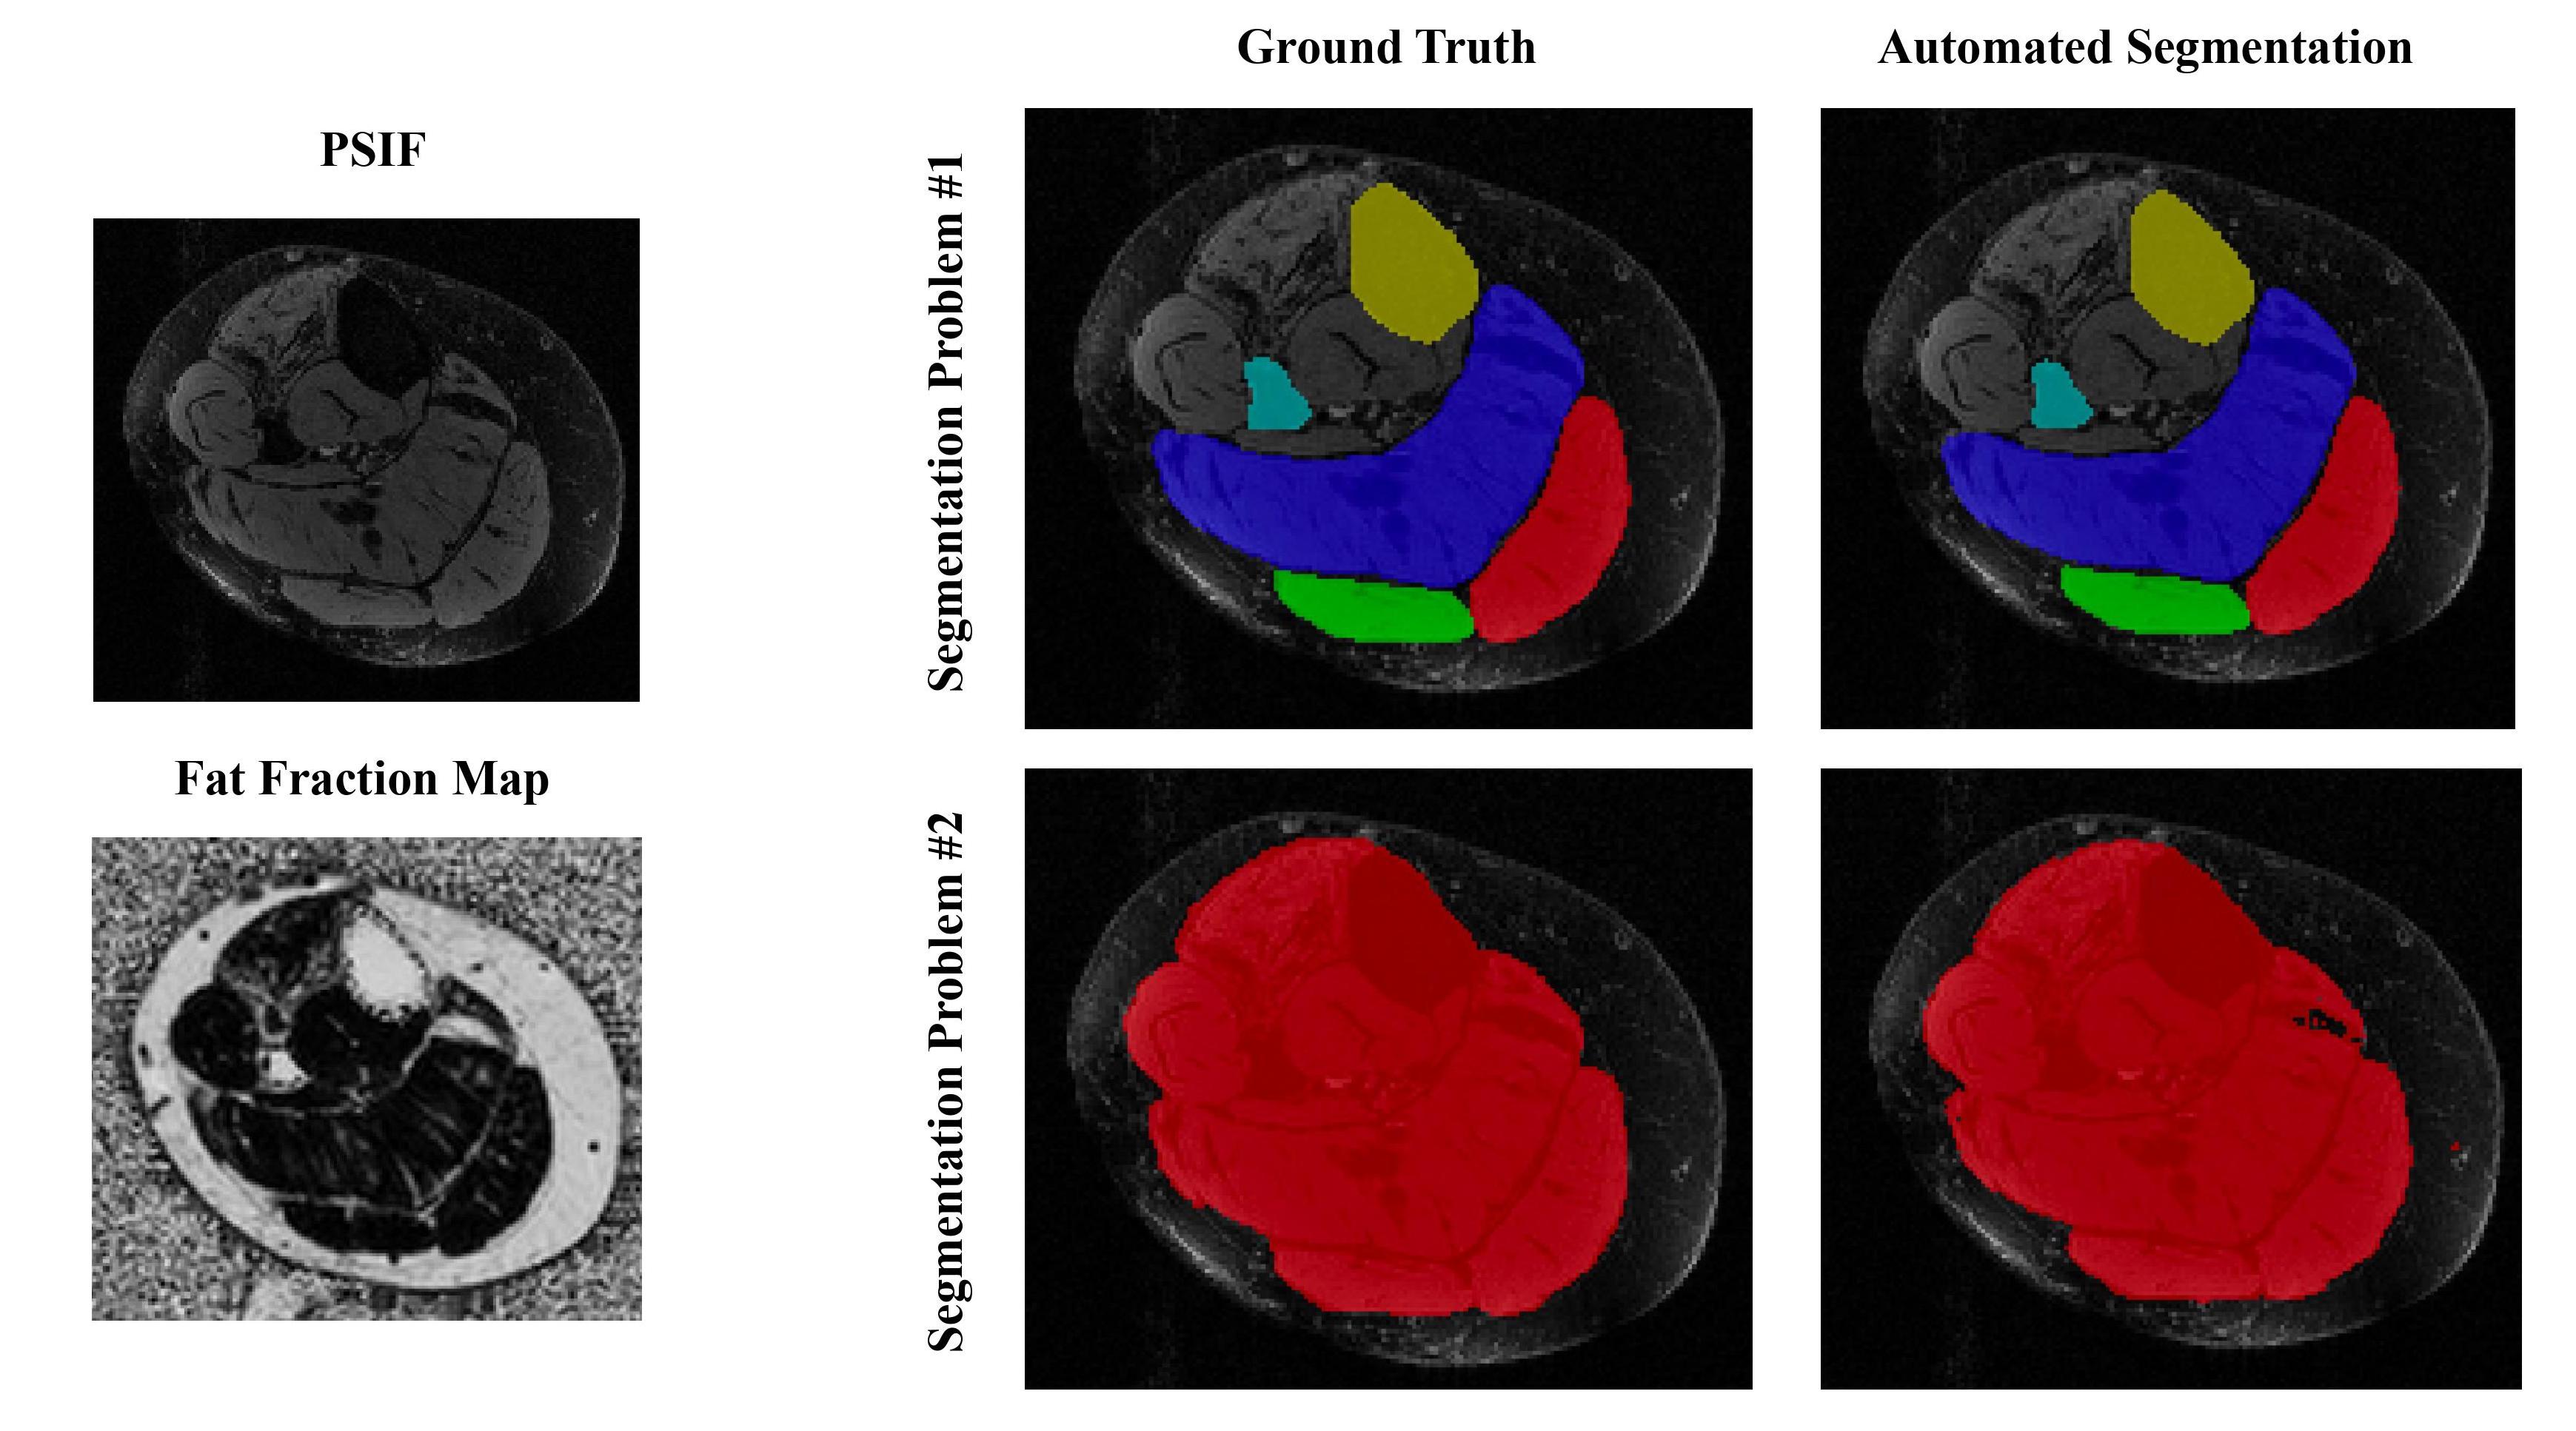
Figure 1. Results from one representative DPN subject from the CNN testing cohort. The anatomic PSIF and Fat Fraction MR image of one slice is shown, as well as the corresponding ground truth segmentation and CNN segmentation results.
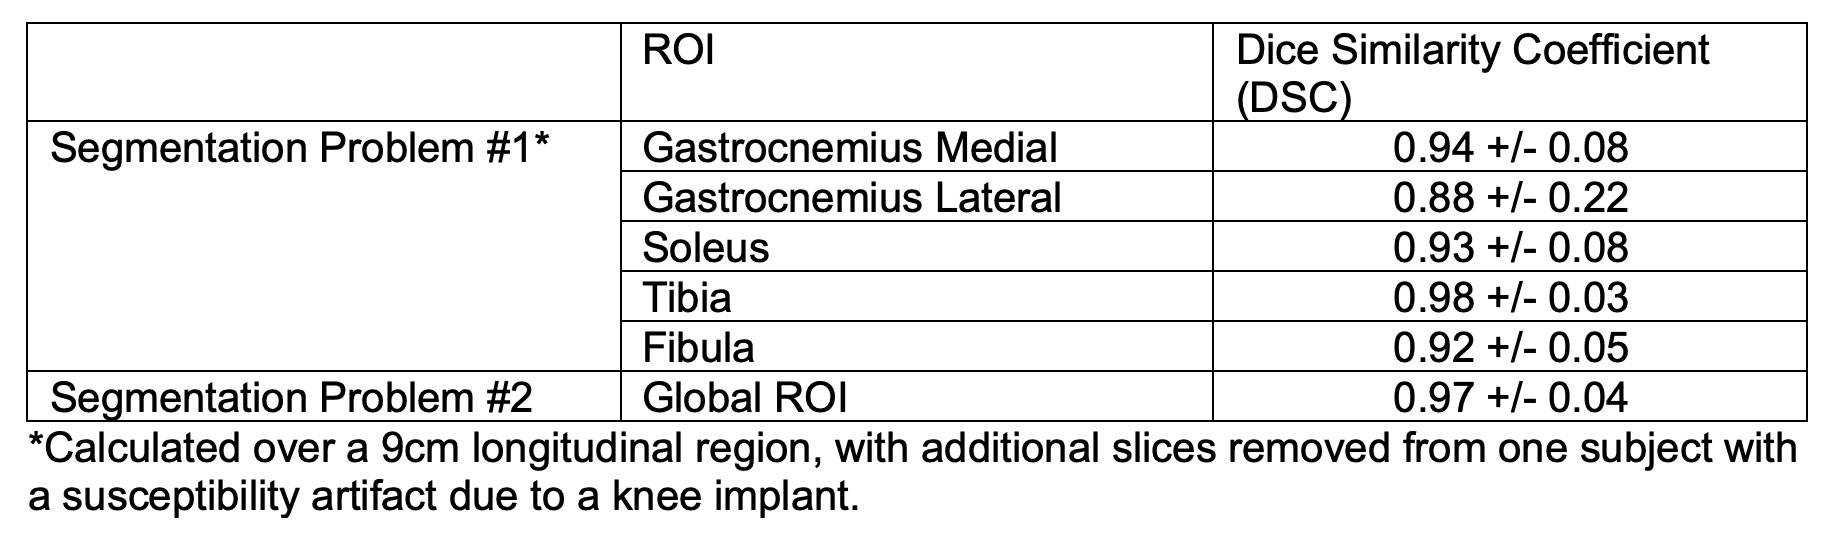
Table 3. CNN evaluation.
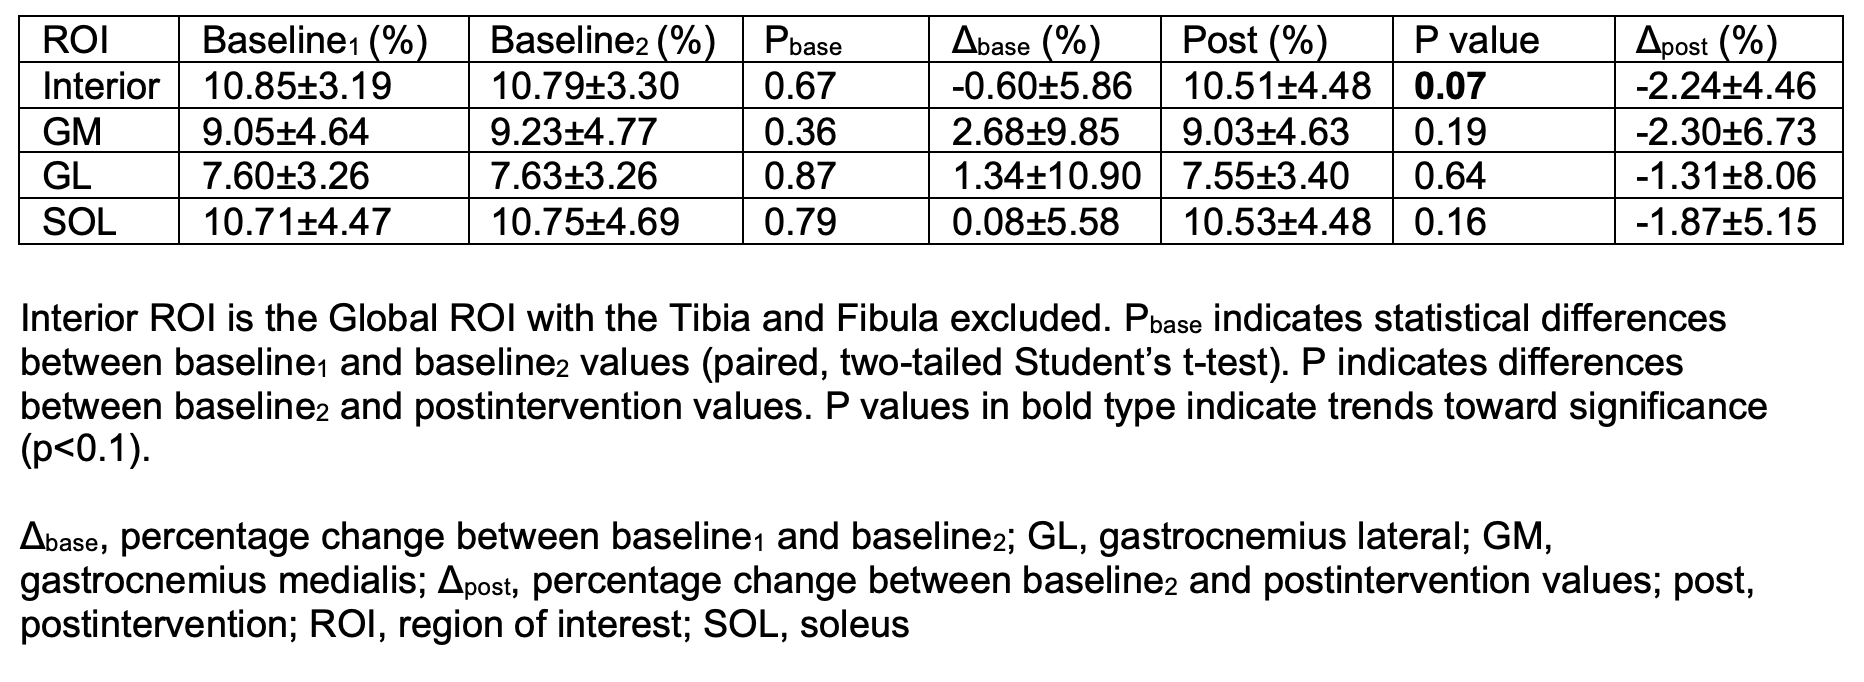
Table 4. Fat fraction results. Fat fraction was calculated using the automated segmentation tool over a 9cm longitudinal region, which was adjusted manually in Baseline2 and Post to match the same anatomical region of the calf as Baseline1. The size of the longitudinal region is adjustable according to the needs to the application.