1135
Differentiating Skeletal Muscle Fiber Composition Using a Bi-Fractal Model of Resting-State Muscle BOLD1School of Biomedical Engineering, McMaster University, Hamilton, ON, Canada, 2Imaging Research Centre, St. Joseph's Healthcare, Hamilton, ON, Canada, 3Department of Medicine and Biomedical Engineering, University of Toronto, Toronto, ON, Canada, 4Electrical and Computer Engineering, McMaster University, Hamilton, ON, Canada, 5Department of Radiology, McMaster University, Hamilton, ON, Canada
Synopsis
Lower leg resting-state BOLD images (n=8 males, 4 endurance, 4 power athletes), were acquired after 30min of rest, allowing for blood-flow normalization. BOLD images were motion corrected and the gastrocnemius and soleus manually segmented using an anatomical reference for their differing twitch fibre profiles. Voxel-wise BOLD mono- and bi-fractal dimension were computed using the scaled windowed variance approach, with linear detrending, removing scanner induced low-frequency variations. The bi-fractal dimension was significantly different between endurance and power groups in both muscles. Specific bi-fractal components more readily distinguished soleus and gastrocnemius for the endurance (I) and power (II) group, when at rest.
Introduction
The blood oxygen dependent level (BOLD) effect uses deoxy/oxy-hemoglobin dependant changes in local magnetic susceptibility to infer changes in blood-flow and metabolic need.1 Most noted as the mechanism underlying brain fMRI, it also has shown utility in characterizing skeletal muscle physiology in healthy and diseased populations.2 However, for diagnosis of neuromuscular disorders muscle biopsy is the gold-standard.3 Muscle biopsy identifies the ratio of type I (high-oxidative/slow-twitch(ST)) to type II (low-oxidative/fast-twitch(FT)) muscle fibers aiding in diagnosis. Electromyography, also used clinically, does not provide fibre specific information.3 A non-invasive technique to characterize skeletal muscle fibre composition, would be clinically invaluable. The hypothesized microvasculature signal origin and differing perfusion demands of type I and II fibres suggest that the muscle BOLD signal could non-invasively characterize muscle fibre profiles.3,4 The temporal fractal dimension (FD), a measure of signal complexity, is proposed to provide this insight.Methods
Eight male subjects (4 endurance (ST): 4 power (FT) athletes) were tested for their calf raise one repetition maximum (1-RM) using the Epley estimate.5 Predominate fibre type groupings were confirmed based on number of 80% 1-RM repetitions.6 Prior to resting-state lower leg functional image collection, participants lay in the scanner bed for 30min to allow for normalization of blood-flow in the legs, shown to affect the skeletal muscle BOLD signal.7 A 16-channel transmit/receive extremity coil and GE 3T MR750 scanner were used. Proton density weighted, fat-supressed images (0.625x0.625x4mm, 15 slices (1mm spacing), TE/TR/flip=30/3000ms/1110) provided anatomic reference. Using the FMRIB Software Library, functional images (2.5x2.5x10mm, 2 slices (no spacing), TE/TR/flip=35/109ms/700, 2434 volumes) were motion corrected, and gastrocnemius (FT dense) and soleus (ST dense) muscles were manually segmented, using the anatomical reference, for their differing twitch fibre profiles.8 The first and last 193 volumes were truncated due to the short TR not satisfying the Ernst angle condition and motion considerations respectively.9 Time-series were normalized by dividing by the first time point, to account for coil sensitivity and proximity signal amplitude dependence. Voxel-wise BOLD timeseries, mono-FD and bi-FD were computed using the scaled windowed variance approach, with linear detrending, removing scanner induced low-frequency variations.10 The segment-wise FD for each voxel was computed over the four 512-point sections, then averaged across segments. Averaging four temporal data points improved voxel FD measure reliability, which is impacted by linear fitting slope estimates. Furthermore, since temporal variability appears invariable at large window sizes, FD measures would be unreliable without segmentation.11 The mono-FD and bi-FD were computed by estimating the slope by fitting one line and two lines, respectively, to the non-saturated portion of the log-log plot for a given voxel and segment. Outlier detection of values greater than three standard deviations from the mean helped to exclude voxels containing connective tissue or vasculature. All mono-FD and bi-FD voxel distributions were negatively skewed. Post log transform correction, distributions failed Jarque-Bera normality tests, therefore Wilcoxon rank sum tests were used to examine within participant differences and Kruskal-Wallis to test within and between group differences.Results
Participant comparison of FD between the gastrocnemius and soleus is summarized in figure 1. Notably the mono-FD, bi-FD component 1 (C1) and 2 (C2) all distinguished the difference between muscles for 5/8 participants. The mean participant bi-FD for C1 and C2 are detailed in figures 2 and 3. The gastrocnemius FD was less than that for the soleus, regardless of component, for 7/8 participants. For C1 the four FT participants showed a lower complexity than the ST counterparts, but their distribution appeared random for C2. The Kruskal-Wallis tests showed significant differences between FT and ST groups regardless of muscle or component with greater differences within/between groups using C1 and between groups in the soleus.Discussion
In both activity groupings, for both FD components, the gastrocnemius FD was lower than the soleus. Furthermore, in both muscles, for both FD components, the FD for the FT group was less than the ST. Both observations suggest a higher FD indicates more ST fibres. Additionally, the bi-FD components had variable discriminability. Specifically, the average p values for C1 ST=0.0468, FT=0.0444, C2 ST=0.5909, FT=0.0053 and average C1 to C2 improvement FT=96.43%, ST=-84.75%. Therefore, C1 classifies both groups better than C2 and the relative classification is worse for FT with C1 and ST with C2. Since we expect muscles to be more homogenous for the given fibre type grouping, a decrease in classification accuracy would suggest a sensitivity to fibre type. Additionally, the FT related component would be expected to have greater predictive power as there is a larger difference in FT content between muscle groups. Therefore, this suggests that C1 is influenced by FT and C2 by ST fibres.Conclusion
Mean voxel bi-FD differentiated the soleus and gastrocnemius within participants and based on endurance/power groupings C1 was shown to be influenced by FT and C2 by ST fibres. This indicates that muscle BOLD bi-fractal characterization could non-invasively provide information on muscle fibre type ratios. Verification of ST and FT composition via muscle biopsy is required to validate these preliminary observations. Nonetheless, this work sets the foundation for development of a non-invasive tool to replace muscle biopsy to assess muscle fiber types, revolutionizing neuromuscular disorder diagnosis.Acknowledgements
Thank you to the St. Joseph's MRI staff for aiding in the data collection process. Funding was provided through an Ontario Graduate Student scholarship granted to JEM and a NSERC Discovery Grant (RGPIN-2017-06318) to MDN.References
1. Ogawa S, Lee TM, Kay AR, et al. Brain magnetic resonance imaging with contrast dependent on blood oxygenation Proc Natl Acad Sci. 1990;87(24):9868–9872.2. Jacobi B, Bongartz G, Partovi S, et al. Skeletal muscle BOLD MRI: From underlying physiological concepts to its usefulness in clinical conditions. J Magn Reson Imaging. 2012;35:1253-1265.
3. Joyce NC, Oskarsson B, Jin LW. Muscle biopsy evaluation in neuromuscular disorders. Phys Med Rehabil Clin N Am. 2012;23(3):609-631.
4. Behnke BJ, Armstrong RB, Delp MD. Adrenergic control of vascular resistance varies in muscles composed of different fiber types: influence of the vascular endothelium. Am J Physiol Regul Integr Comp Physiol. 2011;301(3):R783-R790.
5. LeSuer DA, McCormick J, Mayhew J, et al. The Accuracy of Prediction Equations for Estimating 1-RM Performance in the Bench Press, Squat, and Deadlift, J Strength Cond Res. 1997;11(4):211-213
6. Hall ECR, Lysenko EA, Semenova EA, et al. Prediction of muscle fiber composition using multiple repetition testing. Biol Sport. 2021;38(2):277-283.
7. Elzibak AH, Noseworthy MD, Assessment of diffusion tensor imaging indices in calf muscles following postural change from standing to supine position. Magn Reson Mater Phys. Biol Med. 2014;27:387–395
8. Jenkinson M, Beckmann CF, Behrens TE, et al. FSL. Neuroimage. 2012;62(2):782-790.
9. Helms G, Dathe H, Weiskopf N, et al. Identification of signal bias in the variable flip angle method by linear display of the algebraic Ernst equation. Magn Reson Med. 2011;66(3):669-677.
10. Cannon MJ, Percival DB, Caccia DC, et al. Evaluating scaled windowed variance methods for estimating the Hurst coefficient of time series. Physica A. 1997;241(3-4):606-626.
11. Chung HW, Chung HJ. Correspondence re: J. W. Baish and R. K. Jain, Fractals and Cancer. Cancer Res., 60: 3683–3688, 2000. Cancer Res. 2001;61(22):8347-8348.
Figures
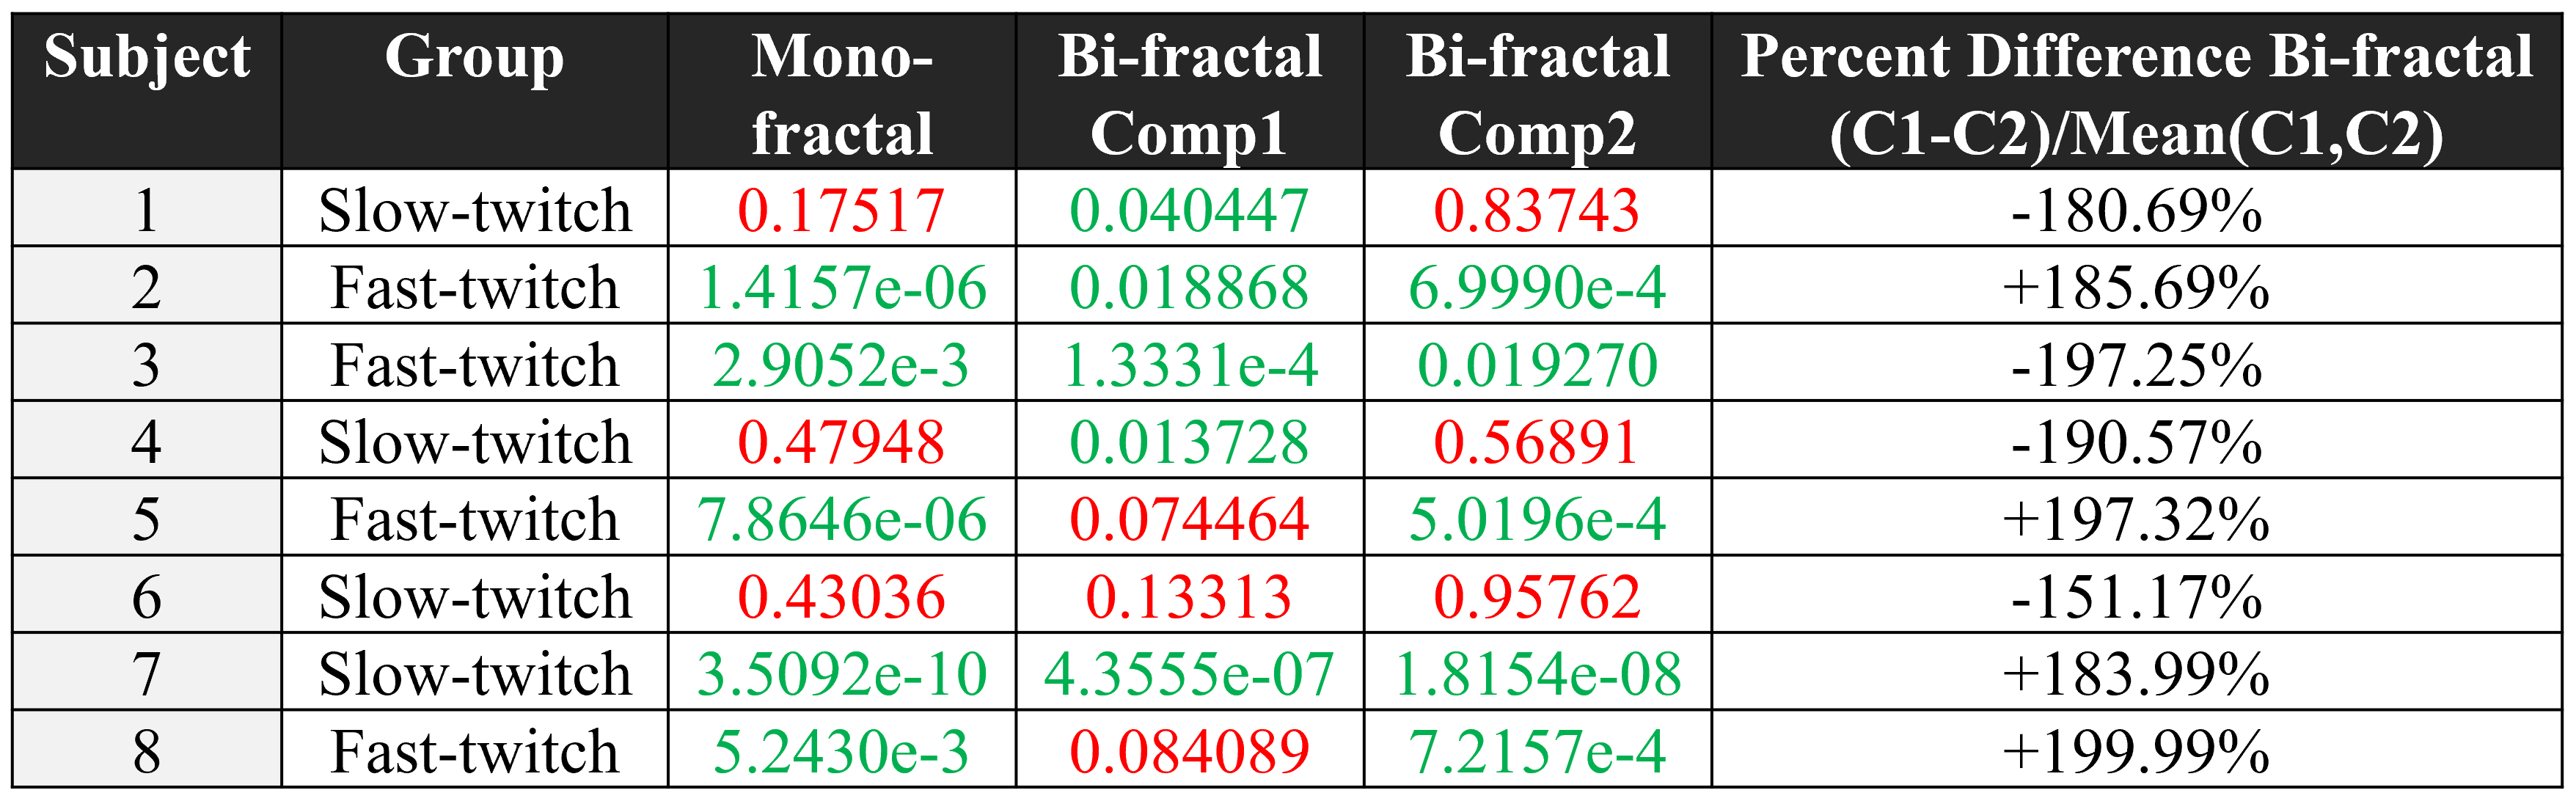
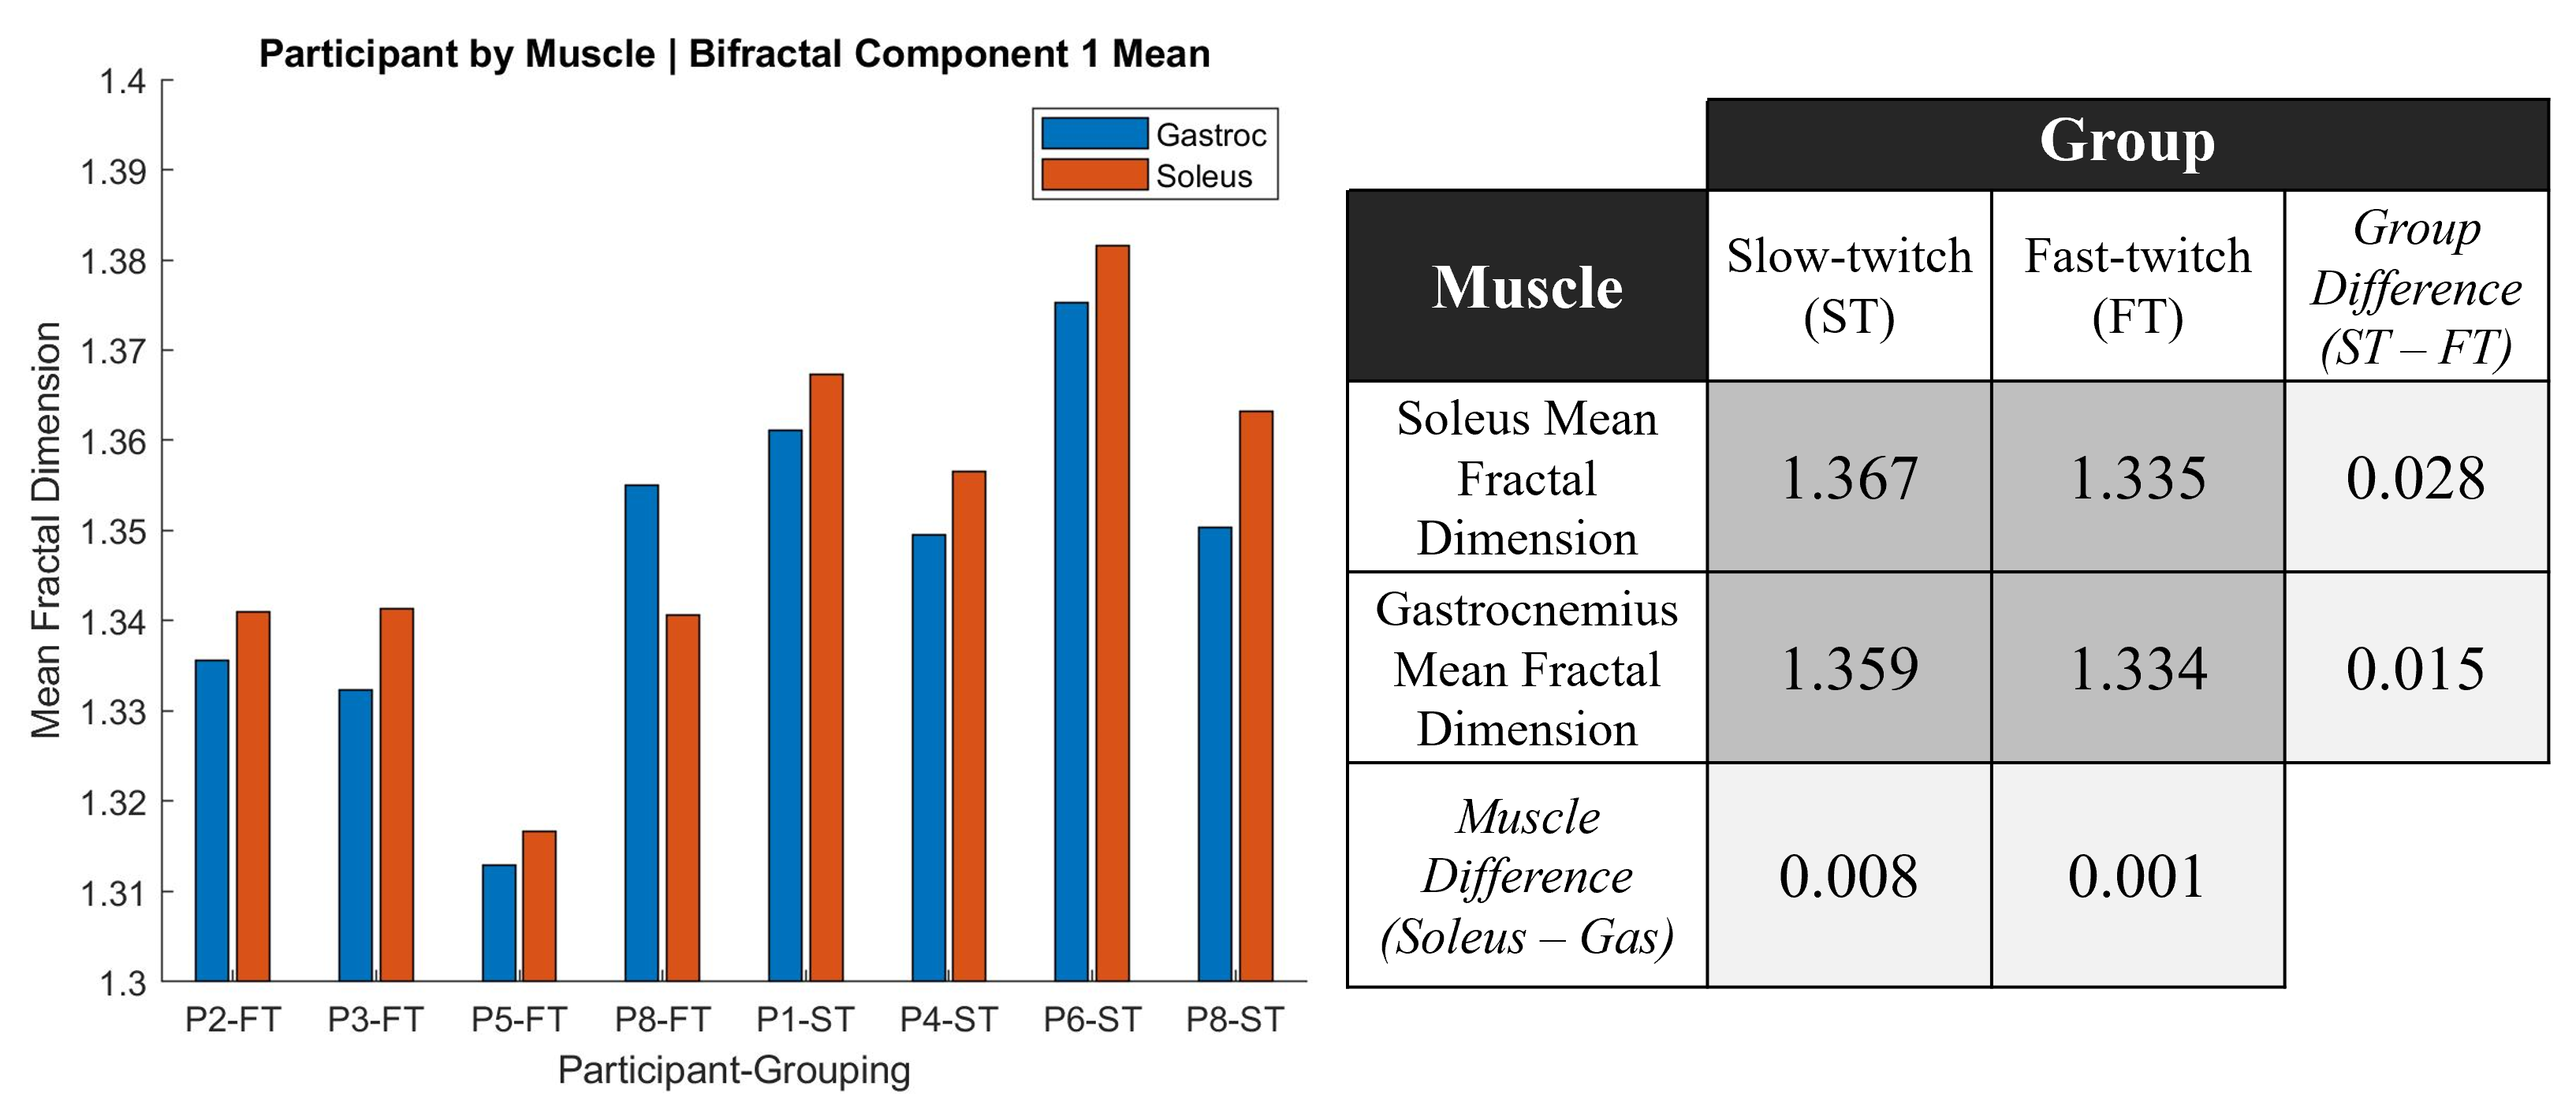
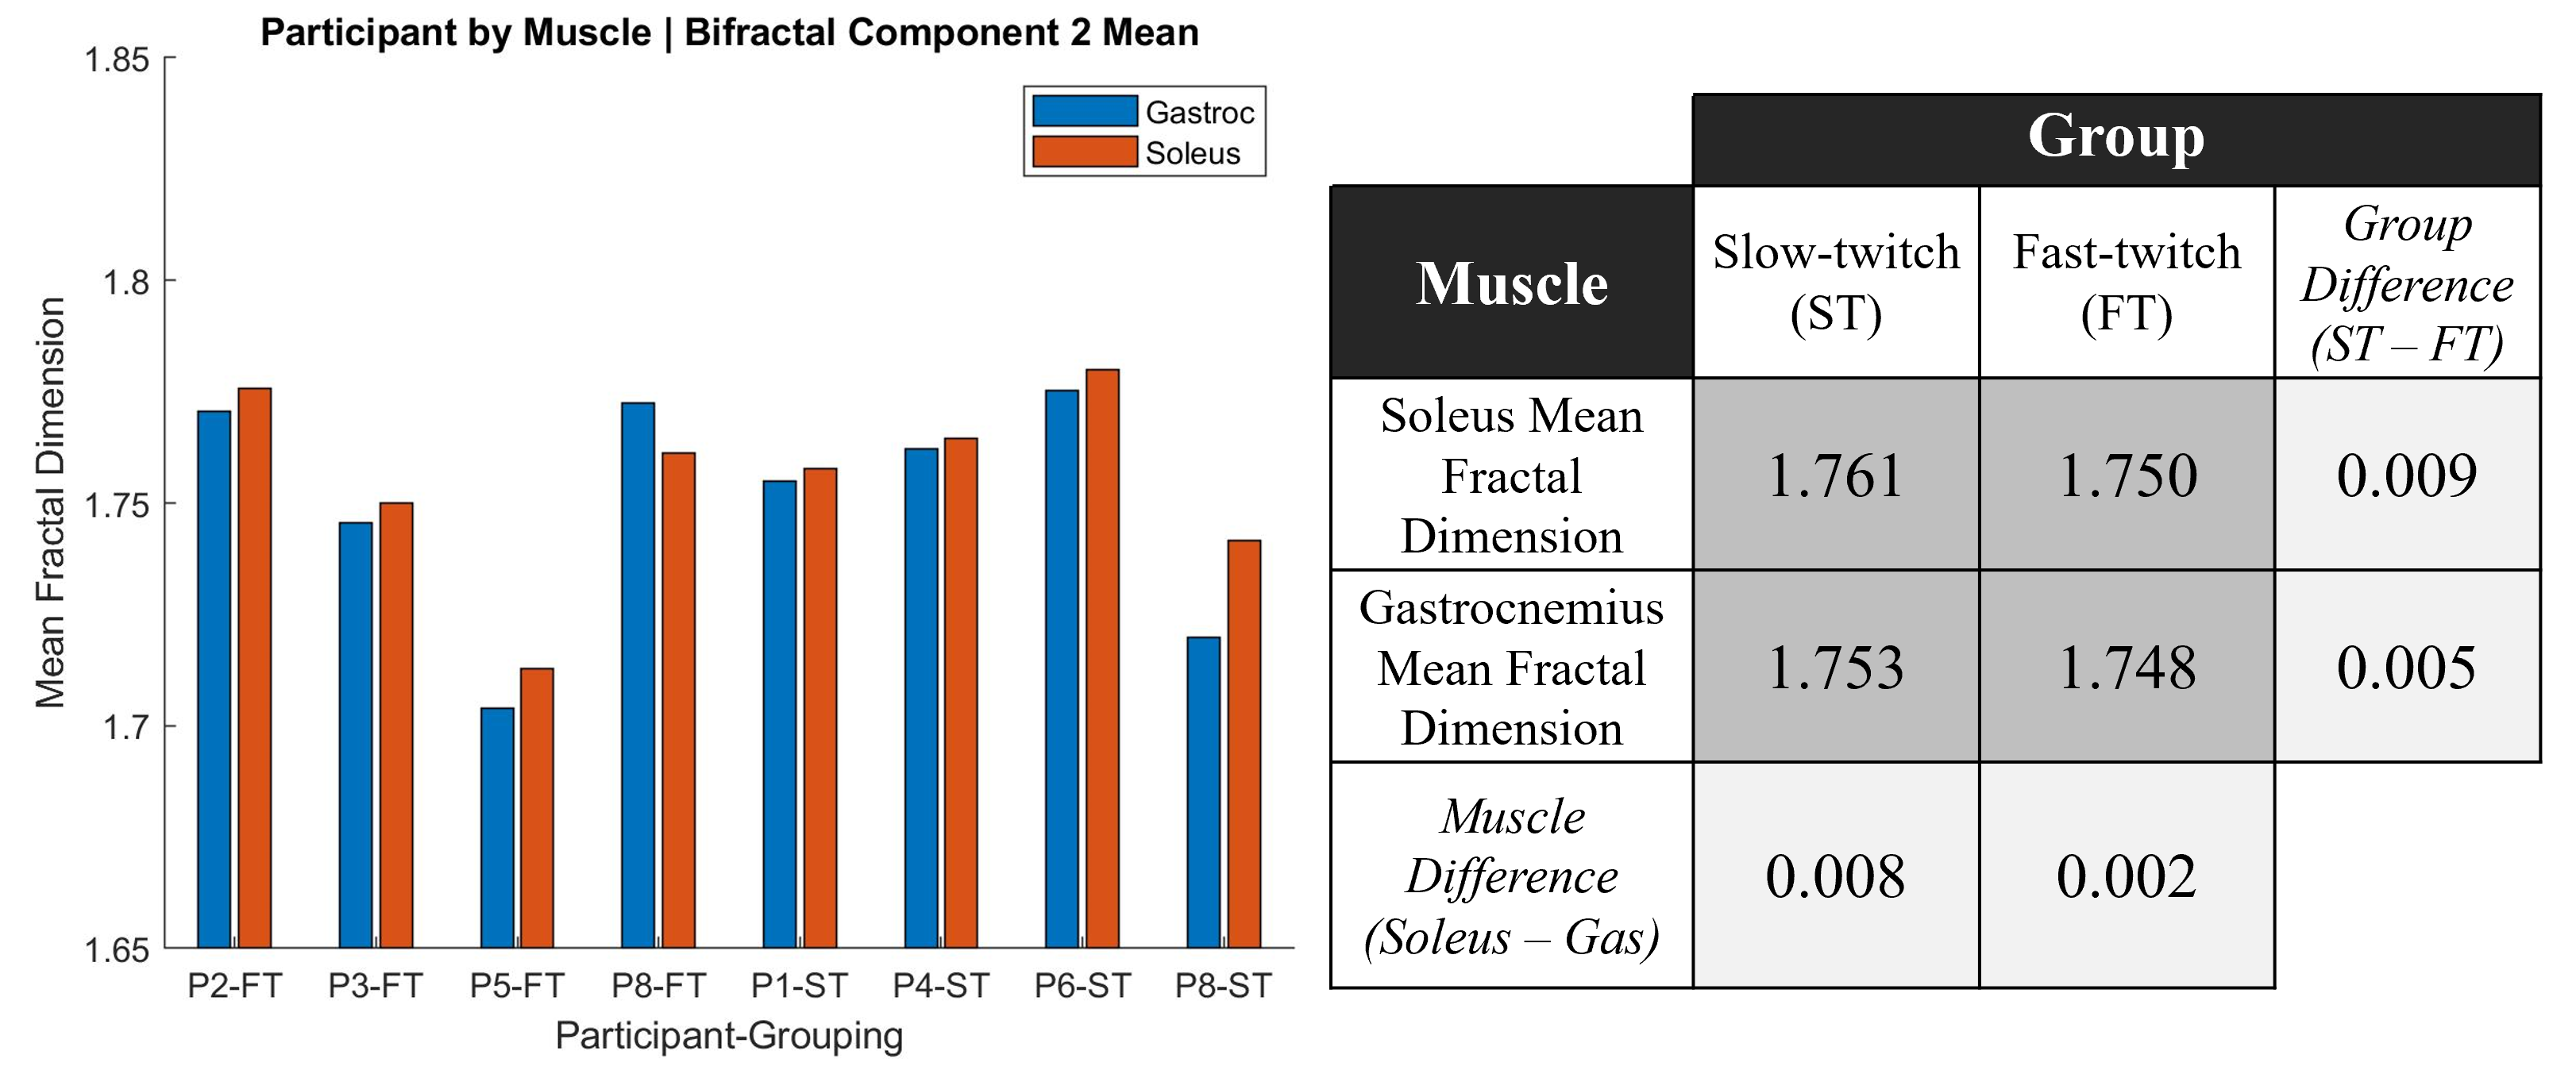
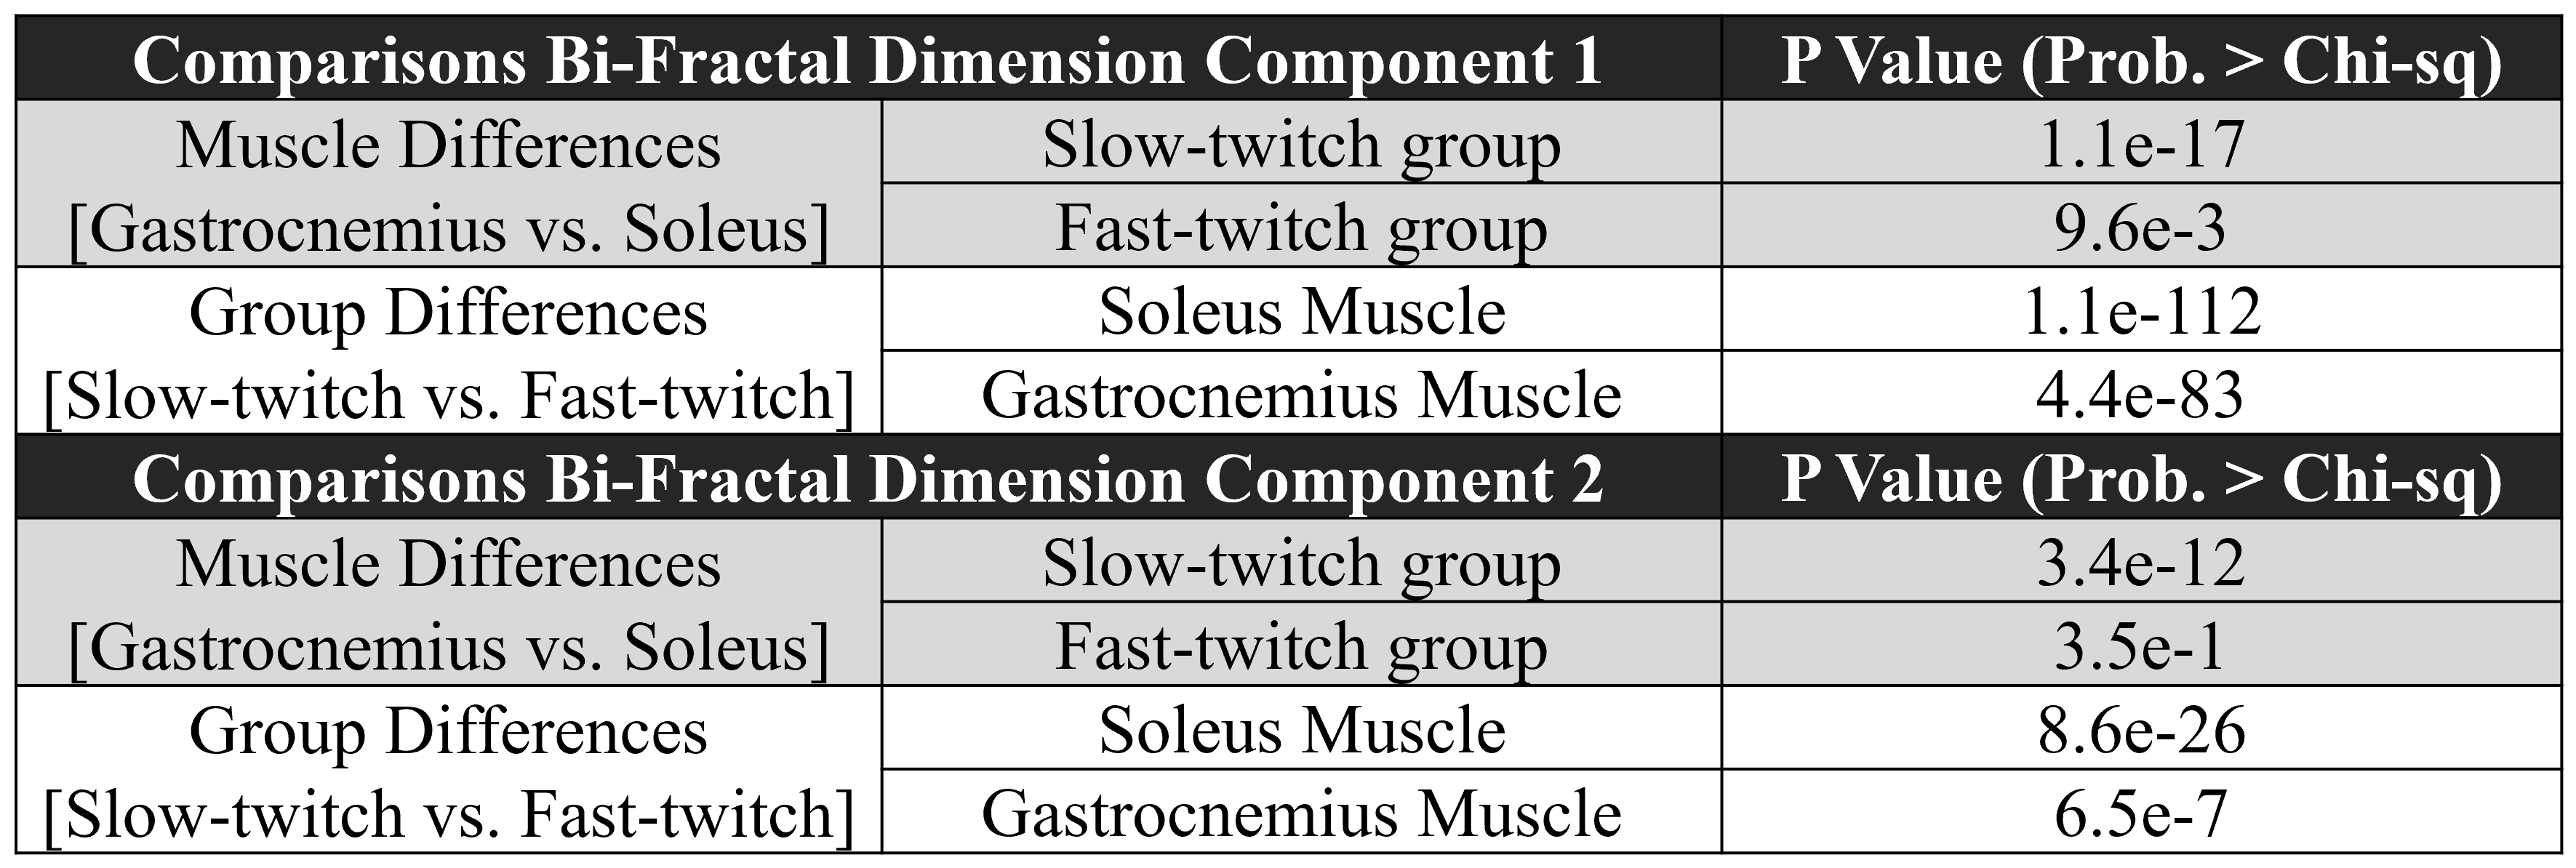
Figure 4: Summary table of Kruskal-Wallis ANOVAs to test differences within activity group differences in muscles and between groups differences, for each component respectively. There is a highly significant difference between fast- and slow-twitch groups regardless of muscle or component. Notably there are greater differences within/between groups using component 1 compared to component 2 and between groups in the soleus versus the gastrocnemius.