1134
Creatine chemical exchange saturation transfer (CrCEST) MRI reproducibility in healthy adults at 3T1Diagnostic Imaging, St. Jude Children's Research Hospital, Memphis, TN, United States
Synopsis
CrCEST MRI indirectly measures creatine as it exchanges amine (-NH2) protons with free water in the skeletal muscle. When performed on the calf after plantar flexion exercise, creatine recovery data can be obtained in all four major calf muscles. While 2D CrCEST has been performed in adults before, no studies showing its reproducibility have been published. Here, we show that the essential muscles in plantar flexion movement, gastrocnemius muscles, in the calf are candidates for reproducible CrCEST data.
Introduction
Oxidative Phosphorylation (OXPHOS) plays an essential role in muscle metabolism [1]. Phosphocreatine (PCr) donates a phosphate group by converting into creatine (Cr) to support ATP synthesis. This vital mechanism of conversion of PCr to Cr is normally measured using 31P MRS [2]. Creatine Chemical Exchange Saturation Transfer (CrCEST) MRI can be a great tool to map mitochondrial energetics in vivo in tissues with a large energy demand, such as exercising skeletal muscle [3]. Particularly, CrCEST is advantageous in understanding mitochondrial bioenergetics in patients with inborn mitochondrial neuromuscular disorders [4]. CrCEST imaging uses a 1H volume coil to indirectly image creatine as it exchanges amine (-NH2) protons with free water. Here, we test the reproducibility of CrCEST based creatine decay post-exercise in healthy adults for future clinical trials.Methods
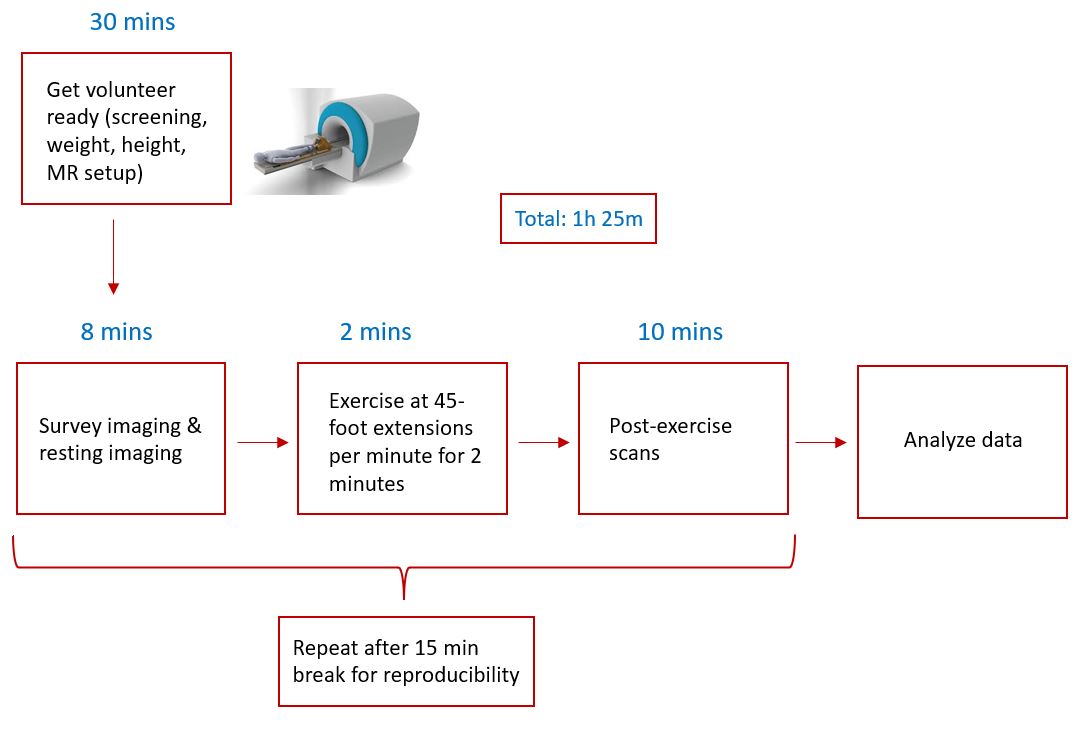
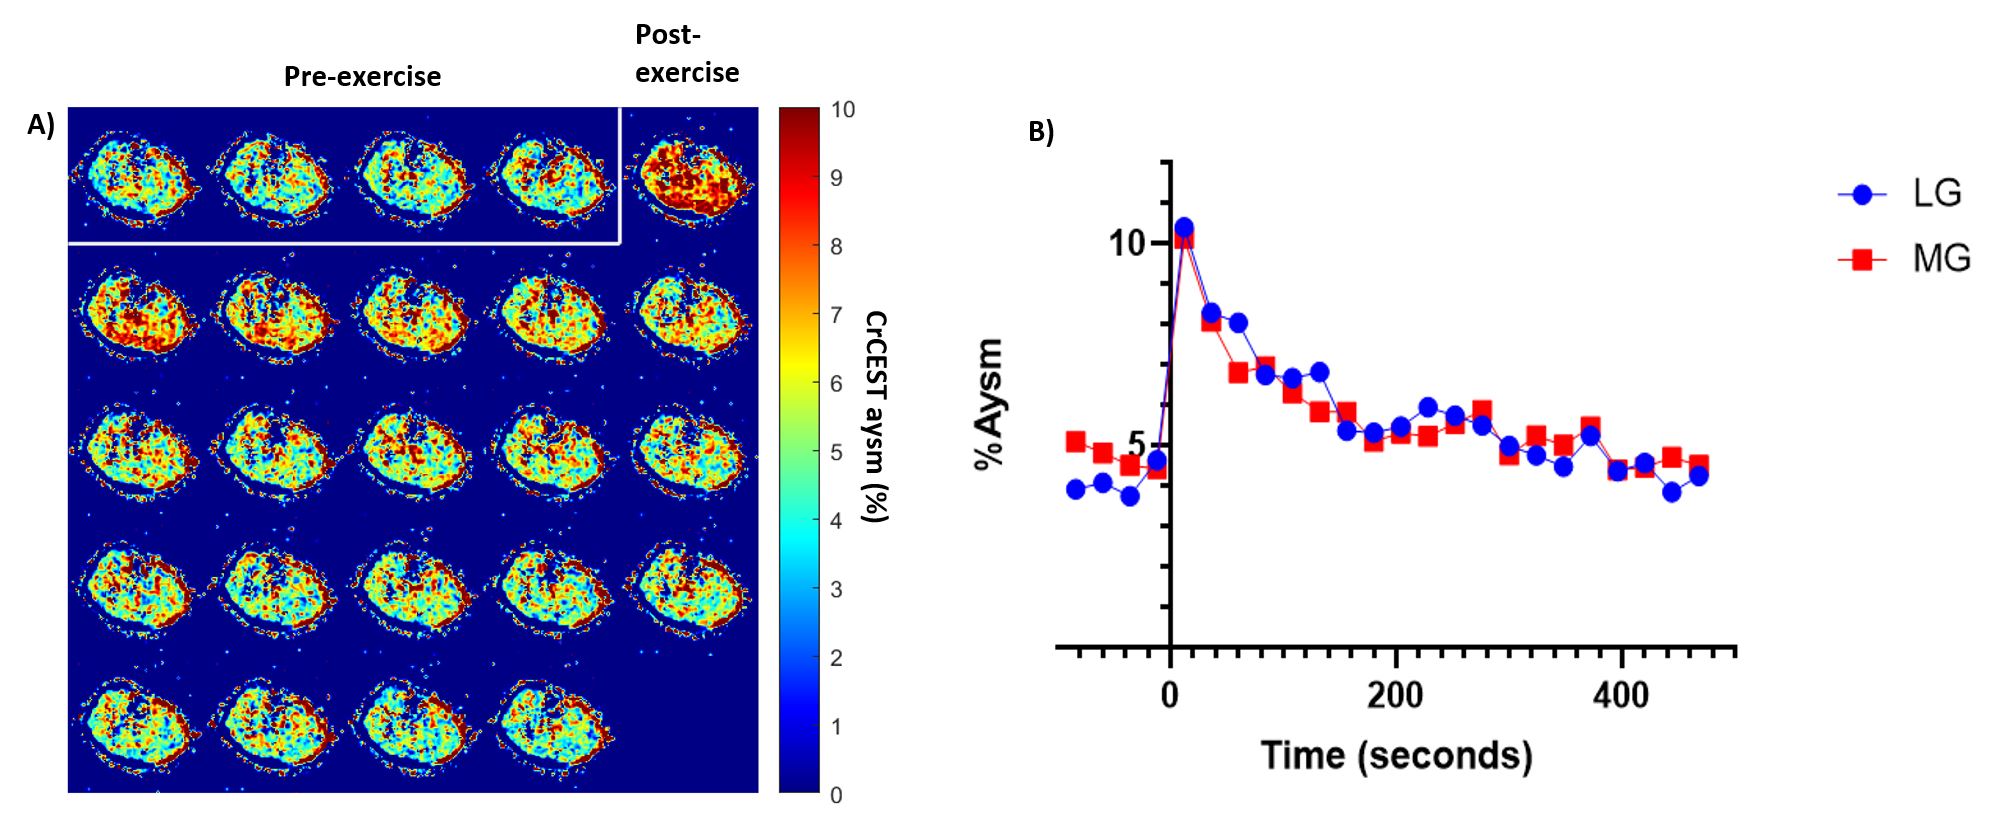
This study was approved by local IRB, and all participants gave written informed consent. We used CrCEST imaging in seven healthy adults (M 5, F 2, Age: 23-52 years) who performed plantar flexion exercise on a programmable MR compatible pneumatical ergometer (Trispect, Ergospect) at 45 BPM for 2 minutes. Creatine CEST contrast was measured in a 10 mm thick transverse slice placed in the right calf for two minutes before exercise and for eight minutes after exercise on a 3T scanner (Siemens, PRISMA) [4]. For CrCEST imaging, the calf is placed inside a 15-channel knee coil. We collected water saturation with shift reference (WASSR) [5] and B1 maps for B0 and B1 correction. Six images were acquired over 24 s intervals with saturation frequency offsets of ±1.5, ±1.8, and ±2.1 ppm. A 500 ms saturation pulse train was applied consisting of five 99.6 ms Hanning windowed pulses with 150 Hz B1 amplitude separated by a 0.4 ms inter-pulse delay. A fat saturation pulse was applied, followed by a single-shot spoiled gradient-echo readout with centric encoding, flip angle 10°, FOV 160x160 mm, matrix 128x128, TR 6.0 ms, TE 3 ms, slice thickness 10mm [4]. Four muscles in the calf were regions of interest (ROI): tibialis anterior, soleus, lateral gastrocnemius (LG), and medial gastrocnemius (MG). After 15 minutes of rest outside the scanner, the subject repeated the exercise for a second time. Both scans are processed on MATLAB for CrCESTasym mapping and creatine recovery time constant (TCr) [6, 7]. The CrCEST scanning and image processing is depicted in Figure 1. Figure 2a shows a typical CrCEST map pre- and post-exercise in calf muscle, and b. shows the increase and recovery of CrCEST in LG and MG muscle groups.Results and Discussion
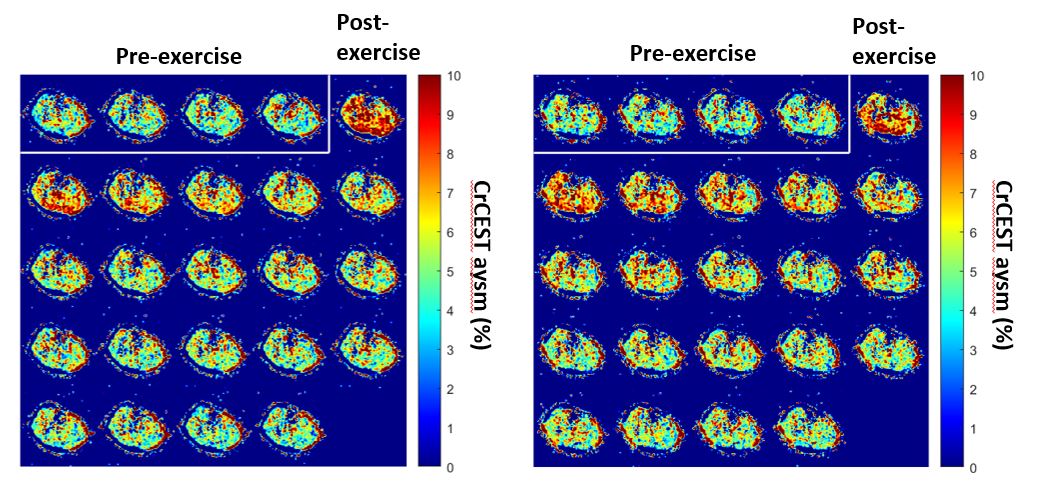
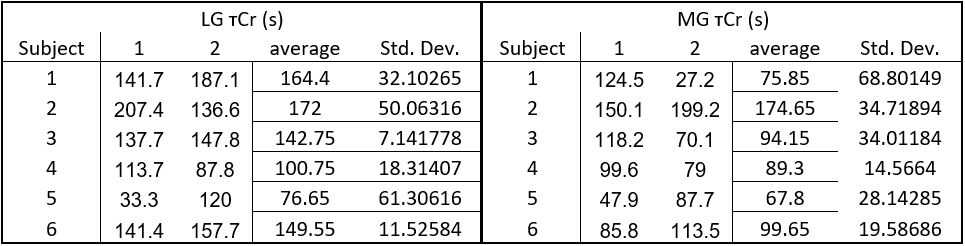
Out of seven healthy adults measured, six had analyzable data and hence were used for testing reproducibility of this method in the skeletal muscle groups involved in the plantar flexion exercise. Due to lack of engagement during exercise, the tibialis anterior and soleus had a high variance in creatine recovery constant (тCr) and were excluded from this analysis. All subjects performed the exercise and CrCEST scan twice. Figure 3 shows baseline and post-exercise CrCEST recovery maps in one subject. Among all subjects, the average тCr in the LG is 134.4 ± 30.1 seconds, and the тCr in the MG is 100.2 ± 33.3 seconds (Table 1). Both, LG and MG muscles are good candidates for reproducibility in CrCEST energetics. Further, the тCr recovery time was found to be higher than reported тPCr value measured via direct 31P MRS detection [8]. Further experiments are ongoing to identify the reason of this difference between the two techniques.Conclusion
CrCEST is a novel tool adept to provide OXPHOS imaging data. After analysis of the тCr in the LG and MG following plantar flexion exercise, both muscles provide reproducible CrCEST data in healthy adults. The variation in тCr in the MG was higher than observed in the LG.Acknowledgements
N/AReferences
[1] Chance B, Williams GR. Respiratory enzymes in oxidative phosphorylation. III. The steady state. J Biol Chem. 1955;217(1):409-427.
[2] Sedivy P, Dezortova M, Rydlo J, Drobny M, Krššák M, Valkovič L, Hajek M. MR compatible ergometers for dynamic 31P MRS. J Appl Biomed. 2019;17(2):91-98. doi: 10.32725/jab.2019.006.
[3] Kogan F, Haris M, Debrosse C, et al. In vivo chemical exchange saturation transfer imaging of creatine (CrCEST) in skeletal muscle at 3T. J Magn Reson Imaging. 2014;40(3):596-602. doi:10.1002/jmri.24412
[4] DeBrosse C, Nanga RPR, Wilson N, et al. Muscle oxidative phosphorylation quantitation using creatine chemical exchange saturation transfer (CrCEST) MRI in mitochondrial disorders. JCI Insight. 2016;1(18):e88207. Published 2016 Nov 3. doi:10.1172/jci.insight.88207
[5] Kim M, Gillen J, et al. Water saturation shift referencing (WASSR) for chemical exchange saturation transfer (CEST) experiments. Magn Reson Med. 2009;61(6):1441-1450. doi:10.1002/mrm.21873
[6] Kogan F, Haris M, Singh A, et al. Method for high-resolution imaging of creatine in vivo using chemical exchange saturation transfer. Magn Reson Med. 2014;71(1):164-172. doi:10.1002/mrm.24641
[7] Wilson NE. ExerciseCEST. Zenodo. http://doi.org/10.5281/zenodo.59640 Published August 4, 2016.
[8] Schmid AI, Meyerspeer M, Robinson SD, et al. Dynamic PCr and pH imaging of human calf muscles during exercise and recovery using (31) P gradient-Echo MRI at 7 Tesla. Magn Reson Med. 2016;75(6):2324-2331. doi:10.1002/mrm.25822
Figures