1133
Fast scan downfield MRS for NAD+ quantification in human skeletal muscle in vivo at 7 T1Perelman School of Medicine at The University of Pennsylvania, Philadelphia, PA, United States, 2Radiology, Center for Advance Metabolic Imaging in Precision Medicine, Perelman School of Medicine at The University of Pennsylvania, Philadelphia, PA, United States, 3Bioengineering, University of Pennsylvania, Philadelphia, PA, United States
Synopsis
1H downfield MRS is an emerging technique for quantification of in vivo NAD+ concentrations in human tissue. Though NAD+ can be detected in the skeletal muscle downfield spectrum (>4.7 ppm) despite its low concentration (<1 mM), quantification of [NAD+] in muscle disorders is further challenged by depleted NAD+ and long scan times. To address this challenge, we developed and optimized a downfield MRS technique for rapid measurement of NAD+ targeting calf skeletal muscle in a large voxel approach. This optimized technique has allowed us rapid measurement of NAD+ and shortened scan time considerably compared to previously published MRS techniques.
INTRODUCTION
Nicotinamide adenine dinucleotide (NAD+) is an important coenzyme involved in the redox reactions. It also plays a vital role in the cellular metabolism and are also involved in many vital processes such as aging, DNA repair, and apoptosis1-6. Currently, there is a growing interest in exploring NAD+ supplementation to reduce the disease burden in patients with mitochondrial dysfunction7-13. However, 1H MRS techniques for measuring NAD+ in vivo are challenged by its in vivo concentration (<1 mM) and cross-relaxation with water protons. Recently, non-water suppressed downfield proton magnetic resonance spectroscopy (1H MRS, >4.7 ppm) has been shown to detect NAD+ in the brain14-17 and its feasibility in calf muscle was demonstrated at 7 T18. To address its low concentration and cross-relaxation, we developed and optimized a rapid scan protocol using voxels encompassing more than one skeletal muscle region of the calf. By virtue of their cross-relaxation with water, an optimized protocol could exploit the very short effective T1 to achieve short repetition times and reduce scan time. The purpose of this abstract was to determine the feasibility of [NAD+] quantification in calf muscle using a short TR, large voxel approach with scan times under 10 minutes.METHODS
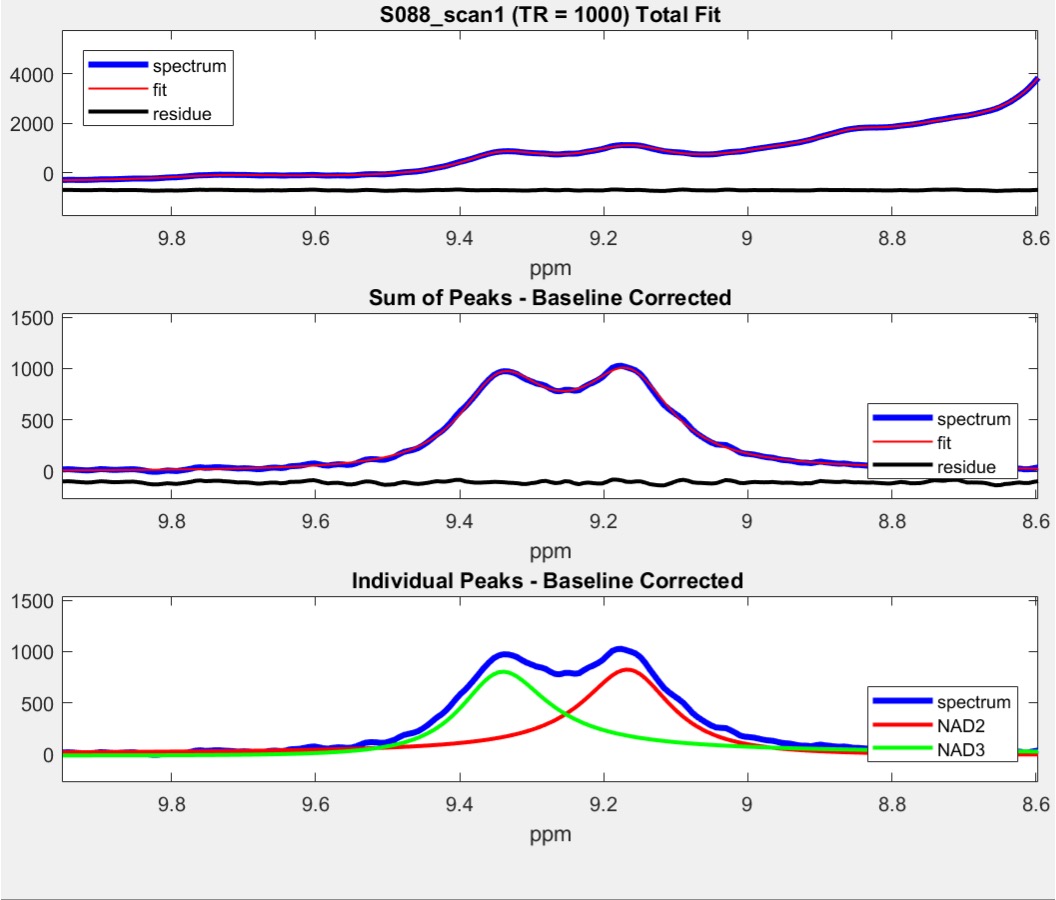
Five healthy subjects (4 Male, 1 Female, aged 22-33Y) provided written consent to participate in an approved IRB study of calf skeletal muscle at 7 T. Downfield 1H MRS data were obtained at 7 T (MAGNETOM Terra, Siemens Healthcare, Erlangen, Germany) using a single-channel transmit/28-channel receive phased array knee radio frequency coil (Quality Electrodynamics, Mayfield Village, OH, USA). A spectrally selective 90° E-BURP pulse14 centered at 9.1 ppm was used to excite the downfield metabolites with a band-width (BW) of 2 ppm (TR/TE: 1000/18ms, 256 averages), and 3 narrow spatially selective refocusing 180° Shinnar-Le Roux (SLR) pulses (BW: 800Hz) were used for localization as described in our previous study17. Two more spectra were acquired with same number of averages at TR of 750 ms and 590 ms. Total acquisition time for NAD+ spectra including water eddy (16 averages & 8 dummy scans; 24s) and water reference with long TR of 10s (16 averages & 8 dummy scans; 2m24s) were approximately 5, 6 and 7 minutes. A large voxel was positioned within the calf to cover the maximum muscle area and the voxel dimensions varied across the volunteers to cover their maximum muscle area (160-250 mL). The NAD+ peaks at 9.14 (labelled NAD2) and 9.33ppm (labelled NAD3) were well-resolved and used for analysis. They were fitted in the time domain using Hankel singular value decomposition (HSVD)19,20 to model Lorentzian signal components. NAD+ concentrations were calculated based on the equation reported in our prior study17 except that the values for calf muscle were incorporated.RESULTS
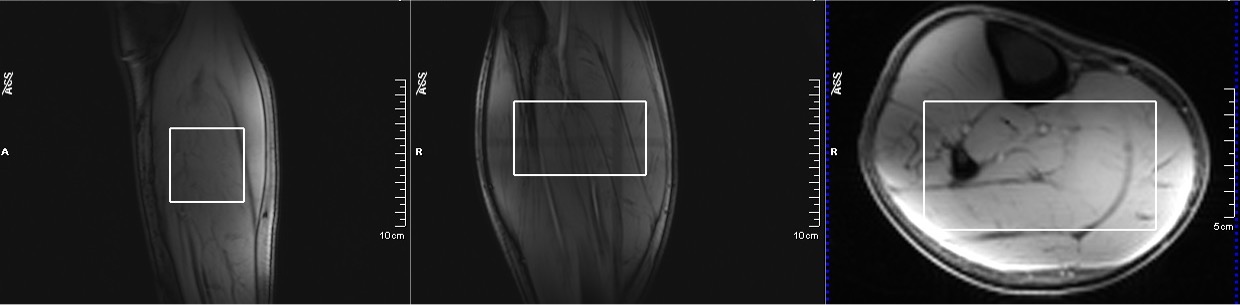
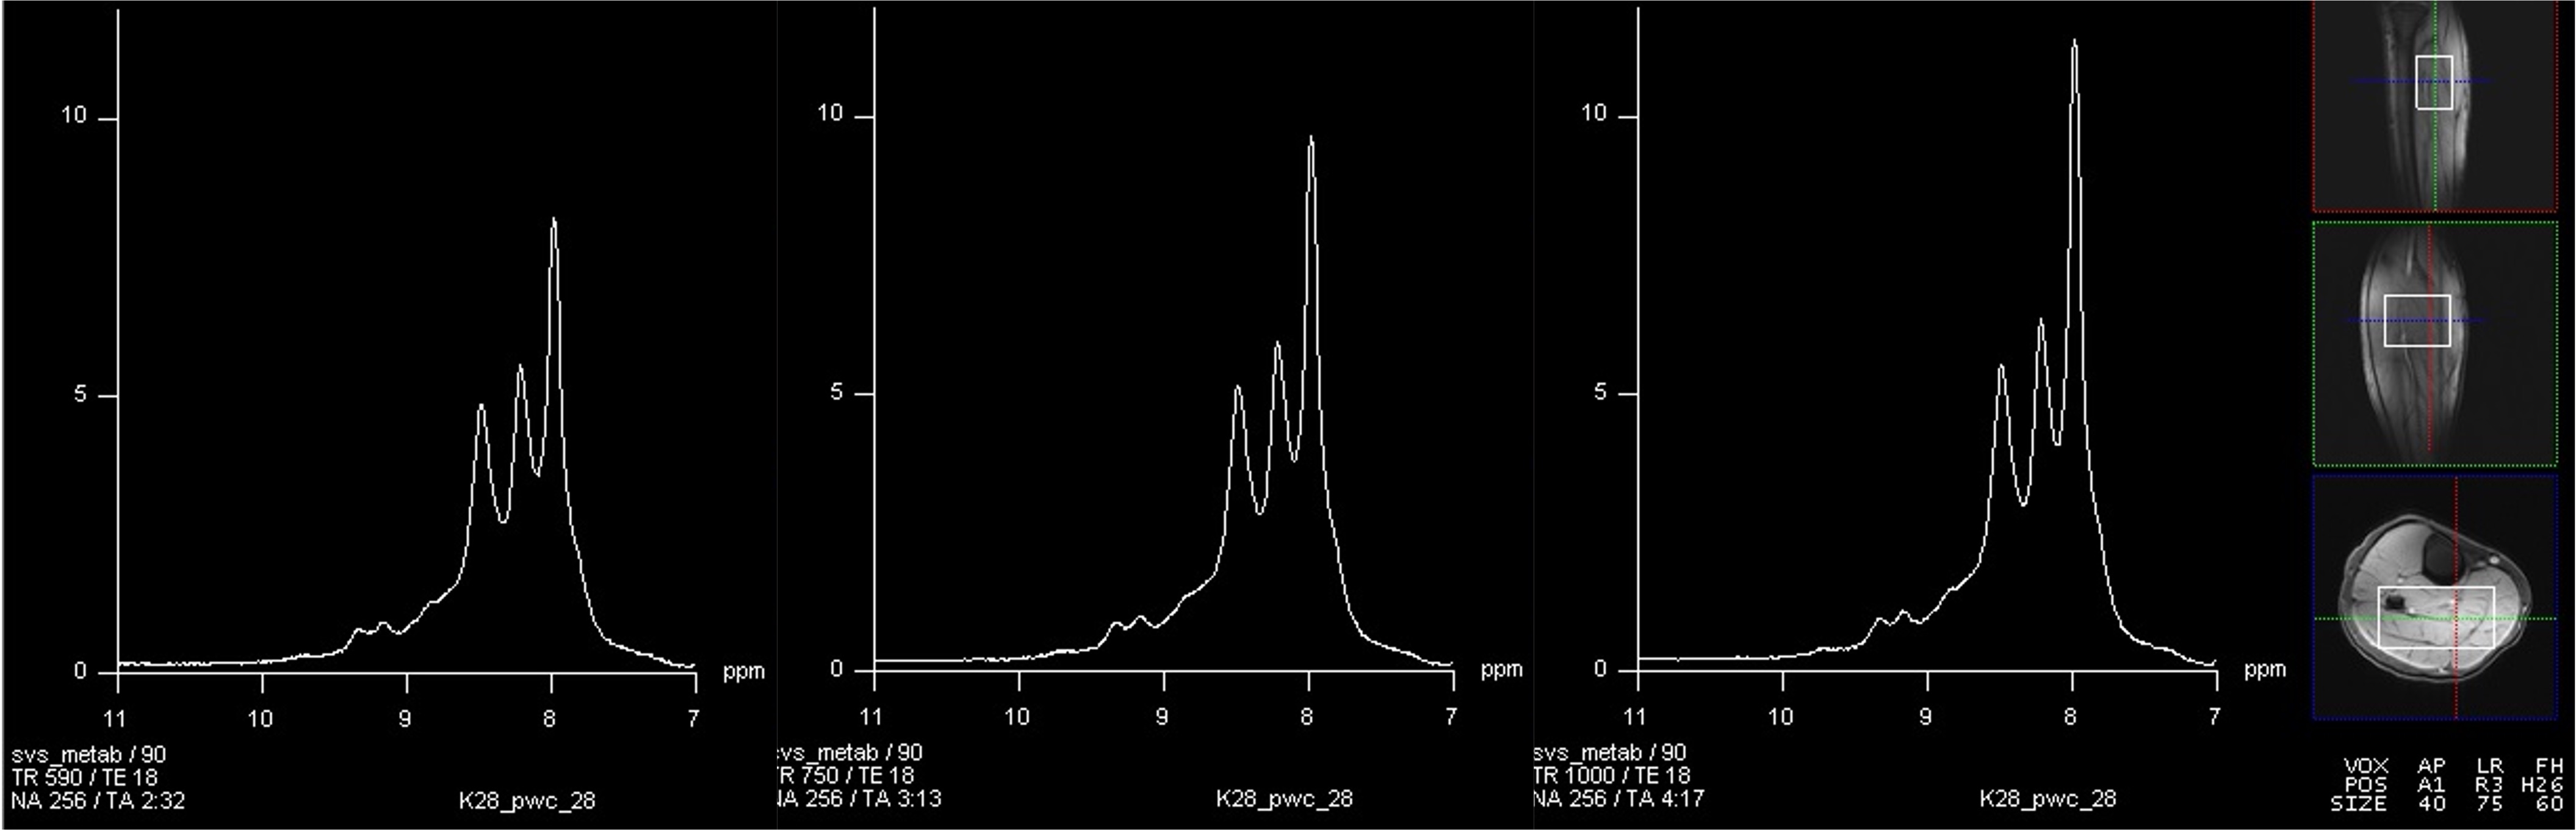
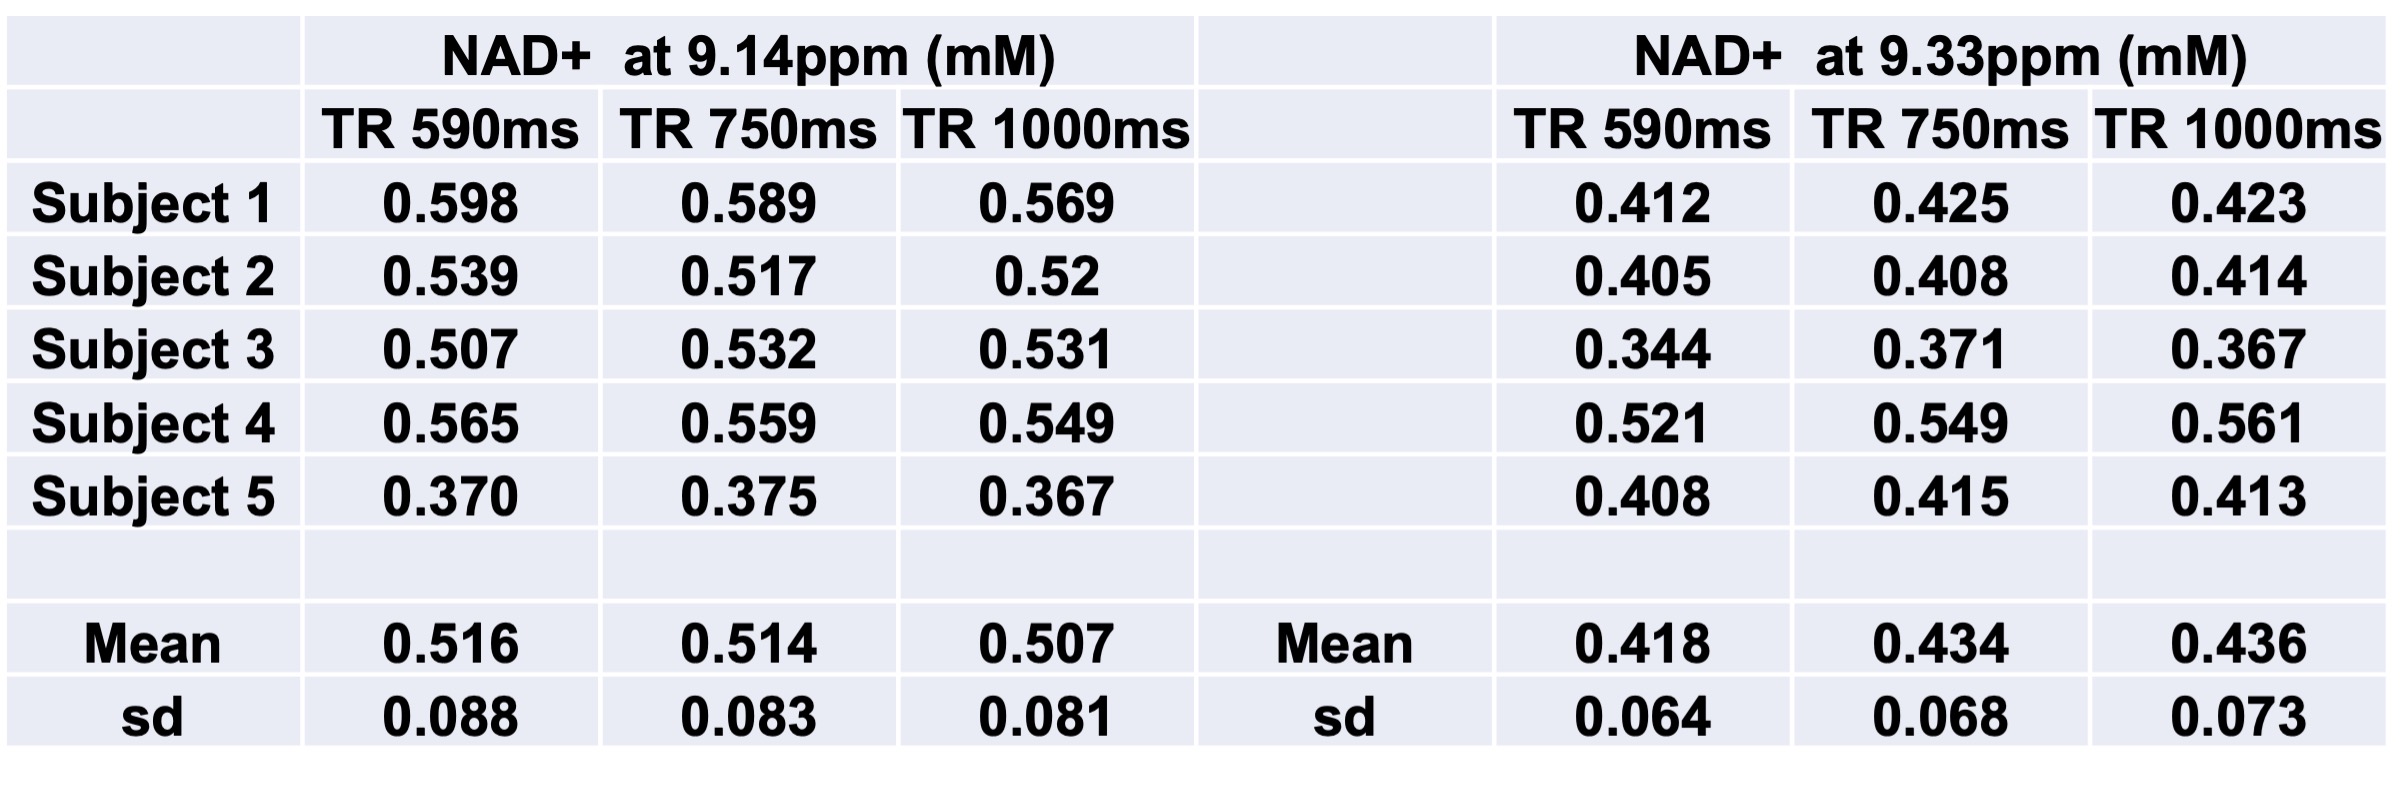
A representative large voxel from which the downfield MRS was acquired from the calf muscle of one of the volunteers in vivo is shown in Figure 1. Full-width at half maximum for all the subjects were between 22-27 Hz. A representative downfield NAD+ spectrum from one of the volunteers is shown for all the three TR’s of 590/750/1000ms with same scale as that of TR=1000 ms to represent any residual effects of reduced TR on the NAD+ peaks as shown in Figure 2 and the quality of fit for NAD+ peaks for the same subject data by HSVD is shown in Figure 3. The NAD+ peak fitted values are listed in Figure 4 for all the five volunteers scanned so far. Mean NAD+ peak concentration for 9.14 and 9.33ppm peaks from all the subjects were 0.507±0.08 mM and 0.436±0.07, respectively for data acquired at TR of 1000ms, while the concentrations observed at the shorter TR of 590ms was similar.DISCUSSION
1H resonances in NAD+ in the downfield spectrum have considerable cross-relaxation with water, enhancing their relaxation rate as much as 10-fold15,16. We were able to exploit the very short relaxation rate to reduce scan time from approximately 13 minutes to 7 minutes at TR=1000ms and 5 minutes at TR=590ms. With these larger voxel acquisitions, the NAD+ resonances were more easily detected than in smaller voxels and longer protocols. Motion of the leg during very long skeletal muscle MRS acquisitions may broaden the overall linewidth and complicate NAD+ measurement in vivo. The optimized 5 and 7 min protocols achieve more rapid NAD+ measurements and mitigate the effects of leg motion. A limitation of the technique is that the voxel includes more than one skeletal muscle in vivo. However, as the spatial distribution of NAD+ in individual muscle regions is not currently known, and patients with muscle disorders tend to be affected at more than a single muscle group, there may be considerable advantages of a fast MRS protocol to a more localized protocol. Additional research investigating the spatial distribution of NAD+ in skeletal muscle and patients with muscle disorders would illuminate these concepts. Further work is in progress to make the peak fitting more robust for better quantification of NAD+ peaks.CONCLUSION
We were able to reduce the scan time to ~5min with a good quality down-field NAD+ spectra and it can be readily implemented as an add-on scan to any clinical protocol involving the calf muscle metabolism.Acknowledgements
Research reported in this publication was supported by the National Institute of Biomedical Imaging and Bioengineering of the National Institutes of Health under award Number P41EB029460 and by the National Institute of Aging of the National Institute of Health under award Number R56AG062665.References
1. Stein LR, Imai S. The dynamic regulation of NAD metabolism in mitochondria. Trends Endocrinol Metab. 2012;23:420-38.
2. Bai P, Canto C. The role of PARP-1 and PARP-2 enzymes in metabolic regulation and disease Cell Metab. 2012;16:290-95.
3. Gupte R, Liu Z, Kraus WL et al. PARPs and ADP-ribosylation: recent advances linking molecular functions to biological outcomes. Genes Dev 2017;31:101-126.
4. Cohen MS, Chang P. Insights into the biogenesis, function, and regulation of ADP-ribosylation. Nat Chem Biol. 2018;14:236-243.
5. Houtkooper RH, Pirinen E, Auwerx J. Sirtuins as regulators of metabolism and healthspan. Nat Rev Mol Cell Biol. 2012;13:225-228.
6. Nikiforov A, Kulikova V, Ziegler M. The human NAD metabolome: Functions, metabolism and compartmentalization. Crit Rev Biochem Mol Biol. 2015;50:284-297.
7. Neubauer S. The failing heart:an engine out of fuel. N Engl J Med. 2007;356:1140-1151.
8. Marin-Garcia J, Goldenthal MJ. Mitochondrial centrality in heart failure. Heart Fail Rev. 2008;13(2):137-150
9. Yamamoto T, Byun J, Zhai P, et al. Nicotinamide mononucleotide, an intermediate of NAD+ synthesis, protects the heart from ischemia and reperfusion. PLoS One. 2014;9(6):e98972.
10. Canto C, Houtkooper RH, Pirinen E, et al. The NAD(+) precursor nicotinamide riboside enhances oxidative metabolism and protects against high-fat diet-induced obesity. Cell Metabolism. 2012;15:838-847.
11. Yoshino J, Baur JA, Imai SI. NAD(+) Intermediates: The Biology and Therapeutic Potential of NMN and NR. Cell Metab. 2018;27:513–528
12. Rajman L, Chwalek K, Sinclair DA. Therapeutic Potential of NAD-Boosting Molecules: The In Vivo Evidence. Cell Metab. 2018, 27, 529–547.
13. Airhart SE, Shireman LM, Risler LJ, et al. An open-label, non-randomized study of the pharmacokinetics of the nutrional supplement nicotinamide riboside (NR) and its effects on blood NAD+ levels in healthy volunteers. PLoS ONE 2017;12:e0186459.
14. Geen H, Freeman R. Band-selective radiofrequency pulses. J Magn Reson. 1991;93:93-141.
15. de Graaf RA, Behar KL. Detection of cerebral NAD(+) by in vivo (1)H NMR spectroscopy. NMR Biomed. 2014;27:802-809.
16. de Graaf RA, De Feyter HM, Brown PB, et al. Detection of cerebral NAD+ in humans at 7T. Magn Reson Med. 2017;78:828-835.
17. Bagga P, Hariharan H, Wilson NE, et al. Single-voxel 1H MR spectroscopy of cerebral nicotinamide adenine dinucleotide (NAD+) in humans at 7T using a 32-channel volume coil. Magn Reson Med. 2020;83:806-814.
18. Bagga P, et al. In vivo detection of NAD+ in human calf muscle at 7T using 28 channel knee volume coil at 7T. ISMRM&SMRT Annual Meeting and Exhibition 2018.
19. Barkhuijsen H, De Beer R, Van Ormondt D. Improved algorithm for noniterative time-domain model fitting to exponentially damped magnetic resonance signals. J Magn Reson.1987;73:553-557.
20. Pijnappel W, Van den Boogaart A, De Beer R, et al. SVD-based quantification of magnetic resonance signals. J Magn Reson.1992;97:122-134.
Figures