1132
Evaluating Structural and Functional Lower-limb Asymmetries through MRI and Wearable Sensors1Radiology, Stanford University, Stanford, CA, United States, 2Bioengineering, Stanford University, Stanford, CA, United States, 3Electrical Engineering, Stanford University, Stanford, CA, United States, 4Mechanical Engineering, Stanford University, Stanford, CA, United States, 5Orthopaedic Surgery, Stanford University, Stanford, CA, United States, 6Biomedical Data Science, Stanford University, Stanford, CA, United States
Synopsis
Current evaluation methods of rehabilitation following acute musculoskeletal injuries are largely qualitative. MRI and biomechanics tools can provide sensitive, quantitative measures of knee joint and lower extremity muscle changes, but the relationship between MRI and gait markers is not well characterized. We combined an MRI protocol with wearable sensors in healthy participants to characterize the relationship between gait kinematic asymmetries and thigh muscle and cartilage morphology and composition. We show that vastus lateralis (VL) muscle microstructure assessed via Diffusion Tensor Imaging (DTI) may be sensitive to gait variations. Future work may further explore these correlations in patients with musculoskeletal injuries.
Introduction
Evaluation of rehabilitation following acute musculoskeletal injuries, such as anterior cruciate ligament (ACL) injury, is largely limited to qualitative functional assessment1,2. In contrast, MRI and biomechanics tools can provide sensitive, quantitative measures of knee joint and lower extremity muscle changes3,4. However, prior knee MRI studies in ACL-injured patients have largely ignored skeletal muscle - the primary target for injury rehabilitation5,6. Diffusion Tensor Imaging (DTI) is sensitive to atrophic/hypertrophic microstructural changes in muscle and may provide such insight into muscle quality and function7,8. Furthermore, injury rehabilitation aims to achieve bilateral gait symmetry, but quantifying gait kinematics requires time-consuming expensive studies in gait labs9. Thus, to better understand structural-functional joint changes following acute injuries and during rehabilitation, in this study we combine an MRI protocol with a portable technique for assessing gait kinematics using wearable sensors. We characterize the relationship between gait kinematic asymmetries and thigh muscle and patellofemoral cartilage morphology and composition.Methods
Five healthy participants (3 female, age: 27±2 years, BMI: 23±1) participated in this study. MRI scans were conducted using a 3T MRI scanner (SIGNA Premier, GE Healthcare). Participants underwent a multi-stack upper leg bilateral scan with a flexible coil (AIR coil, GE Healthcare) that included DTI and Dixon water/fat-separated images, to assess muscle morphology (Dixon: 3D GRE, matrix size=256x256x46, voxel size=1.56x1.56x5 mm3, TR=14 ms, TE1=1.2 ms, 3min58s. DTI: single-shot EPI readout, b=0 s/mm2 (3 volumes) and b=400 s/mm2 (15 directions), matrix =256x256x26, voxel=1.56x1.56x6 mm3, TR=3000ms, TE=43 ms, 8min15s). Participants then underwent a simultaneous bilateral knee scan using a quantitative double-echo in steady-state sequence (qDESS) with dual 16-channel flexible coil-arrays10, to assess knee cartilage (matrix size=512x512x160, voxel size=0.31x0.31x1.4 mm3, TR=15.5ms, TE=5.2ms, 2min41s).The vastus medialis (VM), vastus lateralis (VL), and rectus femoris (RF) muscles were manually segmented using Dixon scans to compute Volume and Cross-Sectional Area (CSA) (Fig.1). The DTI scans were registered to the Dixon-water image to calculate Fractional Anisotropy (FA), Axial Diffusivity (AD), Radial Diffusivity (RD), and Mean Diffusivity (MD) (Fig.2). Femoral and patellar cartilage were automatically segmented and subdivided into 4 anatomical subregions (deep/superficial for medial and lateral sides) from qDESS images using a deep learning-based algorithm and manually corrected as necessary11(Fig.3). We examined the patellofemoral joint as the patella is attached to the quadricep muscles and articulates with the femur. Cartilage T2 relaxation times were calculated by analytically inverting the qDESS signal model12 (Fig.3).
Following imaging, participants underwent a biomechanical assessment using portable wearable sensors (Cionic, San Francisco, CA). A total of five inertial measurement units (IMUs) were attached to each shank and thigh, and the central pelvis to measure knee and hip kinematics during 20 seconds of overground gait at a self-selected walking pace (Fig.4).
Bilateral muscle asymmetries (B-MA) were computed using the ratio of right to left leg in all muscles for Volume, CSA, FA, AD, RD, and MD. Ratios of bilateral cartilage volume and cartilage T2 within subregions were computed using the ratio of right knee cartilage to left knee cartilage. Ratios of inter-limb gait asymmetries for flexion-extension knee and hip joint angles were computed using a symmetric Kullback-Leibler divergence (KLD) metric (Fig.4). A Pearson correlation (R) was used to quantify the relationship between gait asymmetry compared to muscle asymmetry and cartilage asymmetry (α=0.05).
Results
B-MA for AD and MD in the VL muscle significantly correlated with knee flexion KLD, R = -0.93 and -0.91 (p=0.02 and 0.03) respectively. B-MA for all DTI derived metrics in the VL significantly correlated with hip flexion KLD: FA, AD, RD, MD, R = 0.91, -0.93, -0.94, -0.94 (p=.03, .02, .02, .02) respectively. B-MA for all morphological and DTI derived metrics in the VM and RF muscles had lower correlation with hip flexion KLD or knee flexion KLD. Bilateral cartilage T2 asymmetries and volume asymmetries had lower correlation with hip flexion KLD or knee flexion KLD. All correlations are listed in Table 1.Discussion
We demonstrated a successful workflow combining MRI and wearable sensors to evaluate structural-functional lower-limb asymmetries. Our technique for characterizing muscle microstructure in the VL muscle through DTI showed heightened sensitivity to gait variations compared to morphology-based measures alone and therefore offers potential for quantitatively monitoring change during injury rehabilitation. The VL plays a significant role in knee and hip flexion-extension for physiological tasks including knee stabilization and bearing body weight. Therefore, functional gait asymmetries and subtle microstructural muscle variations detected by DTI may influence one another. However, other factors may bias diffusion measurements, such as improper fat suppression due to B0 inhomogeneities. Of the muscles examined, the VL is scanned furthest from isocenter during MRI and is most likely susceptible to this bias. Nonetheless, these baseline asymmetry values and correlations in healthy participants may inform future studies with more participants and patients with musculoskeletal injuries.Conclusion
By combining MRI and wearable sensors to evaluate lower-limb asymmetry in healthy participants, we demonstrated that our technique for characterizing quadriceps muscle microstructure showed heightened sensitivity to gait variations compared to morphology-based measures alone. Our results in healthy participants may inform future studies examining patients with musculoskeletal injuries.Acknowledgements
Research support provided by NIH R01 AR077604, NIH R01 EB002524, NIH K24 AR062068, the Precision Health and Integrated Diagnostics (PHIND) Seed Grant from Stanford University, Philips, GE Healthcare, Cionic (in-kind support), Wu Tsai Human Performance Alliance.
References
1. Barber-Westin SD, Noyes FR. Scientific Basis of Rehabilitation After Anterior Cruciate Ligament Autogenous Reconstruction. In: Noyes’ Knee Disorders: Surgery, Rehabilitation, Clinical Outcomes. Elsevier; 2017:268-292.
2. Noyes FR, Barber-Westin S. Early Postoperative Rehabilitation to Avoid Complications and Prepare for Return to Sport Training. In: Return to Sport after ACL Reconstruction and Other Knee Operations. Cham: Springer International Publishing; 2019:223-260.
3. Pietrosimone B, Loeser RF, Blackburn JT, et al. Biochemical markers of cartilage metabolism are associated with walking biomechanics 6-months following anterior cruciate ligament reconstruction. J Orthop Res. 2017;35(10):2288-2297.
4. Kogan F, Fan AP, Monu U, et al. Quantitative imaging of bone–cartilage interactions in ACL-injured patients with PET–MRI. Osteoarthritis Cartilage. 2018; 26(6):790-796.
5. Russell C, Pedoia V, Amano K, et al. Composite metric R2 - R1rho (1/T2 - 1/T1rho) as a potential MR imaging biomarker associated with changes in pain after ACL reconstruction: A six-month follow-up. J Orthop Res. 2017;35(3):718-729.
6. Su F, Pedoia V, Teng HL, et al. The association between MR T1ρ and T2 of cartilage and patient-reported outcomes after ACL injury and reconstruction. Osteoarthritis Cartilage. 2016; 24(7):1180-1189.
7. Yanagisawa O, Kurihara T, Kobayashi N, et al. Strenuous resistance exercise effects on magentic resonance diffusion parameters and muscle-tendon function in human skeletal muscle. J Magn Reson Imaging. 2011;34(4):887-894.
8. Froeling M, Oudeman J, Strijkers GJ, et al. Muscle changes detected with diffusion-tensor imaging after long-distance running. Radiology. 2015; 274(2):548-562.
9. Toro B, Nester CJ, Farren PC. The status of gait assessment among physiotherapists in the United Kingdom. Arch Phys Med Rehabil. 2003;84(12):1878-1884.
10. Chaudhari A, Black M, Eijgenraam S, et al. Five-minute knee MRI for simultaneous morphometry and T2 relaxometry of cartilage and meniscus and for semiquantitative radiological assessment using double-echo in steady-state at 3T. J Magn Reson Imaging. 2017;47(5):1328-1341.
11. Desai A, Barbieri M, Mazzoli M et al. DOSMA: A deep-learning, open-source framework for musculoskeletal MRI analysis. Proc Intl Soc Mag Reson Med. 2019: abstract #1135.
12. Sveinsson B, Chaudhari A, Gold G et al. A simple analytic method for estimating T2 in the knee from DESS. Magn Reson Imaging. 2017;38:63-70.
Figures
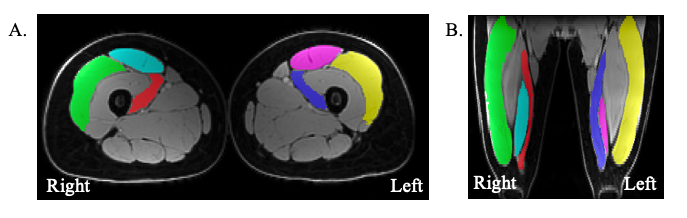
Figure 1: A. Manually segmented muscles (green/yellow = vastus lateralis (VL), red/blue = vastus medialis (VM), teal/pink = rectus femoris (RF)) on an example axial Dixon-water upper leg bilateral image. B. Manually segmented muscles (green/yellow = VL, red/blue = VM, teal/pink = RF) on an example coronal Dixon-water upper leg bilateral image.
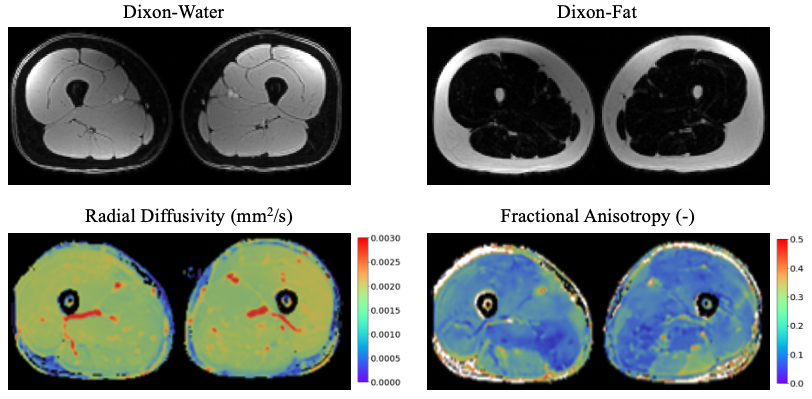
Figure 2: Bilateral quadricep MRI muscle image contrasts: Dixon-water image, Dixon-fat image, radial diffusivity (RD) image, and fractional anisotropy (FA) image. RD indicates the apparent diffusion coefficient in the direction perpendicular to the primary axis of a muscle fiber. FA reflects the anisotropy of diffusion through a muscle fiber; a FA value of one indicates diffusion occurs only in a single direction, and a FA value of zero indicates diffusions occurs equally in all directions.
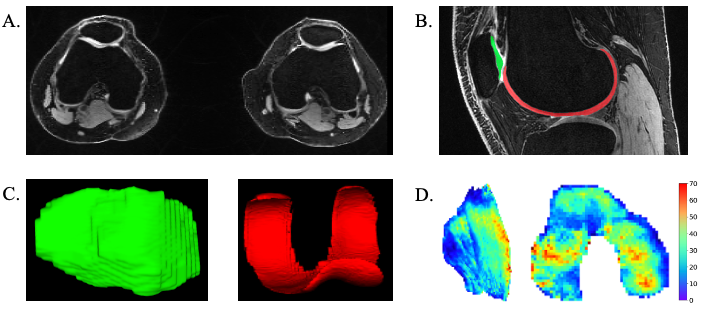
Figure 3. A. Bilateral axial quantitative double-echo in steady-state (qDESS) image. B. Semi-automated segmented cartilage in the patellofemoral joint (red = femoral cartilage, green = patellar cartilage) in the knee on a sagittal qDESS image. C. 3D projections of segmented patellar cartilage (left) and femoral cartilage (right). D. Unrolled cartilage T2 maps for patellar cartilage (left) and femoral cartilage (right). T2 maps are in units of milliseconds.
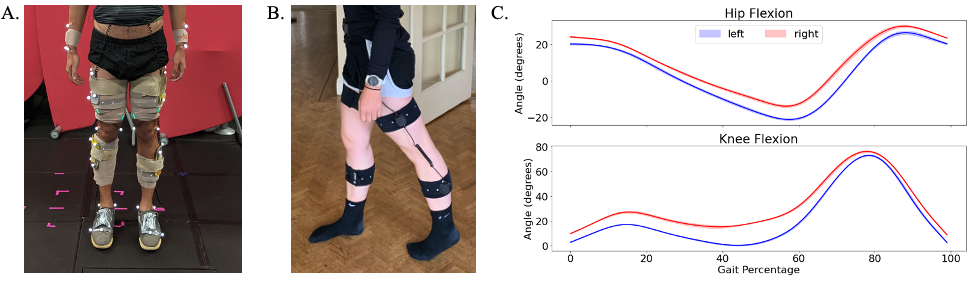
Figure 4: A. Standard gait lab mobile capture equipment. B. Portable gait sensors used for gait capture in this study. Standard gait lab setup and data acquisition usually lasts approximately two hours, whereas our portable setup and data acquisition lasts approximately 15 minutes. C. Example participant knee and hip flexion kinematic curves for left and right legs at a self-selected comfortable walking pace. A gait cycle begins at the heal strike of one foot (0%) and continues until the heel strike of the same foot for the next step (100%).

Table 1: A. Bilateral muscles asymmetries correlation to knee flexion Kullback-Leibler Divergence (KLD) and hip flexion KLD. B. Bilateral cartilage T2 relaxation time asymmetries and cartilage volume asymmetries correlation to knee flexion KLD and hip flexion KLD. (* = p<0.05)