1131
Signal-to-noise requirements for accurate and precise perfusion parameter estimation with pulsed arterial spin labeling MRI in skeletal muscle1C.J. Gorter Center for High Field MRI, Department of Radiology, Leiden University Medical Center, Leiden, Netherlands, 2Norwich Medical School, University of East Anglia, Norwich, United Kingdom, 3Department of Neurology, Leiden University Medical Center, Leiden, Netherlands, 4Université Paris-Saclay, CEA, CNRS, MIRCen, Laboratoire des Maladies Neurodégénératives, Fontenay-aux-Roses, France
Synopsis
To develop perfusion applications in neuromuscular diseases, we examined the SNR and noise sensitivity of pulsed ASL for estimating microvascular reactivity and perfusion in skeletal muscle. We determined muscle blood flow and arterial transit time in volunteers after exercise and used these to inform simulations to establish the minimum ASL SNR required for accurate and precise perfusion parameter estimation. We observed a peak SNR of 10 in the tibialis anterior muscle. Simulations indicated that SNR>6 is sufficient for accurate parameter estimation, while SNR>12 is preferred for good precision. These findings will inform future exercise ASL protocol development in patient cohorts.
INTRODUCTION
Perfusion and microvascular reactivity are fundamental to the healthy function of muscle. Changes in these parameters could be informative for pathologies where muscle is less able to match oxygen demands during activity, and where regional differences in disease progression have been observed, such as in muscular dystrophies.1 Both perfusion and microvascular reactivity can be measured directly via ASL; however, ASL has a relatively low signal-to-noise ratio (SNR), which is further limited by the markedly lower perfusion seen in muscle as compared to the brain. To obtain measurable perfusion and microvascular reactivity measures in this inherently low-SNR application, an exercise challenge is required. Exercise ASL protocols are often developed in healthy volunteers, but they may not be directly translatable to patient cohorts, where both perfusion and exercise compliance are expected to be lower. It is important, therefore, to assess the SNR of such protocols to ascertain whether perfusion parameter estimation can tolerate these challenges.In this study, we examine the SNR and noise sensitivity of our split-label FAIR ASL method—recently developed to study muscle microvascular reactivity and perfusion in the lower leg.2 Using in vivo and in silico analyses, we determine muscle blood flow (MBF) and arterial transit time (ATT) in volunteers after exercise and establish minimum SNRs for accurate and precise parameter estimation.
METHODS
We recruited 13 volunteers from a local database. MRI data were acquired at 3T (Ingenia; Philips Healthcare, NL) with an eight-element array—around the right lower leg—for signal reception. After localisers, an axial three-point multi-acquisition Dixon scan was acquired as an anatomical reference, centred inferior to the tibial plateau at 40% of the length of the tibia.Split-label ASL-MRI was colocalised with the Dixon scan, and consisted of single-shot three-echo EPI (TR/TE/∆TE=3000/14.0/17.4ms; SENSE factor=2.3; FOV=190mm×190mm×86mm; voxel-size=3×3×8mm3; 2 slices, gap=70mm) incorporating a Look-Locker scheme to sample ten post-label delays (PLDs, 600:200:2400ms) for perfusion quantification. Further, a QUIPSS module was applied proximal to both slices, between PLDs 3–4, to obtain a sharp labelling bolus after 1,000ms. SPIR fat suppression was used to suppress subcutaneous and bone marrow fat.
ASL-MRI was applied during ~3mins of rest, 5mins of exercise, and a further 10mins rest. Exercise consisted of 5mins of dynamic dorsiflexion with a load set to 25% of the maximum voluntary contraction, determined using a handheld dynamometer. Finally, representative SNRs were determined via a noise scan without RF or gradients.3
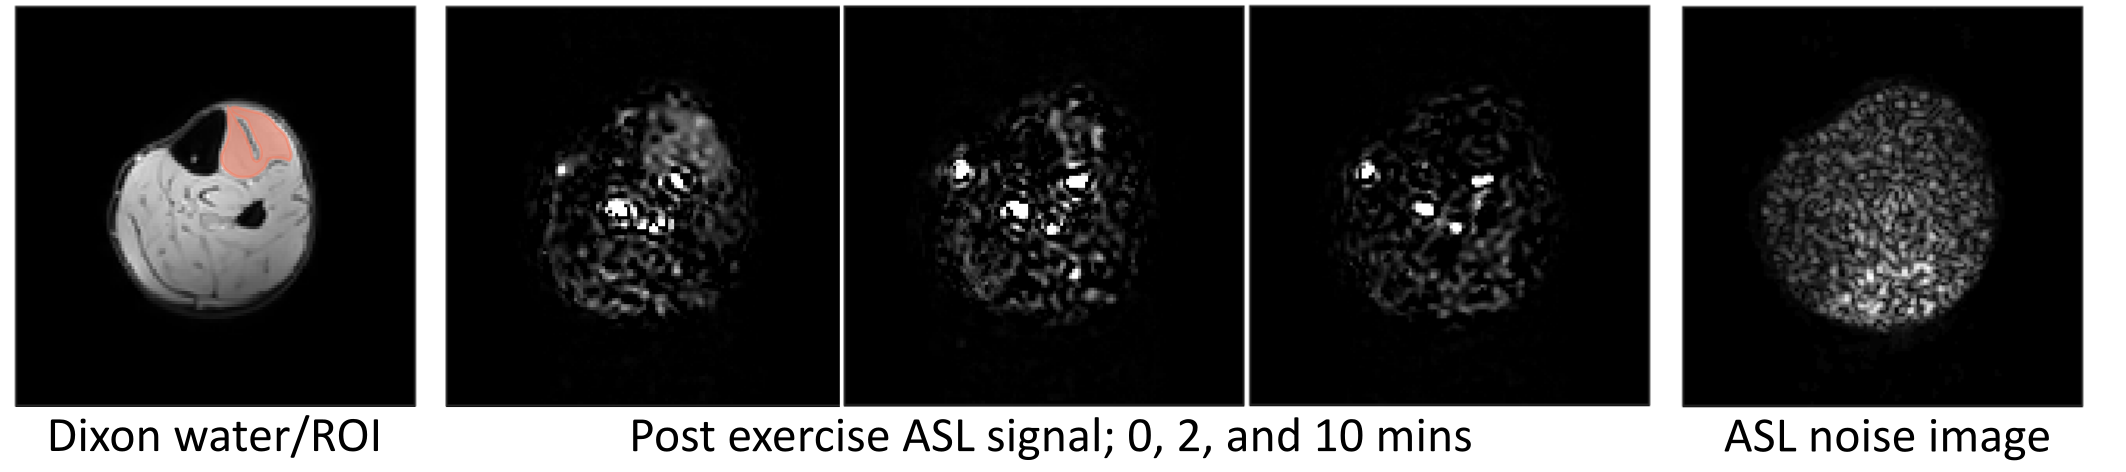
Analysis was performed in MATLAB (R2019b). Regions of interest (ROIs) were drawn in the tibialis anterior on Dixon water images. Dixon images, and ROIs, were registered to ASL source images using MATLAB’s ‘imregdemons’ function. The average ASL signal was calculated per ROI, for each slice, PLD, and dynamic and was used to determine SNR as per Yu et al.3 M0 was estimated per dynamic and MBF and ATT were least-squares fitted with the Buxton general kinetic model for pulsed ASL.
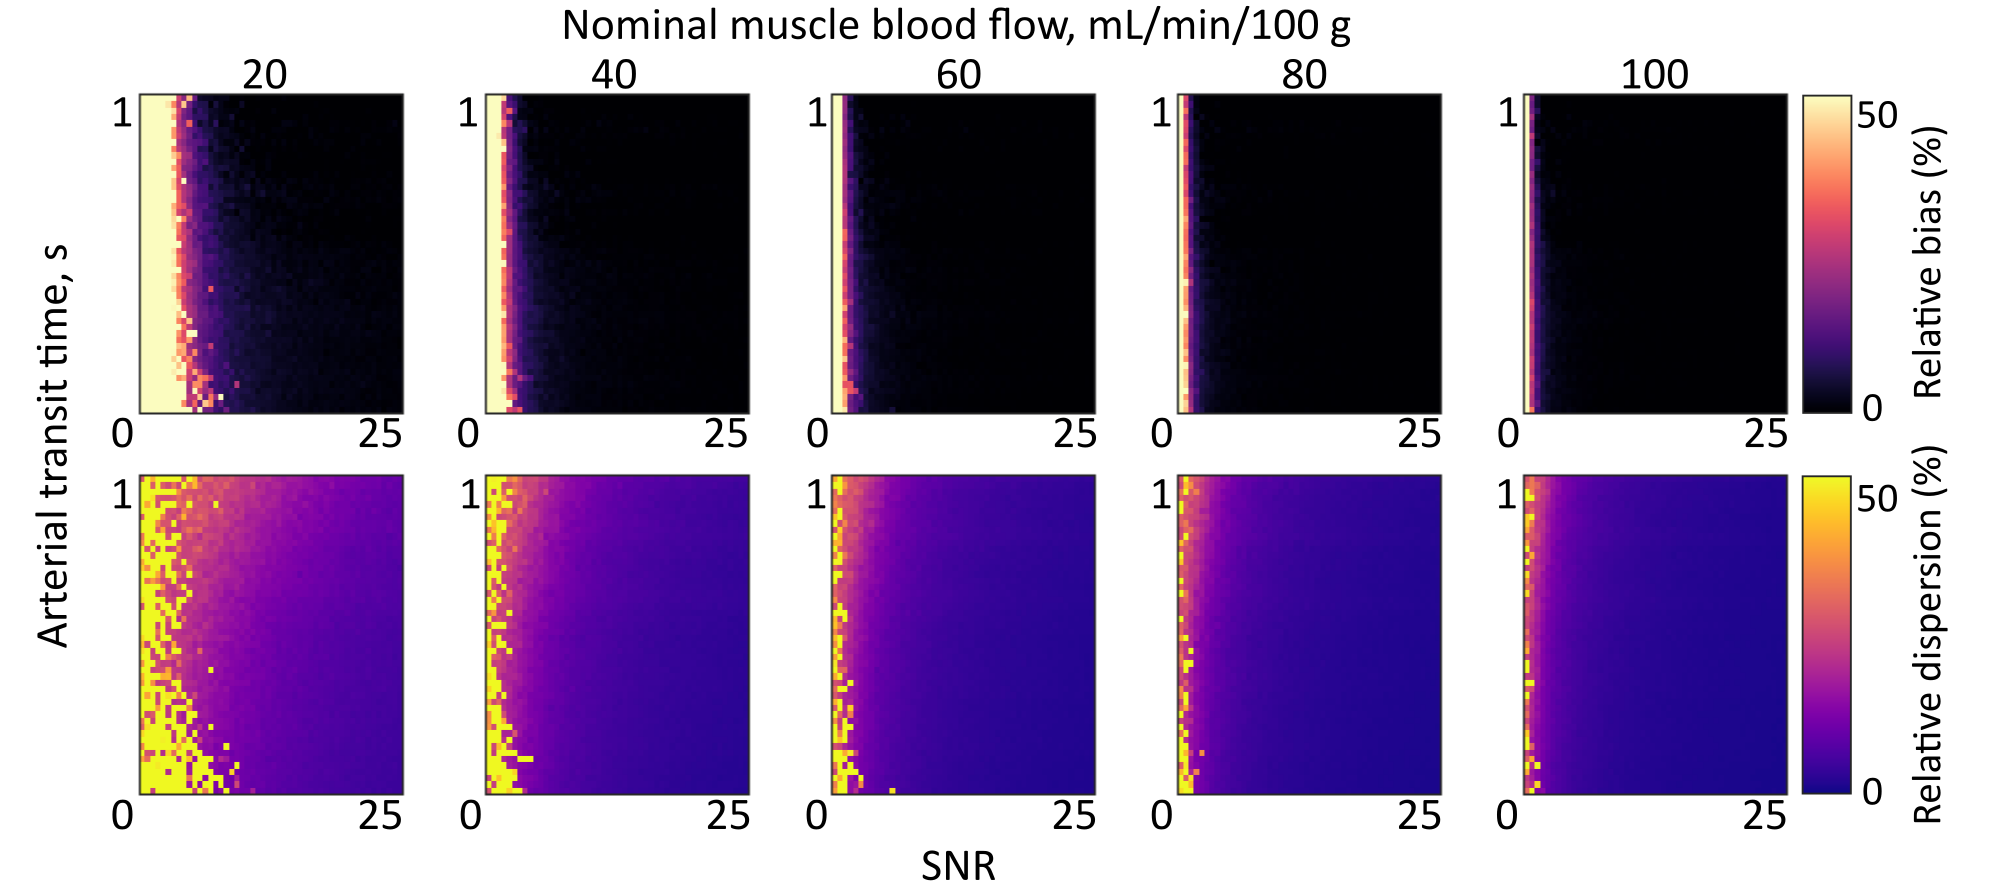
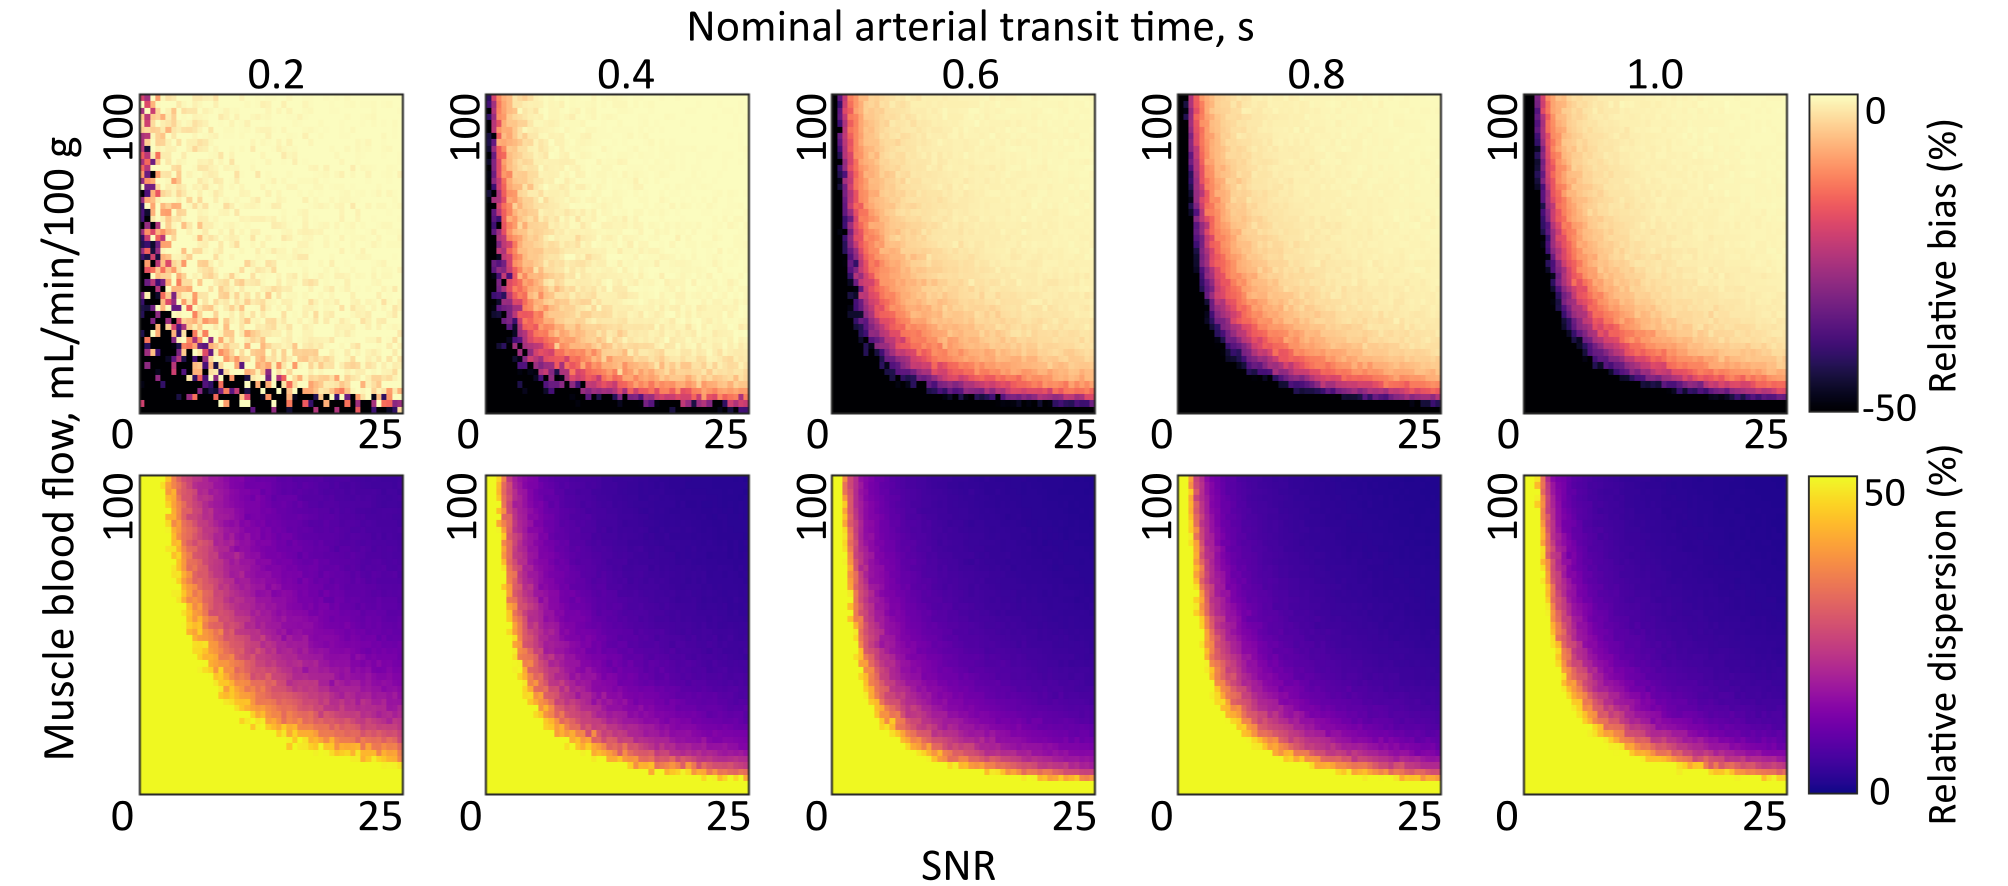
To determine SNR requirements for ASL parameter estimation in muscle, Monte Carlo simulations were run based on in vivo MBF and ATT parameters. Buxton curves were generated for five fixed values of MBF (20:20:100mL/min/100g), and 50×50 combinations of ATT (0.02:0.02:1.00s) and SNR (0.5:0.5:25.0); as well as five values of ATT (0.2:0.2:1.0s) with 50×50 combinations of MBF (2:2:100mL/min/100g) and SNR. Zero-mean Gaussian noise was added to curves in quadrature to create 250 noise realisations, with the SD given by the maximum ASL signal intensity for MBF=60 and ATT=0.6s. Noisy Buxton curves were fitted as per in vivo data, and estimates were compared to ground truth values to determine bias (accuracy) and dispersion (precision) in the presence of noise.4
RESULTS
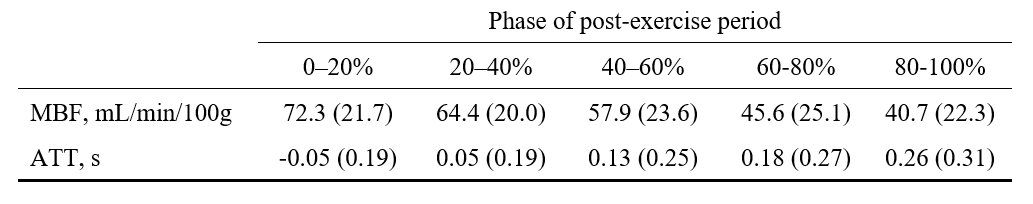
Figure 1 shows representative imaging data, while Figure 2 gives ASL parameters estimated in muscle in all participants. The peak estimated ASL SNR in the tibialis anterior was 10.Figures 3 and 4 show MBF and ATT bias and dispersion matrix plots, respectively, for a range of SNRs. In general, SNR≥6 is sufficient for accurate perfusion parameter estimation (bias<10%) for all but the lowest of MBF values, while SNR≥12 is preferred for good precision (dispersion<10%).
DISCUSSION
In this work we report typical pulsed ASL muscle perfusion parameters in healthy volunteers. Our results show that accurate parameter estimation is possible for SNRs of 6 or greater. This will inform future studies in patients with neuromuscular diseases, where both perfusion and SNR are expected to be limited, along with capacity to perform in-scanner exercise. Reduced load exercise protocols will be tested in healthy volunteers, to determine where compromises to SNR and exercise intensity can be made to improve acceptability without compromising perfusion estimation accuracy and precision.This work will shortly be expanded with the addition of muscle ASL repeatability data in healthy volunteers. Further, more-detailed simulations will be used to identify optimal PLD timings and number of PLDs for more robust muscle perfusion estimation in the presence of noise, similar to work by Woods et al. and Bladt et al. in the brain.5,6
In conclusion, we show minimum SNR requirements for accurate and precise pulsed ASL perfusion estimates in skeletal muscle, along with the expected normal ranges of perfusion parameters. These findings will determine future MRI and exercise protocol development in neuromuscular disease cohorts.
Acknowledgements
This work was supported by the Netherlands Organisation for Scientific Research (NWO), under the VIDI research programme, project number 917.164.90.References
1. Dietz AR, Connolly A, Dori A, Zaidman CM. Intramuscular blood flow in Duchenne and Becker muscular dystrophy: quantitative power Doppler sonography relates to disease severity. Clinical Neurophysiology. 2020;131(1):1-5.
2. Baligand C, Hirschler L, Veeger TT, Václavů L, Franklin SL, van Osch MJ, Kan HE. A split‐label design for simultaneous measurements of perfusion in distant slices by pulsed arterial spin labeling. Magnetic Resonance in Medicine. 2021; 86:2441– 2453.
3. Yu J, Agarwal H, Stuber M, Schär M. Practical signal‐to‐noise ratio quantification for sensitivity encoding: application to coronary MR angiography. Journal of Magnetic Resonance Imaging. 2011; 33(6):1330-40.
4. Cameron D, Bouhrara M, Reiter DA, Fishbein KW, Choi S, Bergeron CM, Ferrucci L, Spencer RG. The effect of noise and lipid signals on determination of Gaussian and non‐Gaussian diffusion parameters in skeletal muscle. NMR in Biomedicine. 2017; 30(7):e3718.
5. Woods JG, Chappell MA, Okell TW. A general framework for optimizing arterial spin labeling MRI experiments. Magnetic Resonance in Medicine. 2019; 81(4):2474-2488. doi: 10.1002/mrm.27580.
6. Bladt P, den Dekker AJ, Clement P, Achten E, Sijbers J. The costs and benefits of estimating T1 of tissue alongside cerebral blood flow and arterial transit time in pseudo‐continuous arterial spin labeling. NMR in Biomedicine. 2020;33(12):e4182.
Figures