1130
Relationships Between Muscle Function, Muscle Fat, and Architecture Measured by MRI in Vivo1Kinesiology, University of Massachusetts Amherst, Amherst, MA, United States, 2Institute for Applied Life Sciences, University of Massachusetts Amherst, Amherst, MA, United States, 3Carle Clinical Imaging Research Program, Carle Health, Urbana, IL, United States, 4Stephens Family Clinical Research Institute, Carle Health, Urbana, IL, United States
Synopsis
The purpose of this work was to investigate the associations between skeletal muscle function and markers of fat content, diffusivity, and architecture. Combining MR techniques that measure muscle structure in vivo with muscle strength measures can elucidate mechanisms other than muscle size that may contribute to functional impairments. This study identified variables (e.g., fascicle length, muscle curvature, pennation angle, fat fraction) that are worthy of investigation in conjunction with functional parameters in future research, and highlighted assessment of muscle function across various contraction types and velocities.
Loss of muscle strength is greater than decreases in muscle mass for numerous populations (e.g., aging, obesity, dystrophies) in both longitudinal1 and cross-sectional studies2, suggesting additional contributors to muscle weakness beyond muscle atrophy. It is also known that the arrangement of muscle fibers (i.e., muscle architecture) influences muscle force generation and transmission3. Thus, architectural differences in muscle can influence muscle strength, as well. It is also likely that muscle fat content and diffusion characteristics (e.g., mean diffusivity, MD; fractional anisotropy, FA) are clinically relevant markers in aging, injury, and disease that can be measured in vivo with Dixon multipoint imaging and Diffusion Tensor Imaging (DTI). Thus, the aim of this study was to determine the relationship of fat content, diffusion, and architecture with whole muscle size and strength.
METHODS:
The dominant thigh was studied in 16 adults (30 ± 6 y, mean ± SD; 7 males). Participants laid supine in a Siemens Skyra 3T system using an 18-channel phased array coil combined with a spine coil. An interleaved 6-point Dixon acquisition was used to generate in and out of phase images using a 2D gradient echo sequence. Parameters: TR= 35ms; slice thickness= 5mm; FOV= 240 x 240; TEs= 2.46/6.15, 3.69/7.38, 4.92/8.61ms; matrix= 144×196; GRAPPA factor= 2; flip angle= 15°; 1 average. Additionally, DTI was acquired to quantify diffusion and architectural properties of muscle. Parameters: two b-values= 0, 450 mm·s-2; TR= 4400ms; slice thickness= 5mm; TE= 58ms; FOV= 240 × 240 mm2; averages= 6; matrix= 96 × 96; directions= 12. GRAPPA factor=2 and SPAIR (spectral attenuated inversion recovery) fat suppression were used for DTI. Knee extensor muscles were evaluated using dynamometry, to obtain peak torques (Nm) for isometric and isokinetic contractions from 0 - 240°/s.
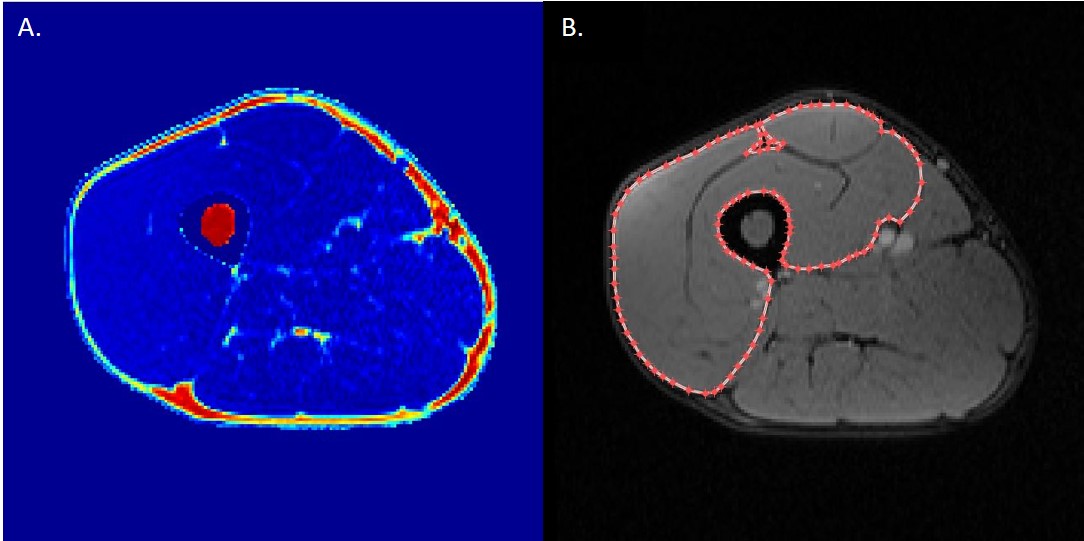
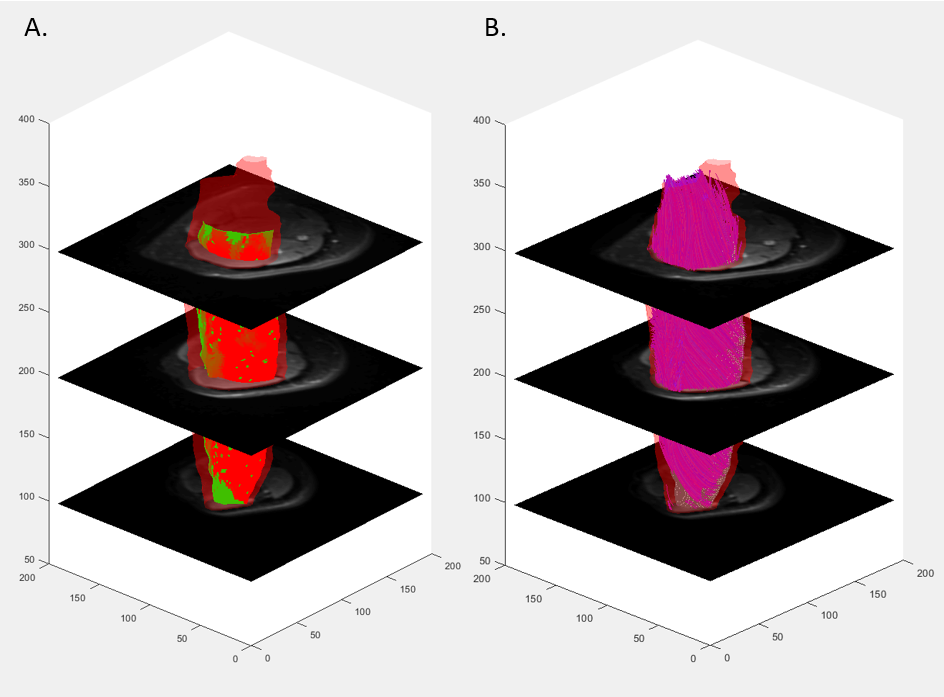
Water and fat images were reconstructed offline using the MATLAB Fatty Riot algorithm4. Regions of interest (ROI) were drawn around the quadriceps in each slice where all 4 muscles were visible (Figure 1b). Fat fraction (FF) and muscle CSA (mCSA; cm2) were determined from compartment volumes. Fat fraction was calculated on a pixel-by-pixel basis from the ratio of fat to total signals and expressed as a percentage of total compartment size. All DTI data were analyzed using the publicly accessible MuscleDTI_Toolbox5. For DTI analyses, an ROI was drawn around the outside of the vastus lateralis to form an image mask to create a border of the muscle. Seed points were placed to define the proximal and distal aponeuroses to create a mesh from which the estimated fiber tracks were propagated (Figure 2a). Fiber tracking was then performed using the 4th order Runge-Kutta integration of the principal eigenvector (ε1) at a step size of ½ of a voxel (0.5 mm) (Figure 2b).
Associations between variables were evaluated using linear regression to determine the relationship between all outcome measures. Data are mean±SD.
RESULTS:
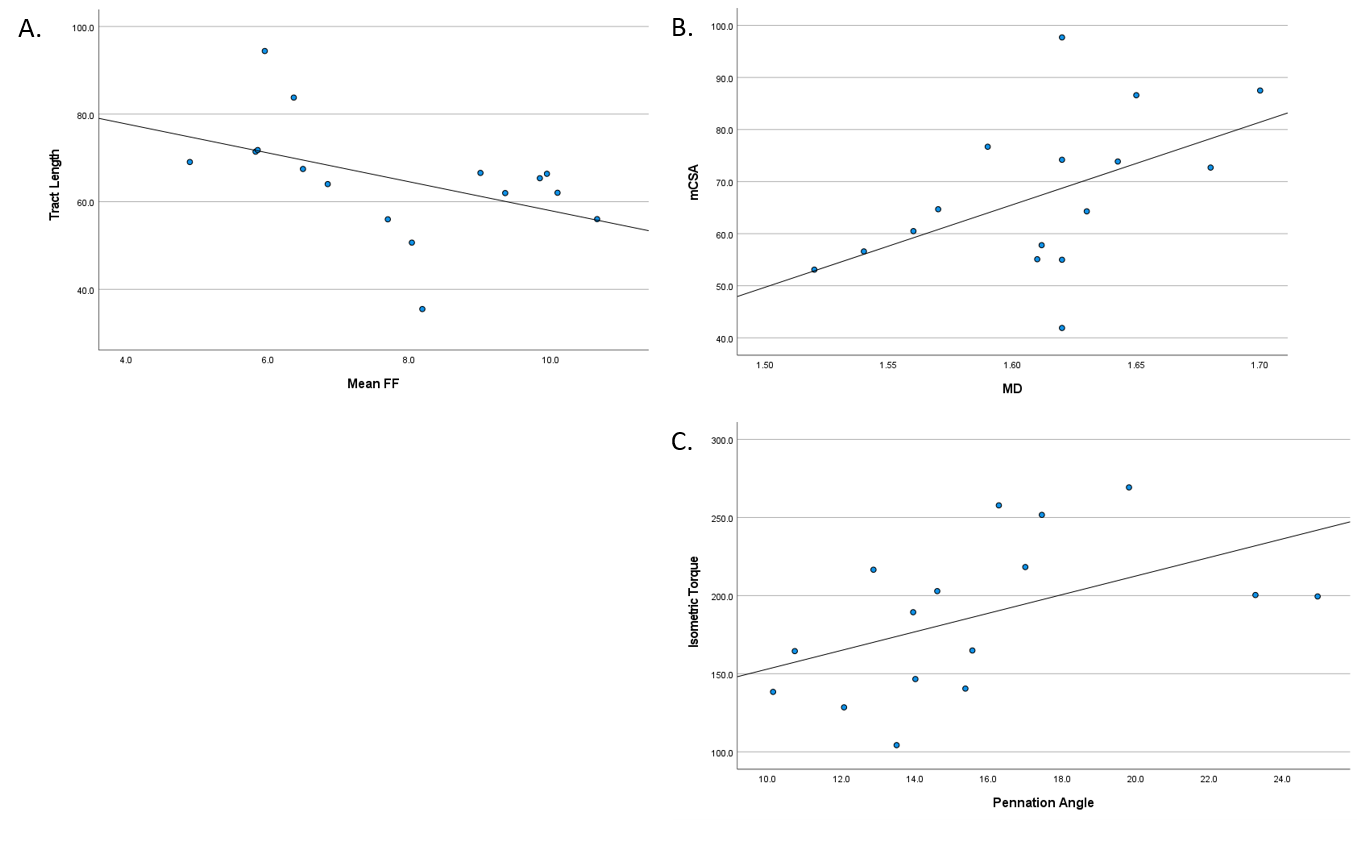
Muscle fat-free CSA was associated with isometric torque (r=0.92; p<0.001), and isokinetic torque at all speeds (r>0.55; p<0.04, all), as expected. In addition to this well-known relationship, mCSA was associated with pennation angle (r=0.58; p<0.02) and MD (r=0.51; p=0.04) (Figure 3b), as previously reported6,7. Fractional anisotropy tended to be associated with mCSA (r=0.47; p=0.07). Likewise, fiber tract length tended to be associated with FF (r=0.46; p=0.07) (Figure 3a). Peak muscle torque was associated with pennation angle (r=0.50; p=0.04) (Figure 3c) and MD (r=0.51; p=0.04) for isometric, but not isokinetic contractions. Fascicle curvature was not associated with measures of muscle size or strength.
DISCUSSION:
This study was the first to provide all reported data in four imaging stacks across the length of the thigh. Our DTI results support previous findings of greater diffusion and pennation angle in adults with greater mCSA6,7. This substantiates the sensitivity of DTI and consistency with previous investigations using other modalities. In this group of young adults, fat content showed a modest relationship with tract length, such that muscles with greater FF had smaller tract length. This finding posits that greater fat content may prematurely shorten or terminate muscle fascicles in groups with known increases in intramuscular fat content. Notably, pennation angle had a moderate relationship with isometric strength which became weaker with increasing isokinetic velocities. Understanding this relationship can assist in determining mechanisms for muscle fatigue in different tasks. Despite failing to reach statistical significance for curvature, these variables are worth exploring in future research to elucidate effects of disuse or disease progression. Additionally, current findings may be due in part to modest levels of fat content and higher physical activity levels. The small range of FF in the muscles of these relatively active young adults may be nominal in impairment of maximal muscle strength.
CONCLUSION:
This study identified potential structural variables to investigate muscle function aside from muscle size. Future research can investigate the associations between muscle architecture and function in groups with known differences in muscle strength (e.g., younger vs. older; clinical vs. control) to identify additional markers of muscle performance that showed trends or modest associations in this young, active, and healthy sample. These data suggest that future studies investigate these variables with various contraction types and velocities, and using submaximal protocols.
Acknowledgements
This work was funded by the National Institutes of Health (NIH R21 AR073511) and National Institute of Arthritis and Musculoskeletal and Skin Diseases (NIH/NIAMS R01 AR073831).References
1.Delmonico MJ, Harris TB, Visser M, Park SW, Conroy MB, Velasquez-Mieyer P, et al. Longitudinal study of muscle strength, quality, and adipose tissue infiltration. The American Journal of Clinical Nutrition. 2009 Oct 28; 90(6):1579-85.
2.Goodpaster BH, Park SW, Harris TB, Kritchevsky SB, Nevitt M, Schwartz AV, et al. The loss of skeletal muscle strength, mass, and quality in older adults: the health, aging and body composition study. Journals of Gerontology. Series A: Biological Sciences & Medical Sciences. 2006 Oct;61(10):1059-64.
3.Lieber, R. L., & Fridén, J. (2000). Functional and clinical significance of skeletal muscle architecture. Muscle & Nerve: Official Journal of the American Association of Electrodiagnostic Medicine, 23(11), 1647-1666.
4.Welch EB et al. FattyRiot - final winning entry of the 2012 ISMRM challenge on water-fat reconstruction. 2015 10 April. https://github.com/welcheb/FattyRiot.
5.Damon, B., Ding, Z., Hooijmans, M., Anderson, A., Zhou, X., Coolbaugh, C. L., George, M.K., & Landman, B. (2021). A MATLAB Toolbox for Muscle Diffusion-Tensor MRI Tractography. Journal of Biomechanics, 110540.
6.Kawakami, Y., Abe, T. & Fukunaga, T. (1993). Muscle-fiber pennation angles are greater in hypertrophied than in normal muscles. Journal of Applied Physiology, 74(6), 2740-2744.
7.Galbán, C. J., Maderwald, S., Stock, F., & Ladd, M. E. (2007). Age-related changes in skeletal muscle as detected by diffusion tensor magnetic resonance imaging. The Journals of Gerontology Series A: Biological Sciences and Medical Sciences, 62(4), 453-458.
Figures